Abstract
The aim of this paper was to evaluate the performance of different swellable polymers in the form of layered matrix tablets to provide controlled therapeutic effect of metoprolol tartrate for twice daily administration. Seven different swellable polymers (carrageenan, hydroxypropylmethyl cellulose, pectin, guar gum, xanthan gum, chitosan, and ethyl cellulose) were evaluated alone or in combination as release-retardant layer. Tablets were tested for weight variation, hardness, diameter/thickness ratio, friability, and drug content uniformity and subjected to in vitro drug-release studies. In addition, the target-release profile of metoprolol tartrate was plotted using its clinical pharmacokinetic data, and the release profiles of the tablets were evaluated in relation to the plotted target release profile. Carrageenan was determined as the best polymer in two-layered matrix tablet formulations due to its better accordance to the target release profile and was selected for preparing three-layered matrix tablets. Carrageenan formulations exhibited super case II release mechanism. Accelerated stability testing was performed on two- and three-layered matrix tablet formulations of carrageenan. The tablets were stored at 25°C/60% relative humidity and 40°C/75% relative humidity for 6 months and examined for physical appearance, drug content, and release characteristics. At the end of the storage time, formulations showed no change either in physical appearance, drug content, or drug-release profile. These results demonstrated the suitability of three-layered tablet formulation of carrageenan to provide controlled release and improved linearity for metoprolol tartrate in comparison to two-layered tablet formulation.
Key words: carrageenan, layered matrix tablet, metoprolol tartrate, stability, target profile
INTRODUCTION
Oral ingestion has long been the most convenient and commonly employed route of drug delivery due to its ease of administration, high patient compliance, few sterility constraints, and flexibility in the design of its dosage form. Developing oral-controlled release tablets for highly water-soluble drugs with constant release rates has always been a challenge to pharmaceutical technologists. Most of these highly water-soluble drugs, if not formulated properly, may readily release the drug at a faster rate and are likely to produce toxic concentrations when administered orally (1). In recent years, multilayered matrix tablets containing one or two layers of release-retardant polymers have been attracting more attention in the design of oral-controlled drug-delivery systems (2,3).
Metoprolol tartrate (MT), 1-(isopropylamino)-3-p-(2-methoxyethyl)phenoxy-2-propanol (2:1) dextro-tartrate, is a selective β1-adrenergic antagonist agent and is widely used in the treatment of angina pectoris, arrhythmias, and hypertension in doses of 100 to 450 mg daily (4). In the literature, different types of controlled-release formulations such as matrix tablets (5), porous tablets (6), mini-matrices produced by hot-melt extrusion (7), sustained-release granules (8), buccal and transdermal applications (9,10), multiple emulsions (11), iontophoretic application (12), and electrolyte-induced peripheral stiffening matrix systems (13) have been developed to improve the clinical efficacy of metoprolol tartrate. There has been only one study about a three-layered matrix tablet formulation of MT which was prepared by guar gum (GG) (2).
The main objective of this study was to identify a formulation that provides a zero-order release of MT for twice-daily administration in the form of layered matrix tablets. The specific objectives of this study were: (1) to evaluate different polymers for release retardation potential and compare with a plotted target release profile; (2) to select the best polymer for follow-up studies that aimed enhancing the fit of the release of MT to the target release profile; (3) to determine of the release mechanism using Peppas equation; and (4) to identify the best stable formulation that achieves the main objective.
MATERIALS AND METHODS
Materials
MT was gifted from Novartis, Turkey. Carrageenan (CN) and Chitosan (CH) were purchased from A&E Connock Perfumery&Cosmetics, UK. Pectin (PC) and different types of ethyl cellulose (EC) (N7, N10, and N100) were donated by Hercules, UK. Hydroxypropylmethyl cellulose (HPMC) (Methocel E 4 M), GG, and xanthan gum (XG) were obtained from Colorcon Ltd. UK, Droguan Alfred L. Wolf GmbH Germany, and Jungbunzlauer Austria, respectively. All other chemicals used in this study were of analytical grade.
Methods
Preparation of Tablets
Two- and three-layered matrix tablets were prepared by direct compression of powders at a pressure of 3,768 kg/cm2 for 10 s on a single-punch hydraulic hand press (Carver Laboratory Press, USA) with flat-faced punches in 13 mm diameter. All tablet formulations contained the same amount (150 mg) of MT.
For the preparation of matrix layer, 150 mg of polymer or polymer mixture (1:1) was mixed with 150 mg of MT using V type mixer for 10 min.
In two-layered matrix tablets, preweighed amount of polymer was placed in die cavity and slightly compressed for uniform spreading. This inferior layer was made of 150 mg polymer as a release-retardant layer. The upper punch was lifted up, and the mixture of matrix layer was placed over the bottom layer in the die cavity and compressed with a maximum force of compression on single station tabletting machine (Carver Laboratory Press, USA) to obtain two-layer matrix tablets.
For the preparation of three-layered matrix tablet formulation, two release-retardant layers containing 75 mg CN were compressed on both sides of the matrix layer. Preweighed amount of polymer equivalent to bottom layer (75 mg) was taken and placed in die cavity and slightly compressed for uniform spreading. The upper punch was lifted up, and the mixture of matrix layer was placed over the bottom layer in the die cavity and again slightly compressed for uniform spreading. The remaining volume of the die cavity was filled with the preweighed amount of CN (75 mg) and compressed with a maximum force of compression on single-station tabletting machine (Carver Laboratory Press, USA) to obtain three-layer matrix tablets.
The content of the formulations was given in Table I, and they are the full composition of tablets; no other excipient was used.
Table I.
Codes and Contents of Formulations
| Codes of formulations | Matrix layer | Release retardant layer | Number of layers |
|---|---|---|---|
| F1 | 150 mg CN | 150 mg CN | 2 |
| F2 | 150 mg CN | 75 mg CN + 75 mg CN | 3 |
| F3 | 150 mg HPMC E4 | 150 mg HPMC E4 | 2 |
| F4 | 150 mg PC | 150 mg PC | 2 |
| F5 | 150 mg GG | 150 mg GG | 2 |
| F6 | 150 mg XG | 150 mg XG | 2 |
| F7 | 150 mg CN:CH (1:1) | 150 mg CN:CH (1:1) | 2 |
| F8 | 150 mg CN:CH (1:1) | 150 mg EC N7 | 2 |
| F9 | 150 mg CN:CH (1:1) | 150 mg EC N10 | 2 |
| F10 | 150 mg CN:CH (1:1) | 150 mg EC N100 | 2 |
All formulations contained 150 mg of MT
CN carrageenan; HPMC hydroxypropylmethyl cellulose; PC pectin; GG guar gum; XG xanthan gum; CH chitosan; EC ethyl cellulose
Physical Tests of Tablets
All of the formulations were evaluated for hardness, diameter/thickness ratio, drug content uniformity, friability, and weight variation (14,15). Tablet diameter and thickness were measured by a micrometer, whereas hardness was evaluated by a hardness tester (Monsanto Type). Diameter/thickness ratio was also calculated.
The friability was determined as the percent weight loss of 10 tablets. Ten tablets were weighed (W1) and rotated for 100 revolutions in 4 min in a Roche friabilitor. The tablets were then weighed (W2) again and percentage friability (%F) calculated with the following equation:
 |
1 |
Analytical Methods: Drug Content Uniformity Testing
In the case of drug content uniformity test, tablets were pulverized and then transferred into a 250-ml volumetric flask. The volume was adjusted with pH 7.4 phosphate buffer and then extracted by shaking for 24 h. The mixture was filtered, and the drug was assayed spectrophotometrically at 222 nm (Shimadzu UV-1208).
In Vitro Drug Release Studies
Validation of UV-Spectroscopic Method
Validation of the analytical method for using the quantification of MT was studied with some parameters (linearity, specificity, precision (repeatability, reproducibility), stability) according to USP XXIV/NF XIX criteria (16). For this aim, two different stock solutions of MT were prepared in pH 1.2 hydrochloric acid buffer and pH 7.4 phosphate buffer by dissolving 10 mg of MT in 10 ml of each media. For preparation of different concentrations, aliquots of stock solutions were transferred into a series of 10-ml standard flasks, and volumes were made with respective media. Eight different concentrations were prepared in the range of 5–40 μg/ml of MT in the pH 1.2 hydrochloric acid buffer for standard graph. In a similar way, eight different concentrations were prepared in the range of 5–40 μg/ml of MT in pH 7.4 phosphate buffer. MT was estimated at 222 nm in both medium. To establish linearity of the proposed method, regression analysis was done for the obtained data.
For determining specificity, MT solutions (10 μg/ml) were prepared in both media along with or without polymers separately. All the solutions were scanned from 450 to 200 nm at a speed of 400 nm/min and checked for change in the absorbance at respective wavelengths.
Precision was determined by studying repeatability and reproducibility. Repeatability was calculated by the relative standard deviation (in percent) of six measurements of a same solution including 10 μg/ml MT. Reproducibility was also estimated by the relative standard deviation (in percent) of measurements from six individual solutions containing 10 μg/ml MT.
Solution stability of MT was also investigated. The solutions of MT were prepared at a concentration of 10 mg/ml in both media. The concentrations of these solutions were measured at appropriate time intervals. At the end of 12 h, the recoveries of these solutions were calculated for each measurement time.
Dissolution Testing of Tablets
In vitro drug-release studies were performed by using a USP dissolution rate apparatus (apparatus 1, 100 rpm, 37 ± 0.5°C) in pH 1.2 hydrochloric acid buffer (900 ml) for 2 h as the average gastric emptying time. Then, the dissolution medium was replaced with a pH 7.4 phosphate buffer (900 ml), and the experiment continued for another 10 h (2). The amount of MT released from the tablets at different time intervals was determined spectrophotometrically at 222 nm (Shimadzu UV-1208). Commercial MT SR tablets were also studied for comparison purpose. During the drug-release studies, all formulations were observed for physical integrity. All experiments were done in triplicate.
Target-Release Profile Generation
In order to select the ideal dissolution profile obtained from formulations, the appropriate target profile of MT was needed for twice-daily administration. The target release profile of MT was plotted according to drug release by zero-order process using Eqs. 2–4 (15–17).
 |
2 |
 |
3 |
 |
4 |
Where, kro: zero-order release rate constant, kd: drug elimination rate constant, Cmax: peak concentration of drug released, Vd: apparent volume of distribution, t1/2: plasma half life, D: maintenance dose; h is the total desired time for sustained action in hours.
Clinical pharmacokinetic data for plotting target release profile of MT are also given below (18,19):
 |
Determination of Release Mechanism
The dissolution data, obtained up to 12 h, were fitted to Peppas equation, and best-fit parameters were calculated in order to determine the release mechanism of tablets (20).
Stability Study
Accelerated stability testing was performed on two- and three-layered matrix tablet formulations of CN (F1 and F2). Each tablet was carefully wrapped by hand with aluminum foil and stored at 25°C/60% relative humidity (RH) and 40°C/75% RH for 6 months (Nüve, TK 252 Test Cabinet, Turkey). The samples were collected at specified time intervals and examined for physical appearance, drug content and release characteristics (21,22).
Statistical Study
Physical tests of tablets, drug content uniformity testing and dissolution testing were replicated at least three times. Comparisons among the multiple means of dissolution data were made by analysis of variance. Tukey HSD or Dunnet C/one-way ANOVA test was used according to the variance homogenity. p < 0.05 was considered to be statistically significant.
RESULTS
Physical Tests of Tablets
Table II shows the characteristics of MT tablets which were prepared as two or three-layered tablets.
Table II.
Characteristics of MT Two- and Three-Layered Tablets
| Code | Average weight (g) ± SD | Diameter/thickness ratio ± SD | Hardness (kg/Monsanto) ± SD | Friability (%) | Drug content (%) ± SD |
|---|---|---|---|---|---|
| F1 | 0.449 ± 0.002 | 4.69 ± 0.03 | 2.23 ± 0.07 | 0.43 | 98.26 ± 1.27 |
| F2 | 0.449 ± 0.001 | 5.05 ± 0.04 | 2.77 ± 0.05 | 0.38 | 99.07 ± 1.33 |
| F3 | 0.452 ± 0.001 | 4.17 ± 0.04 | 4.47 ± 0.03 | 0.23 | 97.71 ± 1.35 |
| F4 | 0.451 ± 0.001 | 4.54 ± 0.04 | 6.10 ± 0.06 | 0.33 | 98.62 ± 0.99 |
| F5 | 0.447 ± 0.002 | 4.21 ± 0.03 | 2.33 ± 0.03 | 0.57 | 98.56 ± 1.02 |
| F6 | 0.452 ± 0.001 | 4.38 ± 0.05 | 4.43 ± 0.03 | 0.33 | 99.29 ± 0.35 |
| F7 | 0.451 ± 0.001 | 4.55 ± 0.03 | 2.90 ± 0.06 | 0.22 | 98.45 ± 1.11 |
| F8 | 0.452 ± 0.002 | 4.29 ± 0.05 | 3.47 ± 0.03 | 0.40 | 99.41 ± 0.58 |
| F9 | 0.450 ± 0.001 | 4.41 ± 0.04 | 4.17 ± 0.03 | 0.30 | 97.21 ± 0.99 |
| F10 | 0.448 ± 0.002 | 4.25 ± 0.04 | 3.27 ± 0.03 | 0.27 | 98.64 ± 1.09 |
| Commercial SR formulation | 0.433 ± 0.001 | 3.28 ± 0.02 | 5.50 ± 0.06 | 0.06 | 99.11 ± 0.88 |
SD standard deviation (n = 3)
Validation of UV-Spectroscopic Method
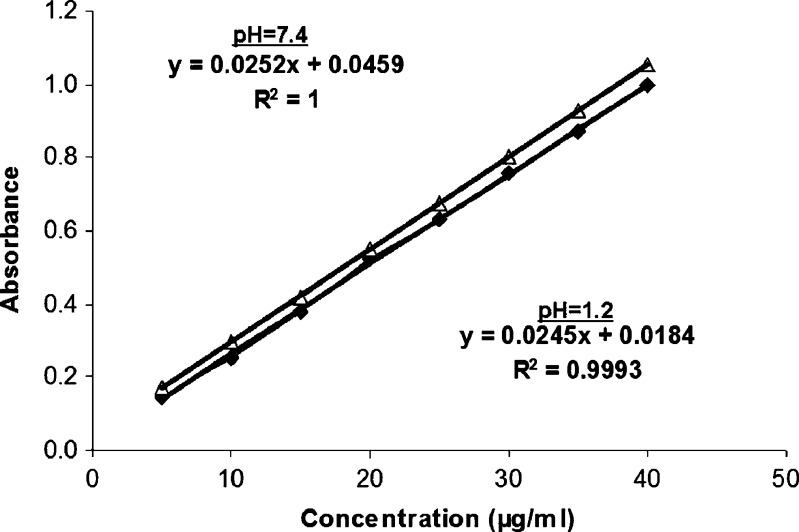
Calculated regression variations of plotted standard curves were Y = 0.0245X + 0.0184 and Y = 0.0252X + 0.0459 in pH 1.2 hydrochloric acid buffer and pH 7.4 phosphate buffer, respectively. Y corresponds to the concentration (μg/ml) and X corresponds to the absorbance. The sensitivity of the standard calibration curve in both media is 5–40 μg/ml. Figure 1 represent the standard curves and equations of MT in both pH 1.2 hydrochloric acid buffer and pH 7.4 phosphate buffer.
Fig. 1.
Standard curves and equations of MT in pH 1.2 hydrochloric acid buffer and pH 7.4 phosphate buffer
The calibration curve for the quantitative estimation of MT in each medium was found linear. Absorbance was measured at 222 nm and the coefficient of determination was r2 = 0.999, indicating good linearity. The specifity tests proved that there was no interference between the polymers and the active substance. The stability test of the solutions showed that MT was stable in each medium for at least 12 hours at room temperature. The precision of the method was determined through repeatability and reproducibility and was expressed as a relative standard deviation (RSD) % of a series of measurements. The result obtained shows a RSD less than 0.5 and 1.2% indicating good repeatability and reproducibility, respectively. This method was used to analyze the amount of the drug dissolved.
In Vitro Drug Release Studies
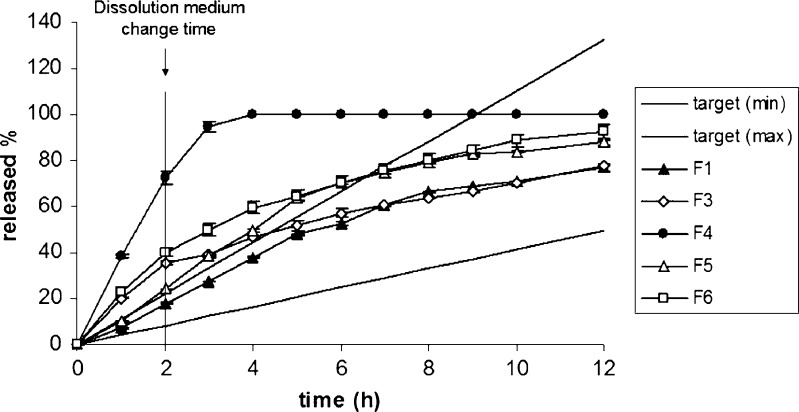
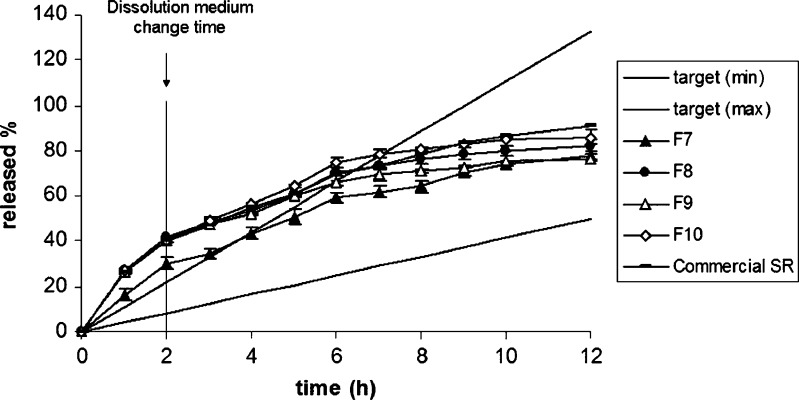
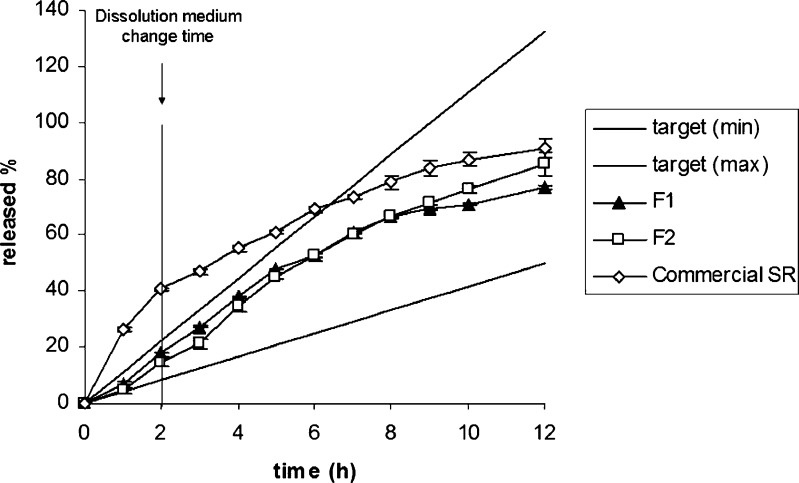
The release of MT from the layered tablet formulations was determined by the methods mentioned above and the release profiles are presented in Figs. 2 and 3. The dissolution profile of the commercial SR product of MT is also given in Fig. 3. Furthermore, the comparison of the release curves of F1, F2, and commercial SR product in relation to the target profile of MT was given at Fig. 4.
Fig. 2.
The effect of polymer type on the release profile of MT; target (min) and target (max) were plotted according to Eqs. 2–4. Target (min) corresponds to high metabolizers and target (max) corresponds to low metabolizers
Fig. 3.
The effect of physical mixtures of CN–CH and the type of EC on the release of MT. Target (min) and target (max) were plotted according to Eqs. 2–4; target (min) corresponds to high metabolizers and target (max) corresponds to low metabolizers
Fig. 4.
The comparison of the release curves of F1, F2, and commercial SR product of MT. Target (min) and target (max) were plotted according to Eqs. 2–4; target (min) corresponds to high metabolizers and target (max) corresponds to low metabolizers
Determination of Release Mechanism
The values of n, k and r2 calculated with Peppas equation (Eq. 5) are listed in Table III.
 |
5 |
Table III.
Release Parameters of MT from Formulations
| Code | Exponent (n) ± SD | Release rate constant (k) ± SD | Correlation coefficient (r 2) |
|---|---|---|---|
| F1 | 0.953 ± 0.011 | 0.948 ± 0.012 | 0.969 |
| F2 | 1.163 ± 0.019 | 0.770 ± 0.013 | 0.973 |
| F3 | 0.511 ± 0.015 | 1.334 ± 0.021 | 0.982 |
| F4 | 0.826 ± 0.009 | 1.594 ± 0.019 | 0.994 |
| F5 | 0.868 ± 0.011 | 1.113 ± 0.024 | 0.947 |
| F6 | 0.544 ± 0.018 | 1.414 ± 0.028 | 0.979 |
| F7 | 0.623 ± 0.015 | 1.254 ± 0.020 | 0.985 |
| F8 | 0.454 ± 0.007 | 1.463 ± 0.031 | 0.980 |
| F9 | 0.453 ± 0.013 | 1.456 ± 0.016 | 0.974 |
| F10 | 0.491 ± 0.021 | 1.454 ± 0.012 | 0.979 |
| Commercial SR product | 0.503 ± 0.028 | 1.437 ± 0.015 | 0.995 |
Each dissolution experiment was replicated at least three times, and the values calculated are expressed as mean ± standard deviation
Where,  is the fractional release, k is the diffusional constant, and n is the diffusional exponent which characterizes the drug-release mechanism.
Stability Study
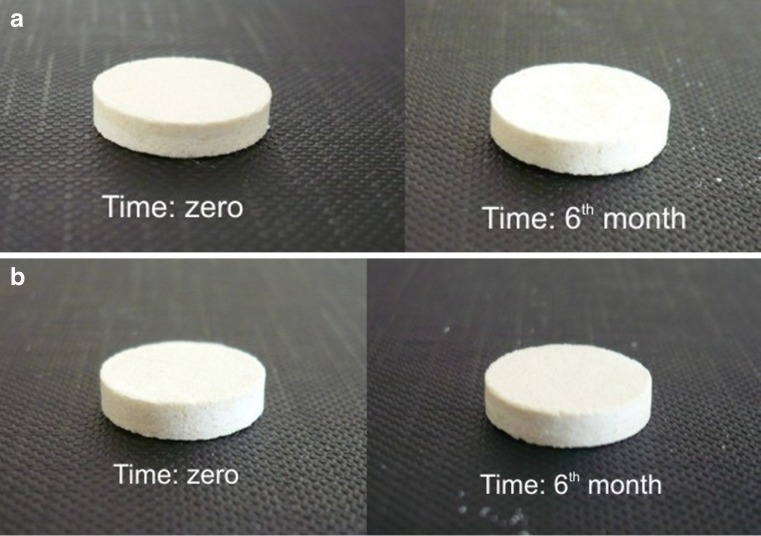
F1 and F2 formulations, which provide appropriate drug release of MT, were selected for stability studies (Table I). Figure 5 shows the pictures of fresh and stored tablet formulations, and Table IV presents the weight changes of the tablets during stability study. The formulations showed no change either in physical appearance, weight, drug content, or drug release profile for both storage conditions.
Fig. 5.
a The picture of fresh and stored F1 formulation. b The picture of fresh and stored F2 formulation
Table IV.
The Weight Changes of the Tablets During Stability Study for 6 Months
| Time (months) | 25°C/60% relative humidity | 40°C/75% relative humidity | ||
|---|---|---|---|---|
| F1 (mg) ± SD | F2 (mg) ± SD | F1 (mg) ± SD | F2 (mg) ± SD | |
| 0 | 450.30 ± 0.57 | 449.61 ± 0.42 | 449.48 ± 0.34 | 450.12 ± 0.28 |
| 1 | 450.51 ± 0.48 | 449.82 ± 0.64 | 449.60 ± 0.52 | 450.30 ± 0.56 |
| 3 | 450.66 ± 0.32 | 449.96 ± 0.53 | 449.75 ± 0.45 | 450.35 ± 0.44 |
| 6 | 450.73 ± 0.55 | 450.01 ± 0.35 | 449.97 ± 0.61 | 450.61 ± 0.33 |
The indicated results are the means of three measurements ± SD
DISCUSSION
Background
MT is a selective β1-adrenergic antagonist agent and widely used in the treatment of angina pectoris, arrhythmias, and hypertension in doses of 100 to 450 mg daily (4). Its absorption is rapid throughout the gastrointestinal tract, and its oral bioavailability has been reported to be about 50%. Because of the short plasma half-life of MT (3 to 4 h), it is necessary to maintain therapeutic drug levels in the blood stream for a long-term therapy (9). MT also has a very high solubility value in water (23). Due to these properties, MT is a suitable candidate for the development of controlled-release formulations.
Swellable polymers widely used in formulations for sustaining drug release are mainly divided into two groups according to their source: synthetic and natural. Hydroxypropylmethyl cellulose, ethyl cellulose and carrageenan, pectin, chitosan, and gums can be given as examples of synthetic and natural polymer groups, respectively. These polymers have been used extensively for the controlled release of numerous drugs. In addition, physical mixtures of anionic and cationic polymers are used in tablet formulations to control the drug release. Carrageenan and chitosan are well-known polymers for preparing controlled-release tablets for many drugs (24,25). Carrageenan is an anionic polymer, and chitosan has cationic properties (26). In the literature, it was shown that a carrageenan–chitosan physical mixture was used to control the release of diltiazem clorhydrate perfectly (27). Ethyl cellulose is a hydrophobic cellulose derivate and has been reported to be an excellent impermeable backing material (28). This backing layer prevents drug loss due to very low water permeability especially for multilayered systems (29,30). In this study, layered matrix tablet formulations of MT were developed with well-known, biocompatible, and swellable polymers using laminated tablet technology to provide controlled therapeutic effect for twice-daily administration of MT.
In the first stage of this study, the release retardation potential of polymers, in relation to calculated target release profile of MT, was evaluated in the form of two-layered tablets. After selection of the best polymer, a tri-layered matrix tablet formulation was developed in the refinement stage of formulation to provide a zero-order release of MT as a twice-a-day dosage form.
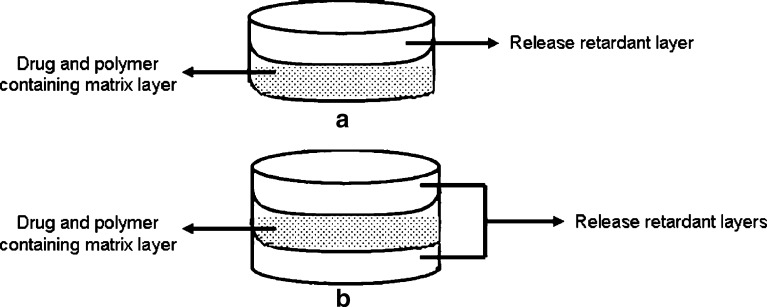
A schematic representation of prepared tablet structure with release retardant layer(s) and matrix layer were shown in Fig. 6.
Fig. 6.
A schematic representation of prepared tablet structure
In Vitro Drug-Release Studies
Matrix-type controlled-release tablet formulations of highly soluble drugs were investigated previously. Most of these studies pointed out that to control the release of these highly soluble drugs was not possible by preparing conventional matrix tablet formulations due to the burst and fast drug release. Therefore, one or two layers of release-retardant polymers are applied on both sides of a matrix tablet (containing the active ingredient) such that the swollen polymer controls the drug release.
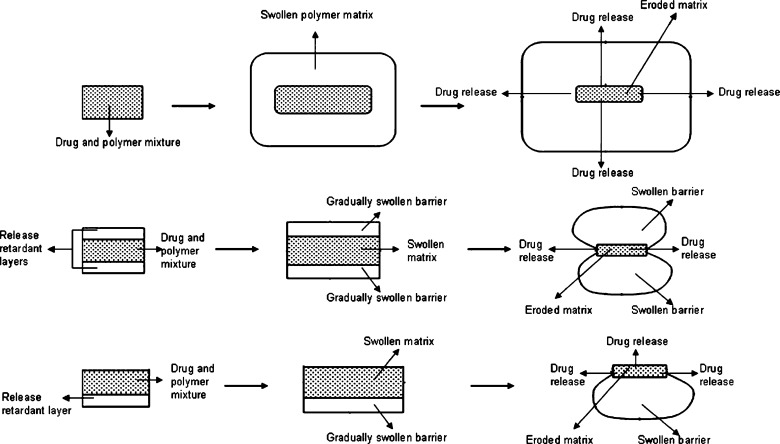
Figure 7 shows the schematic release of drug from conventional matrix tablets, two- and three-layered tablets.
Fig. 7.
A schematic representation and comparison of drug release from conventional matrix tablets, two- and three-layered tablets
The intrinsic capacity of swellable polymers to act as a release-retardant agent in two- and three-layered matrix tablets of MT was studied. Kinetic evaluation (accordance to plotted target release profile of MT and goodness-of-fit for the zero-order release kinetic) was also taken into consideration in formulation development.
MT has two Cmax values for poor and extensive drug metabolization. Therefore, two different kro values of MT were calculated for poor and extensive drug metabolization as 16.59 and 6.23 mg/h, respectively. Two target profiles of MT (target min and target max) were plotted according to concentration versus time and the release profiles of the formulations were evaluated in relation to these target profiles.
The behavior of the polymers was found quite different in dissolution medium. In Fig. 2, the effect of polymer type on the release rate of MT could clearly be seen from the variations of the profiles. It was observed that the drug release from F3, F4, and F6 formulations, which were prepared without carrageenan, was significantly higher than other matrix formulations in pH 1.2 hydrochloric acid buffer solution (p < 0.05).
F3 formulation prepared with hydroxypropylmethyl cellulose matrice showed an initial burst release of MT, owing to time required for the formation of efficient gel layer. This pH independent release behavior is typical property of hydroxypropylmethyl cellulose matrices and is particularly evident for highly soluble drugs (31). Therefore, it can be assumed that the drug-release properties from hydroxypropylmethyl cellulose matrices were insensitive to pH changes of dissolution medium.
When the formulations were evaluated according to their polymer types, pectin (F4) showed less sustained release performance than others. Similar evaluation was also found in the literature (32,33). Sriamornsak et al. investigated the in vitro drug-release profiles of theophylline from pectin matrix tablets in simulated gastric fluid (SGF, pH 1.2) and simulated intestinal fluid (SIF, pH 6.8). The results indicated that the drug release was apparently influenced by the pH of release media, and drug release in SGF was faster than SIF (34). This result was also in accordance with our findings for F4 formulation containing pectin.
The release profile of xanthan gum tablets was found to be out of the target-release profile of MT during first 7 h of the dissolution study. The hydrophilic polymer, xanthan gum, is a well-known release-control agent in hydrophilic matrix formulations to have the ability to hydrate very rapidly in addition to exhibit a great swelling index compared to other gums (35). However, F5 formulation containing guar gum exhibited better sustained-release property than xanthan gum in this study. In addition, gelation properties of xanthan gum are found more or less insensitive to pH as it was described previously (36).
In the literature, it has been shown that anionic polymers can better control the early release of soluble drugs, probably through ionic interactions (37,38). It was shown that λ carrageenan was able to control the initial release of soluble drug at low pH values as an independent of the other characteristics of the dissolution medium. In that study performed by Bonferoni et al., the erosion of carrageenan matrix in distilled water and buffers at pH 1.2 and 6.8 was evaluated. Matrices containing model drugs either salbutamol sulfate or diprophylline were tested for release rate in the same three media. Carrageenan showed its characteristic behavior. Its control of the initial drug release, ascribed to ionic drug–polymer interactions, appears to be remarkably effective and independent of the characteristics of the dissolution medium (36). This result was in accordance with our obtained results for carrageenan. F1, F2, and F5 were able to control the release of MT from the formulations, and their dissolution profiles fell between the two target profiles in the first 2 h. However, only F1 and F2 provided the proper dissolution profiles which were required to be between the two target profiles of MT for 12 h (Fig. 4).
In Fig. 3, the effect of the physical mixtures of carrageenan–chitosan and the type of ethyl cellulose as an impermeable layer on the release of MT are presented. Physical mixtures are used for matrix tablet formulations to control the drug release (27). In our study, carrageenan–chitosan polymeric mixture was examined to investigate the effect of physical mixture on the release rate of MT. It was observed that the carrageenan formulations were better than the carrageenan–chitosan physical mixture (F7) as a prolonged drug-release matrix system. Carrageenan–chitosan tablets could not provide the required drug release especially within the first 3 h. To optimize the dissolution profile of F7, one side of the tablet was covered with different types of ethyl cellulose layer. Although ethyl cellulose was placed as an impermeable release-retardant layer, the release rate of MT was found to be much faster than F7’s formulation rate and the types of ethyl cellulose did not show any significant effect on the release rate of MT (p > 0.05). The release behavior of ethyl cellulose in multiple-layer direct compression tablets was studied by Fassihi et al. in three different release medium (pH 1.2, 5.5, and 7.5) (39). The results showed that the release of model drug (theophylline) was independent from the pH of the dissolution medium.
In our study, the dissolution profile of the commercial SR product of MT did not fit the target profile especially within the first 6 h (Fig. 3 and 4).
Determination of Release Mechanism
The mathematical modeling of drug release from drug-delivery systems has two major benefits: (1) the elucidation of the underlying transport mechanisms and (2) the possibility to predict the resulting drug-release kinetics as a function of the design of the formulation. Depending on the type of the polymer, type of drug, size, shape, and composition of the system, different mass transport phenomena have to be taken into account, e.g., diffusional processes, polymer swelling, and drug and/or polymer dissolution. Thus, it is important to identify the dominating mass transport phenomena and to simplify the model as much as possible (40).
Swellable matrix tablets are activated by water, and the drug release is controlled by the interaction among the water, the polymer, and the drug (31). Due to the water penetration, the gel layer is exposed to continuous changes in its structure and thickness. The mechanism of the formation of an outer gel layer on the matrix surface and the thickness of the gel layer exhibit three distinct regimens. The thickness of the gel layer increases when the solvent penetration is the fastest mechanism and remains constant when the disentanglement and water penetration occur at a similar rate. Finally, the gel-layer thickness decreases when the whole polymer has undergone the glassy–rubbery transition (41).
The quantity of the drug released from the matrix tablets is often analyzed as a function of the square root of time; this is typical for systems where the drug release is governed by pure diffusion. However, the use of this relationship in swellable systems is not completely justified, as such systems can be erodible and the contribution of the relaxation of polymeric chains to drug transport has to be taken into account. Therefore, an analysis of the drug release from swellable matrices must be performed with a flexible model that can identify the different contributions to overall kinetics (31).
In order to obtain the linear release profiles from matrix tablets, some changes could be required. Some researchers have used different mixtures of swellable polymers to provide linear drug release (42,43). Also, changing the geometry of the tablets (44), using polyelectrolyte complexes and mixtures (27), adding new polymer layers to the formulation (2) could be another alternative method for linearized drug release.
The theory of the determination of drug-release mechanism from swellable systems is based on an empirical equation proposed by Ritger and Peppas (20) (Eq. 5).
When n = 0.45, this indicates case I (Fickian) diffusion or square root of time kinetics; when 0.45 < n < 0.89, this indicates anomalous (non-Fickian) diffusion; when n = 0.89, this indicates case II transport; and when n > 0.89, this indicates super case II transport.
Case I diffusion and Case II solute release behavior in swelling controlled systems are unique in that each can be described in terms of a single parameter. Fickian transport is described by a diffusion coefficient while Case II transport is described by a characteristic relaxation constant. In the case of Case II transport, the release kinetics is assumed to be controlled by a rate-limiting relaxation phenomenon. Non-Fickian behavior, by comparison, requires two parameters to describe the coupling of diffusion and relaxation phenomena. Super Case II transport would be the consequence of a plasticization process in the gel layer arising from a reduction of the attractive forces among polymeric chains that increases the mobility of macromolecules (20).
In this study, the values of n fell within the range of 0.453–1.163, indicating that the drug release from the MT tablets is of the non-Fickian and super case II type. Non-Fickian release behavior was observed for F3–F10 and the commercial SR product. Figure 8 shows the appearance of hydroxypropylmethyl cellulose tablets (F3) in dissolution media at different time intervals. The release mechanisms of these formulations were diffusion and polymeric chain relaxation. In these systems, burst effect can be controlled to some extent with swelling and erosion processes. The release rate decreases with time depending on the increase of the diffusion path length. However, this decrease of the release rate is compensated by the increased size of the drug-release area.
Fig. 8.
The appearance of F3 formulation in dissolution media at time 0, 2, and 8 h
Two- and three-layered matrix tablets of MT which were prepared with carrageenan (F1, F2) showed super case II transport mechanism and the n values of these formulations were 0.953 and 1.163, respectively. Similar n values also were reported for carrageenan tablets in the literature (25,45). Figure 9 represent the appearance of carrageenan tablets (F2) in dissolution media at different time intervals. Figure 10 also shows a sideways cross-section of the swollen tablets of F1 and F2. In this case, the release was controlled only by polymeric chain relaxation, and both of the formulations showed nearly linear drug release and behaved as a zero-order release system.
Fig. 9.
The appearance of F2 formulation in dissolution media at time 0, 2, and 8 h
Fig. 10.
Sideways cross-section of the swollen tablets of F1 and F2
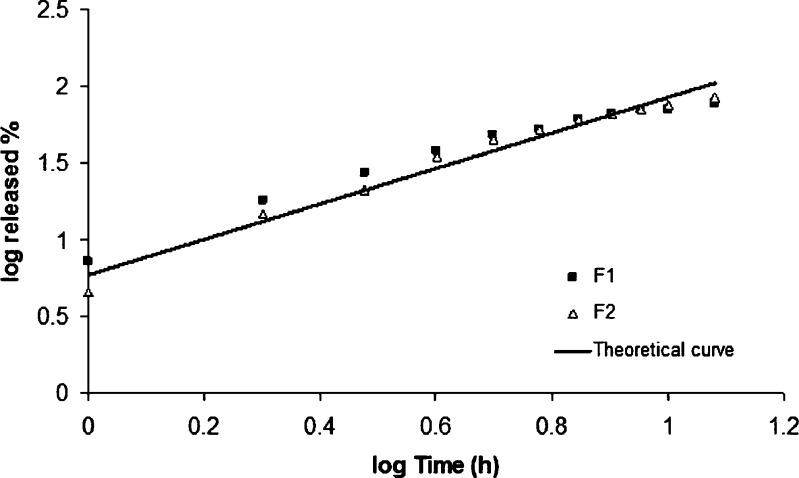
Figure 11 illustrates the agreement between the actual dissolution data and the theoretical curve generated using Eq. 5 for F1 and F2 formulations.
Fig. 11.
Peppas plot of log of MT released versus log of time
The barrier layers hinder the penetration of liquid into the core and modify drug dissolution and release. As mentioned previously, F1 formulation was a two-layered and F2 formulation was a three-layered matrix tablet prepared with carrageenan. Hence, the release of MT from F1 formulation was occurred from the upper area and sideways of tablet, while the release of MT was only possible from the sideways in F2 formulation (Fig. 7). Interestingly, in spite of the different area available for drug release, the dissolution curves were found to be similar for F1 and F2 formulations (Fig. 4).
In order to select ideal formulation, the release pattern of F1 and F2 formulations was tested to check the goodness-of-fit for the zero-order release kinetic (46,47). The goodness-of-fit was evaluated by the residuals and determination coefficients (r2). The results of the r2 and residuals were 0.936, 0.970 and 1,277, 282 for F1 and F2, respectively. From the results of kinetic study, it can be concluded that the three-layer matrix tablet formulation of carrageenan provided better fit with a higher determination coefficient value for zero-order release when compared to the two-layer tablet formulation.
CONCLUSION
In this study, two-layered matrix tablet formulations of metoprolol tartrate were prepared using different swellable polymers, and the release retardation potential of polymers were evaluated in relation to the plotted target release profile of metoprolol tartrate for twice-daily administration. Only the carrageenan formulation showed acceptable accordance to the target-release profile of metoprolol tartrate, and it was selected for preparing three-layered matrix tablets. The three-layered matrix tablet formulation of carrageenan provided better fit to zero-order release and improved linearity in comparison to the two-layered tablet formulation. In addition, carrageenan formulations exhibited good stability profile during the 6-month accelerated stability study. These results clearly demonstrated that carrageenan three-layered matrix tablet formulation is an effective and promising drug-delivery system for twice-daily administration of metoprolol tartrate.
In conclusion, it was possible to design two- and three-layered tablet dosage form of metoprolol tartrate based on multilayered tablet technology. Successful formulation of highly soluble drugs (such as metoprolol tartrate) laminated with hydrophilic matrices (such as carrageenan) was also possible, and it was feasible to achieve zero-order drug-release profile. Bioavailability studies on animals are still in progress to assess the usefulness of this three-layer matrix tablet in comparison with conventional immediate release of metoprolol tartrate tablets.
Acknowledgments
The authors wish to thank Research Foundation of Ege University for financial support given to this study (15/ECZ/2002).
References
- 1.Ye Z, Rombout P, Remon JP, Vervaet C, Van den Mouter G. Correlation between the permeability Metoprolol tartrate through plasticized isolated Ethylcellulose/Hydroxypropyl Methylcellulose films and drug release from reservoir pellets. Eur J Pharm Biopharm. 2007;67:485–490. doi: 10.1016/j.ejpb.2007.02.010. [DOI] [PubMed] [Google Scholar]
- 2.Krishnaiah YSR, Karthikayen RS, Satyanarayana V. A three-layer Guar Gum matrix tablet for oral controlled delivery of highly soluble Metoprolol tartrate. Int J Pharm. 2002;241(2):353–366. doi: 10.1016/S0378-5173(02)00273-9. [DOI] [PubMed] [Google Scholar]
- 3.Hong S, Oh SY. Dissolution kinetics and physical characterization of three-layered tablet with poly(ethylene oxide) core matrix capped by Carbopol. Int J Pharm. 2008;356:121–129. doi: 10.1016/j.ijpharm.2008.01.002. [DOI] [PubMed] [Google Scholar]
- 4.Gennaro AR. Remington’s Pharmaceutical Sciences. 18. Eaton: Mack; 1990. [Google Scholar]
- 5.Eddington ND, Marroum P, Uppoor R, Hussain A. Development and internal validation of an in vitro–in vivo correlation for a hydrophilic Metoprolol tartrate extended-release tablet formulation. Pharm Res. 1998;15:466–473. doi: 10.1023/A:1011988601696. [DOI] [PubMed] [Google Scholar]
- 6.Cosijns A, Vervaet C, Luyten J, Mullens S, Siepmann F, Van Hoorebeke L, et al. Porous hydroxyapatite tablets as carriers for low-dosed drugs. Eur J Pharm Biopharm. 2007;67:498–506. doi: 10.1016/j.ejpb.2007.02.018. [DOI] [PubMed] [Google Scholar]
- 7.Verhoeven E, De Beer TRM, Van den Mooter G, Remon JP, Vervaet C. Influence of formulation and process parameters on the release characteristics of Ethylcellulose sustained-release mini-matrices produced by hot-melt extrusion. Eur J Pharm Biopharm. 2008;69:312–319. doi: 10.1016/j.ejpb.2007.10.007. [DOI] [PubMed] [Google Scholar]
- 8.Nakamura K, Nara E, Akiyama Y. Development of an oral sustained release drug delivery system utilizing pH-dependent swelling of Carboxyvinyl polymer. J Control Release. 2006;111:309–315. doi: 10.1016/j.jconrel.2005.12.018. [DOI] [PubMed] [Google Scholar]
- 9.Aqıl M, Sultana Y, Alı A. Matrix type transdermal drug delivery systems of Metoprolol tartrate: in vitro characterization. Acta Pharm. 2003;53:119–125. [PubMed] [Google Scholar]
- 10.Narendra C, Srinath MS, Prakash Rao B. Development of three layered buccal compact containing Metoprolol tartrate by statistical optimization technique. Int J Pharm. 2005;304:102–114. doi: 10.1016/j.ijpharm.2005.07.021. [DOI] [PubMed] [Google Scholar]
- 11.Ghosh LK, Sairam P, Gupta BK. Development and evaluation of an oral controlled release multiple emulsion drug delivery system of a specific beta blocker Metoprolol tartrate. Boll Chim Farm. 1996;135:468–471. [Google Scholar]
- 12.Ganga S, Ramarao R, Singh J. Effect of Azone on the iontophoretic transdermal delivery of Metoprolol tartrate through human epidermis in vitro. J Control Release. 1996;42:57–64. doi: 10.1016/0168-3659(96)01351-X. [DOI] [Google Scholar]
- 13.Pillay V, Fassihi R. A novel approach for constant rate delivery of highly soluble bioactives from a simple monolithic system. J Control Release. 2000;67:67–78. doi: 10.1016/S0168-3659(00)00193-0. [DOI] [PubMed] [Google Scholar]
- 14.Özyazıcı M, Gökçe EH, Ertan G. Release and diffusional modeling of metronidazole lipid matrices. Eur J Pharm Biopharm. 2006;63:331–339. doi: 10.1016/j.ejpb.2006.02.005. [DOI] [PubMed] [Google Scholar]
- 15.Özgüney I, Ertan G, Güneri T. Dissolution characteristics of megaloporous tablets prepared with two kinds of matrix granules. Il Farmaco. 2004;59(7):549–555. doi: 10.1016/j.farmac.2004.03.011. [DOI] [PubMed] [Google Scholar]
- 16.The United States Pharmacopeia . The National Formulary: USP XXIV, NF XIX. Rockville: The United States Pharmacopeia; 2000. [Google Scholar]
- 17.Martinez-Pacheco R, Vila-Vato JL, Sauto C, Pamos T. Controlled release of Cephalexin from double-layer tablets containing small proportions of Acrylic Resins. Int J Pharm. 1986;32:99–102. doi: 10.1016/0378-5173(86)90167-5. [DOI] [Google Scholar]
- 18.Hardman JG, Limbird LE, Gilman AG. Goodman & Gilman’s The Pharmacological Basis of Therapeutics. 10. New York: McGraw-Hill; 2001. [Google Scholar]
- 19.Jack D. Handbook of Clinical Pharmacokinetic Data. London: Macmillan; 1992. [Google Scholar]
- 20.Ritger PL, Peppas NA. A simple equation for description of solute release II. Fickian and anomalous release from swellable devices. J Control Release. 1987;5:37–42. doi: 10.1016/0168-3659(87)90035-6. [DOI] [PubMed] [Google Scholar]
- 21.Al-Gohary OMN, Al-Kassas RS. Stability studies of Aspirin–magaldrate double layer tablets. Pharm Acta Helv. 2000;74:351–360. doi: 10.1016/S0031-6865(99)00045-X. [DOI] [PubMed] [Google Scholar]
- 22.Mathews BR. Regulatory aspects of stability testing in Europe. Drug Dev Ind Pharm. 1999;25:831–856. doi: 10.1081/DDC-100102245. [DOI] [PubMed] [Google Scholar]
- 23.Avdeef A, Berger CM. pH-metric solubility. Dissolution titration template method for solubility determination. Eur J Pharm Sci. 2001;14:281–291. doi: 10.1016/S0928-0987(01)00190-7. [DOI] [PubMed] [Google Scholar]
- 24.Meshali MM, Gabr KE. Effect of interpolymer complex formation of chitosan with pectin or acacia on the release behaviour of chlorpromazine HCl. Int J Pharm. 1993;89(3):177–181. doi: 10.1016/0378-5173(93)90241-7. [DOI] [Google Scholar]
- 25.Bonferoni MC, Rossi S, Ferrari F, Bertoni M, Bolhuis GK, Caramella C. On the employment of λ carrageenan in a matrix system. III. Optimization of a λ carrageenan-HPMC hydrophilic matrix. J Control Release. 1998;51:231–239. doi: 10.1016/S0168-3659(97)00175-2. [DOI] [PubMed] [Google Scholar]
- 26.Hejazi R, Amiji M. Chitosan- based gastrointestinal delivery systems. J Control Release. 2003;89:151–165. doi: 10.1016/S0168-3659(03)00126-3. [DOI] [PubMed] [Google Scholar]
- 27.Tapia C, Escobar Z, Costa E, Sapag-Hagar J, Valenzuela F, Basualto C, et al. Comparative studies on polyelectrolyte complexes and mixtures of Chitosan-alginate and Chitosan-carrageenan as prolonged Diltiazem Clorhydrate release systems. Eur J Pharm Biopharm. 2004;57:65–75. doi: 10.1016/S0939-6411(03)00153-X. [DOI] [PubMed] [Google Scholar]
- 28.Remunan-Lopez C, Portero A, Vila-Jato JL, Alonso MJ. Design and evaluation of Chitosan/Ethylcellulose mucoadhesive bilayered devices for buccal drug delivery. J Control Release. 1998;55:143–152. doi: 10.1016/S0168-3659(98)00044-3. [DOI] [PubMed] [Google Scholar]
- 29.Miyazaki S, Kawasaki N, Nakamura T, Iwatsu M, Hayashi T, Hou WM, et al. Oral mucosal bioadhesive tablets of pectin and HPMC: in vitro and in vivo evaluation. Int J Pharm. 2000;204:127–132. doi: 10.1016/S0378-5173(00)00491-9. [DOI] [PubMed] [Google Scholar]
- 30.Grabovac V, Föger F, Bernkop-Schnürch A. Design and in vivo evaluation of a patch delivery system for insulin based on thiolated polymers. Int J Pharm. 2008;348:169–174. doi: 10.1016/j.ijpharm.2007.06.052. [DOI] [PubMed] [Google Scholar]
- 31.Colombo P, Bettini R, Santi P, Peppas NA. Swellable matrices for controlled drug delivery: gel-layer behaviour, mechanisms and optimal performance. Pharm Sci Technolo Today. 2000;3(6):198–204. doi: 10.1016/S1461-5347(00)00269-8. [DOI] [PubMed] [Google Scholar]
- 32.Baloğlu E, Özyazıcı M, Hızarcıoğlu SY, Şenyiğit T, Özyurt D, Pekçetin Ç. Bioadhesive controlled release systems of ornidazole for vaginal delivery. Pharm Dev Technol. 2006;11:477–484. doi: 10.1080/10837450600939784. [DOI] [PubMed] [Google Scholar]
- 33.Guo J, Skinner GW, Harcum WW, Barnum PE. Pharmaceutical applications of naturally occurring water-soluble polymers. Pharm Sci Technolo Today. 1998;1:254–261. doi: 10.1016/S1461-5347(98)00072-8. [DOI] [Google Scholar]
- 34.Sriamornsak P, Thirawong N, Weerapol Y, Nunthanid J, Sungthongjeen S. Swelling and erosion of pectin matrix tablets and their impact on drug release behavior. Eur J Pharm Biopharm. 2007;67:211–219. doi: 10.1016/j.ejpb.2006.12.014. [DOI] [PubMed] [Google Scholar]
- 35.Sujja-areevath J, Munday DL, Cox J, Khan KA. Relationship between swelling, erosion and drug release in hydrophilic natural gum mini-matrix formulations. Eur J Pharm Sci. 1998;6:207–217. doi: 10.1016/S0928-0987(97)00072-9. [DOI] [PubMed] [Google Scholar]
- 36.Bonferoni MC, Rossi S, Tamajo M, Pedraz JL. Dominguez Gil A, Caramella C. On the employment of λ carrageenan in a matrix system. I. Sensitivity to dissolution medium and comparison with Na carboxymethylcellulose and xanthan gum. J Control Release. 1993;26:119–127. doi: 10.1016/0168-3659(93)90111-H. [DOI] [Google Scholar]
- 37.Feely LC, Davis SS. The influence of polymeric excipients on drug release from hydroxypropylmethylcellulose matrices. Int J Pharm. 1988;44:131–139. doi: 10.1016/0378-5173(88)90109-3. [DOI] [Google Scholar]
- 38.Rango Rao KV, Padmalatha Devi K, Buri P. Influence of molecular size and water solubility of the solute on its release from swelling and erosion controlled polymeric matrices. J Control Release. 1990;12:133–141. doi: 10.1016/0168-3659(90)90089-C. [DOI] [Google Scholar]
- 39.Fassihi RA, Ritschel WA. Multiple-layer, direct-compression, controlled-release system: in vitro and in vivo evaluation. J Pharm Sci. 1993;82:750–754. doi: 10.1002/jps.2600820715. [DOI] [PubMed] [Google Scholar]
- 40.Streubel A, Siepmann J, Peppas NA, Bodmeier R. Bimodal drug release achieved with multi-layer matrix tablets: transport mechanisms and device design. J Control Release. 2000;69:455–468. doi: 10.1016/S0168-3659(00)00334-5. [DOI] [PubMed] [Google Scholar]
- 41.Lee PI, Peppas NA. Prediction of polymer dissolution in swellable controlled-release systems. J Control Release. 1987;6:207–215. doi: 10.1016/0168-3659(87)90077-0. [DOI] [Google Scholar]
- 42.Kim H, Fassihi R. Application of a binary polymer system in drug release rate modulation. I. Characterisation of release mechanism. J Pharm Sci. 1996;86:316–322. doi: 10.1021/js960302s. [DOI] [PubMed] [Google Scholar]
- 43.Kim H, Fassihi R. A new ternary polymeric matrix system for controlled drug delivery of highly soluble drugs. I. Diltiazem Hydrochloride. Pharm Res. 1997;14:1415–1421. doi: 10.1023/A:1012124806316. [DOI] [PubMed] [Google Scholar]
- 44.Sangalli ME, Maroni A, Zema L, Cerea M, Conte U, Gazzaniga A. A study on the release mechanism of drugs from hydrophilic partially coated perforated matrices. Il Farmaco. 2003;58:971–976. doi: 10.1016/S0014-827X(03)00168-X. [DOI] [PubMed] [Google Scholar]
- 45.Picker KM. The use of carrageenan in mixture with microcrystalline cellulose and its functionality for making tablets. Eur J Pharm Biopharm. 1999;48:27–36. doi: 10.1016/S0939-6411(99)00009-0. [DOI] [PubMed] [Google Scholar]
- 46.Bamba M, Puisieux JP, Marty JP, Carstensen JT. Physical model for release of drug from gel forming sustained release preparations. Int J Pharm. 1979;3:87–92. doi: 10.1016/0378-5173(79)90069-3. [DOI] [Google Scholar]
- 47.Bamba M, Puisieux JP, Marty JP, Carstensen JT. Release mechanisms in gel forming sustained release preparations. Int J Pharm. 1979;2:307–315. doi: 10.1016/0378-5173(79)90037-1. [DOI] [Google Scholar]


