Abstract
The objective of the present study was to develop a once-daily sustained-release (SR) matrix tablet of famotidine. Nine different formulations (F1–F9) were prepared by direct compression method using Avicel PH101 as filler/binder in the range of 41–27% in F1–F3, 18–22% in F4–F7, and 16–18% in F8–F9 and hydroxypropyl methylcellulose (4,000 cps) as hydrophilic matrix was used in F1–F3 from 19% to 30%, around 40% in F4–F7, and 42–45% in F8–F9. Talc and Aerosil were added in the ratio of 0.7–1.2%. The tablets were subjected to various physical parameters including weight variation test, hardness, thickness, diameter, friability, and in vitro release studies. Assay was also performed according to the USP 30 NF 25 procedure. The results of the physical parameters and assay were found to be within the acceptable range. In vitro dissolution results indicated that formulation F4–F7, having around 40% of rate control polymer, produced a SR pattern throughout 24 h. F1–F3 showed drug release at a faster rate, while F8–F9 released much slower, i.e., <80% in 24 h. Model-dependent and model-independent methods were used for data analysis and the best results were observed for F4 in zero order (r2 = 0.984) and F6 in Korsmeyer and Higuchi (r2 = 0.992 and 0.988). The parameter n indicated anomalous diffusion, while β in Weibull showed a parabolic curve with higher initial slope. The f2 similarity test was performed taking F4 as a reference formulation. Only the F5–F7 formulations were similar to the reference formulation F4. The mean dissolution time was around 10 h for the successful formulation.
Key words: famotidine, hydrophilic colloid matrix, hydroxypropyl methylcellulose (HPMC), kinetics, sustained release
INTRODUCTION
Peptic ulceration, gastroesophageal reflux disease, and hypersecretory conditions such as Zollinger–Ellison syndrome require reduction in gastric acid secretion and need constant monitoring. Famotidine is used as a potent inhibitor of gastric acid secretion acting as a competitive inhibitor at the H2 receptor on the parietal cell (1). It has short half life, and the usual oral dosage regimen is 20 mg twice daily for 6 weeks in gastroesophageal reflux disease, 20 mg every 6 h in hypersecretory conditions, and 40 mg for 4–8 weeks in gastric ulcer (2). Therefore, a once-daily sustained-release (SR) formulation of famotidine can reduce the frequency of administration and improve patient compliance. The selection of the release-retarding excipient is necessary to achieve a constant in vivo input rate of the drug. The most commonly used method of modulating the drug release is to include it in a matrix system. The formulation was designed by using hydroxypropyl methylcellulose (HPMC 4,000 cps, USP Type 2208) as hydrophilic matrix. The hydrophilic matrix system is a common and commercially successful means for controlled oral drug delivery because of their flexibility to obtain a desirable drug release profile, cost-effectiveness, and broad U.S. Food and Drug Administration (FDA) acceptance (3). HPMC is an excipient selected by most formulators as a hydrophilic matrix system probably due to the claim that it gives fast gel formation to control initial drug release and that the formation of its strong viscous gel controls further release (4). Its popularity can be attributed to its nontoxic nature, ease of compression, and capability to accommodate a high level of drug loading (5). From the data obtained in the present research, it becomes clear that the hydrophilic HPMC matrix can be used as a SR carrier for the oral delivery of famotidine. In order to avoid unwanted swelling of the HPMC polymer that could result in the presence of granulating fluid, direct compression method was used to prepare tablets (6). The objective of this study was to prepare model SR matrix tablets of famotidine by direct compression method using HPMC as a hydrophilic matrix former to retard release of the drug. After in vitro dissolution testing for 24 h, drug release mechanism and kinetics were evaluated by plotting release data on various kinetic equations (zero order, first order, Higuchi kinetics, Korsmeyer’s equation, Baker and Lonsdale model, Hixson–Crowell cube root law, and Weibull model).
MATERIALS AND METHODS
Materials
The following materials were used: famotidine (Deluxe Chemical Industries, Karachi), HPMC 4,000 cps (USP Type 2208) purchased from Dow Chemicals (Midland, MI), Avicel PH-101(FMC Corporation, USA), Aerosil (FMC Corporation, USA), and Talc (Dow Chemicals, USA).
Methods
Calculation of Sustained Dose
The total dose of drug, Dt, in a prolonged action preparation can be determined with the help of normal (prompt) dose, Dn, and the sustaining dose, Ds, i.e.:
 |
1 |
If the first-order elimination rate constant is k, the rate at which drug is eliminated when a normal dose is given is Dnk, which is the rate at which drug must be replaced if the peak blood level is to be maintained (7). Given a maintenance period t, the maintenance dose (Ds) is Dnkt. The total dose is therefore:
 |
2 |
 |
3 |
 |
4 |
For famotidine, the biological half life is 3 h and Dn is 20 mg. Therefore, for the 24-h sustained drug release (Td), the total dose of the drug (Dt) will be 130.88 mg (quantity used was 130 mg/tablet).
Preparation of Tablets
Nine different famotidine tablet formulations (F1–F9) were prepared by direct compression method having famotidine 130 mg, HPMC ranging from 20% to 45%, Avicel PH 101 (16–42%), Aerosil (0.4–1.2%), and Talc (0.7–1.2%). The quantity recommended for HPMC was 20–50% as matrix former (6,8). All the ingredients were accurately weighed and passed through 40-mesh size sieve. Ingredients were mixed by tumbling action and blends were compressed with manually operated single-punch tablet machine (Korsch Erweka, Frankfurt, Germany) using round-shaped punches with a tablet weight ranging from 325 to 360 mg (Table I).
Table I.
Composition of Famotidine SR Matrix Tablet
| S. no. | Material | Function | F1 | F2 | F3 | F4 | F5 | F6 | F7 | F8 | F9 |
|---|---|---|---|---|---|---|---|---|---|---|---|
| 1 | Famotidine (mg) | Active ingredient | 130 | 130 | 130 | 130 | 130 | 130 | 130 | 130 | 130 |
| 2 | HPMC (mg) | Matrix former | 70 | 80 | 100 | 130 | 130 | 130 | 130 | 150 | 160 |
| 3 | Avicel PH101 (mg) | Binder | 150 | 120 | 90 | 60 | 80 | 70 | 60 | 60 | 60 |
| 4 | Aerosil (mg) | Glidant | 5 | 5 | 5 | 5 | 5 | 5 | 2.5 | 5 | 5 |
| 5 | Talc (mg) | Lubricant | 5 | 5 | 5 | 5 | 5 | 5 | 2.5 | 5 | 5 |
| Total weight of tablet (mg) | 360 | 340 | 330 | 330 | 350 | 340 | 325 | 350 | 360 | ||
Evaluation of Powder Blends
Carr’s Index
The compression characteristics of powder blends were determined by:
 |
5 |
where:
 |
6 |
 |
7 |
Tapped and bulk densities were determined by taking 10 g of powder blend into a measuring cylinder and determining its initial volume (bulk volume) and then the final volume (true volume) after tapping it till volume remained unchanged.
Angle of Repose
The angle of repose of powder blends were determined by the fixed base method. The angle was calculated by measuring the powder heap that it made with the horizontal surface (9):
 |
8 |
where H is the height and D is the diameter of the heap (Table II).
Table II.
Physical Evaluation of Trial Formulations
| Physical evaluation of trial formulations | |||||||||
|---|---|---|---|---|---|---|---|---|---|
| F1 | F2 | F3 | F4 | F5 | F6 | F7 | F8 | F9 | |
| Angle of repose (n = 3) | 28.96 ± 1.78 | 26.97 ± 2.56 | 23.45 ± 1.15 | 27.13 ± 2.12 | 25.89 ± 2.35 | 26.76 ± 2.53 | 23.56 ± 1.22 | 24.54 ± 2.32 | 26.49 ± 3.08 |
| % Carr’s Index (n = 3) | 4.444 ± 1.45 | 7.317 ± 2.22 | 5.128 ± 1.34 | 2.778 ± 2.15 | 4.651 ± 1.33 | 4.762 ± 2.92 | 5.714 ± 1.65 | 2.500 ± 2.52 | 2.326 ± 2.16 |
| Mean weight in mg (n = 20) | 359.52 ± 15.22 | 340.32 ± 16.45 | 329.23 ± 13.22 | 331.54 ± 16.209 | 350.52 ± 16.78 | 342.54 ± 15.76 | 325.22 ± 14.23 | 350.82 ± 13.28 | 360.47 ± 12.65 |
| Thickness in mm (n = 20) | 2.34 ± 0.054 | 2.21 ± 0.098 | 2.08 ± 0.103 | 2.14 ± 0.063 | 2.28 ± 0.012 | 2.22 ± 0.013 | 2.06 ± 0.123 | 2.31 ± 1.44 | 2.37 ± 1.057 |
| Diameter in mm (n = 20) | 12.34 ± 0.021 | 12.12 ± 0.023 | 12.25 ± 0.015 | 12.31 ± 0.018 | 12.41 ± 0.107 | 12.35 ± 1.02 | 12.22 ± 0.015 | 12.37 ± 0.022 | 12.33 ± 0.019 |
| Hardness in kg (n = 20) | 12.54 ± 4.45 | 10.99 ± 3.62 | 10.68 ± 4.52 | 12.32 ± 5 | 12.55 ± 2.52 | 12.35 ± 5.54 | 11.55 ± 3.56 | 12.45 ± 4.25 | 12.49 ± 3.25 |
| Friability in % (n = 10) | 0.12 | 0.4 | 0.25 | 0.12 | 0.15 | 0.12 | 0.11 | 0.1 | 0.12 |
| Content uniformity in % (n = 20) | 89.55 | 92.68 | 95.58 | 90.69 | 87.98 | 88.78 | 91.08 | 88.82 | 87.56 |
Evaluation of Tablets
Tablets were evaluated against various physical parameters including weight variation test (Mettler Toledo B204-S, Switzerland), hardness (Hardness Tester, OSK Fujiwara, Ogawa Seiki Co. Ltd., Tokyo, Japan), thickness, diameter, and friability (Friability Tester, H. Jurgens GmbH & Co., Bremen, Germany) as per the official monograph requirement of the British Pharmacopoeia (8).
Dissolution Studies
Dissolution test was performed using the USP<711> apparatus type II paddle (Erweka DT 700, Husenstamm, Germany) at 50 rpm (10). Apparatus type II, also known as paddle method, consists of a round flask which is also known as a dissolution flask with a hemispherical bottom (capacity of 1,000 ml) and a single-blade paddle with ends contoured to approximate the dimension of the flask. USP also specified a distance of 2.5 cm from the bottom of the flask to the bottom of the paddle (11). The test was performed using 900 ml phosphate buffer having a pH of 4.5 for 24 h, maintained at 37 ± 0.5°C. The drug release profile was evaluated by taking a sample of 10 ml (replaced by fresh medium) at predetermined time intervals, and absorbance was measured by spectrophotometer at 265 nm after filtration and making suitable dilution (Thermospectronic, Heliox Alpha No. VVA 090616, England).
Assay of Famotidine Tablet
Assay of famotidine was performed according to the USP using HPLC (LC-5A, SPD-2A, Shimadzu Corp., Kyoto, Japan). The mobile phase consists of buffer solution and acetonitrile in a ratio of 93:7 (buffer solution was prepared by adding 13.6 g of sodium acetate trihydrate in 750 ml of water; after adding 1 ml of triethylamine, pH was adjusted to 6 with glacial acetic acid and volume make up to 1 L). Chemical and solvents used were of analytical grade. Column used was 4.6 × 15 cm (Lichrospher) and wavelength detection was 275 nm (10).
Data Analysis
Model-Dependent Methods
Data obtained from in vitro release studies were fitted into various kinetic equations. The kinetics models used were zero order (Eq. 9) as cumulative amount of drug release vs. time, first order (Eq. 10) as log cumulative percentage of drug remaining vs. time, Higuchi (Eq. 11) model as cumulative percentage of drug release vs. square root of time, Hixson–Crowell cube root law (Eq. 12) as cube root percent drug remaining vs. time, Korsmeyer and Peppas as log cumulative percent drug release vs. log of time (Eq. 15), Weibull model (Eq. 17) as log dissolved amount of drug vs. log of time, and Baker and Lonsdale model (Eq. 19).
Zero-Order Kinetics
 |
9 |
where K0 is the zero-order rate constant expressed in units of concentration/time, t is the time in hours, and Qt is the amount of drug release in time t; graph of concentration vs. time would yield a straight line with a slope equal to K0 and intercept the origin of the axes (11).
First-Order Kinetics
 |
10 |
where Qo is the initial concentration of drug, k is the first-order rate constant, and t is the time (12).
Higuchi Kinetics
 |
11 |
where k is the release rate constant and t is the time in hours. Hence, the drug release rate is proportional to the reciprocal of the square root of time (13).
Hixson–Crowell Cube Root Law
 |
12 |
where Qt is the amount of drug release at time t, Q0 is the initial amount of the drug in the tablet, and KHC is the rate constant for Hixson–Crowell (14).
The rate constants for these kinetics models were also calculated. For zero order, Higuchi, and Hixson–Crowell model, the rate constant is simply equal to the slope of the straight line:
 |
13 |
For the first-order rate constant, the following equation was used:
 |
14 |
Korsmeyer and Peppas Model
First, the 60% in vitro drug release data was fitted in the equation of Korsmeyer et al. to determine the mechanism of drug release as log cumulative percentage of drug release vs. log time. Korsmeyer et al. used a simple empirical equation to describe general solute release behavior from controlled-release polymer matrix (Eq. 7). This equation is also called power law:
 |
15 |
where Mt and M∞ are the absolute cumulative amount of drug released at time t and infinite time, respectively, K is a constant incorporating structural and geometric characteristic of the device, and exponent n was calculated through the slope of the straight line which characterized the mechanism of release (15). For a cylindrical-shaped matrix, if the exponent n = 0.45 indicates Fickian release (case I), >0.45 but <0.89 indicates non-Fickian (anomalous) release, 0.89 indicates case II (zero order) release, and >0.89 indicates super case II type of release (16). The rate constant for Korsmeyer’s equation (Kkp) can also be calculated by the following equation:
 |
16 |
where n is the exponent, which is equal to the slope of the related drug release profile (the plot of Korsmeyer et al.) and  is the fraction of drug release taken from the zero-order equation at any time t.
Weibull Model
The Weibull equation is commonly used in dissolution studies and can be applied for all types of dissolution curves (17). The accumulated fraction of drug release, m, in solution at time t, is expressed as:
 |
17 |
where α is the time process, Ti is the lag time, in most cases zero, and β, the shape parameter, characterizes the curve as exponential (b = 1), S-shaped with upward curve followed by turning point (b > 1), or parabolic with higher initial slope, after that consistent with the exponential (b < 1).
The rearranged form of Eq. 17 is:
 |
18 |
Drug release following this model will be linear when log dissolved amount of drug plot vs. log of time (18).
Baker and Lonsdale Model
This model was developed by Baker and Lonsdale from the Higuchi model and describes the drug release from a spherical matrix (19):
 |
19 |
where F is the fraction of drug release and k is the release rate constant.
Model-Independent Method
Mean Dissolution Time and f2 Similarity Factor
Ratio test such as mean dissolution time (MDT) and pairwise procedure such as similarity factor provide an easy way to compare dissolution data. US FDA draft guidance proposes that the f2 value of 50–100 indicates equivalence in dissolution profiles:
 |
20 |
where j is the sample number, n is the number of dissolution sample time,  is the time at midpoint between tj and tj − 1, and ∆Mj is the additional amount of drug dissolved between tj and tj − 1 (18):
 |
21 |
where N is the number of samples, Ri and Ti are the percent dissolved of the reference and test products at each time point.
RESULTS AND DISCUSSION
Evaluation of Powder Blend and Tablets
As preformulation tests, angle of repose and Carr’s Compressibility Index were performed for the trial formulations; their results indicated that all powder blends are in “excellent” category according to USP 29 NF 24 and ranging from 23.45 ± 1.15 to 28.96 ± 1.78 and 2.326 ± 2.16% to 7.317 ± 2.22%, respectively, showing excellent flow and compression characteristics. The physical evaluation tests such as weight, thickness, diameter, hardness variation tests, friability, and content uniformity of nine trial formulations were within the recommended limits as mentioned in Table II. The mean weight values of tablets ranged from 329.23 ± 13.22 to 360.47 ± 12.65 mg, whereas the mean diameter and thickness ranged from 12.12 ± 0.023 to 12.41 ± 0.107 and 2.06 ± 0.123 to 2.37 ± 1.057 mm, respectively. All formulations showed good hardness (>5 kg) in the range of 10.68 ± 4.52 to 12.54 ± 4.45 kg, having a percentage friability of <1% (Table II). In general, increase in hardness in tablet will result in less porosity and slow drug release. Hardness determinations are made throughout the tablet runs to determine the need for pressure adjustments on the tablet machine (20). Mean drug content value obtained was found satisfactory and within the limits for all formulations (95–100%).
In Vitro Dissolution Studies
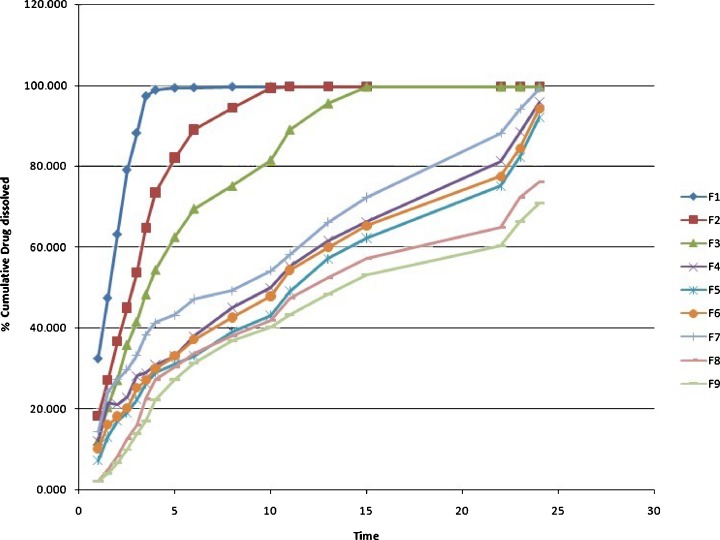
Figure 1 presents the in vitro drug release profile of the nine different formulations of famotidine SR. It was found that nearly the entire drug was released within 5 h in F1 and 10–15 h in F2 and F3. Polymer quantity was 20–30% in these formulations which was insufficient to control the release of drug. Formulation F4 was a target formulation and also taken as a reference for f2 test, showing a control release pattern during 24 h. A similar type of profile was obtained from F5, F6, and F7. Around 30–40% in 4 h, 50–60% in 12 h, and more than 90% of the drug releases up to 24 h, respectively. These formulations contain HPMC in the range of 37–40%. No significant filler/binder and lubricant/glidant effect was observed for F4–F7. The rate of release was further slowed down in F8 and F9 with only 70–80% of the drug released up to 24 h as the quantity of HPMC increased to 42–45%. Using an appropriate viscosity grade of HPMC will help in designing matrices based on diffusion, diffusion and erosion via erosion mechanisms. Practically insoluble drugs may dissolve slowly and have slow diffusion through the gel layer of a hydrophilic matrix. Therefore, the main mechanism of release would be through surface erosion of the hydrated matrix (21). It was observed that HPMC in higher quantity retarded the release of the drug from the matrix. Barakat et al. observed that the amount of HPMC played a dominant role in the release of carbamazepine from matrix tablet formulations and followed non-Fickian diffusion that was shifted to case II as the content of HPMC was increased, indicating significant contribution of erosion (22). Similarly, Tajaorbi et al. also identified a critical point of HPMC contents between 30% and 35% and found it crucial to the release from the HPMC/mannitol tablets. Below this point, the matrix rapidly disintegrated in a nonrobust manner. At higher HPMC contents, the mannitol release became increasingly diffusion controlled with maintained matrix integrity (23).
Fig. 1.
In vitro dissolution profile of famotidine SR formulations F1–F9
Drug Release Kinetics
Model-Dependent Method
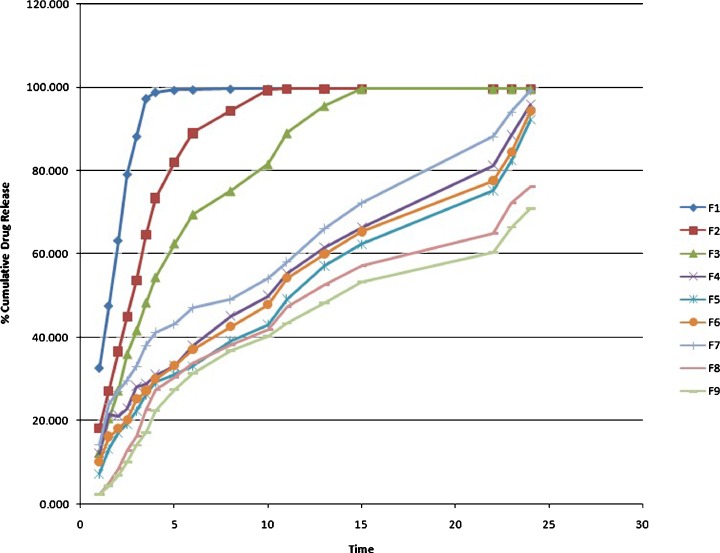
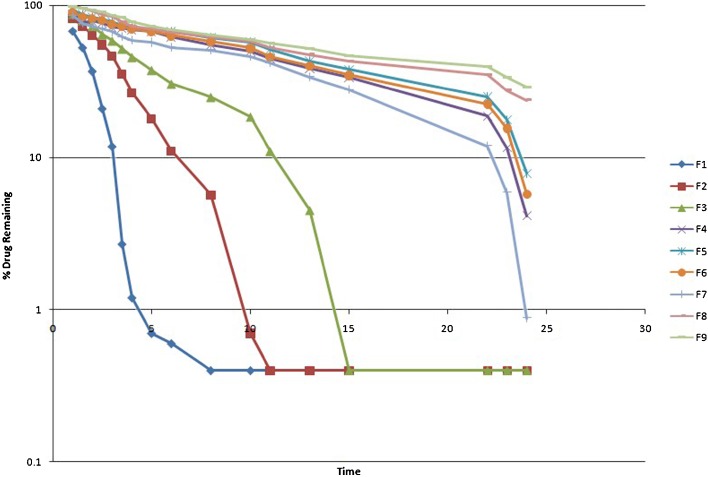
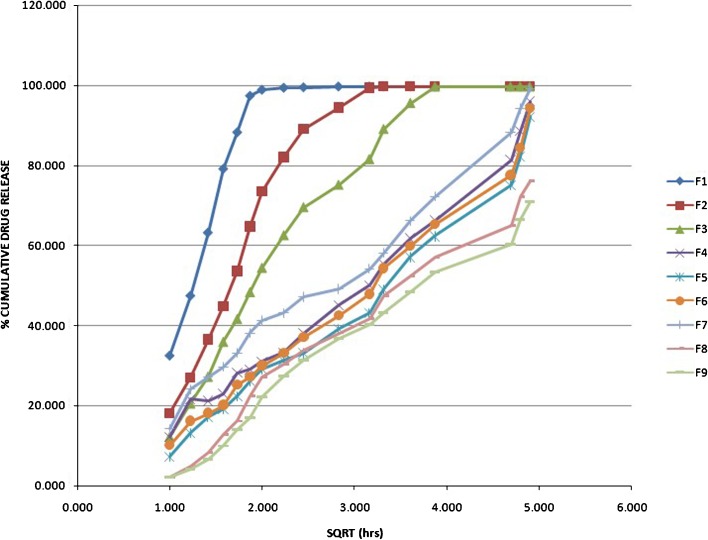
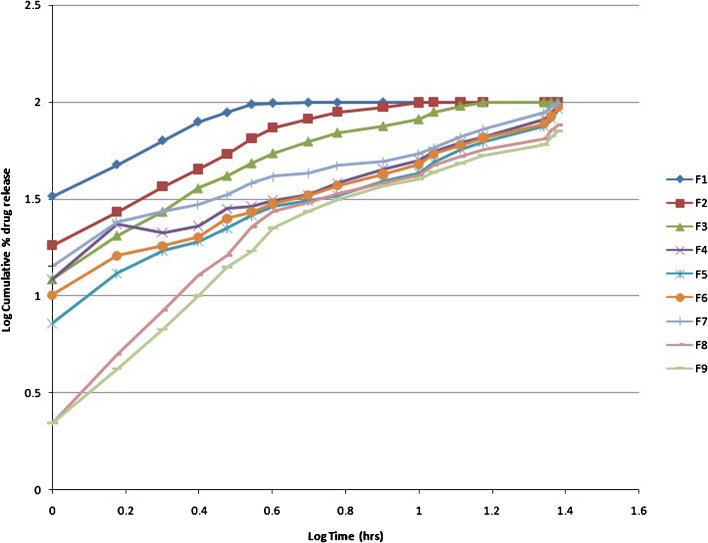
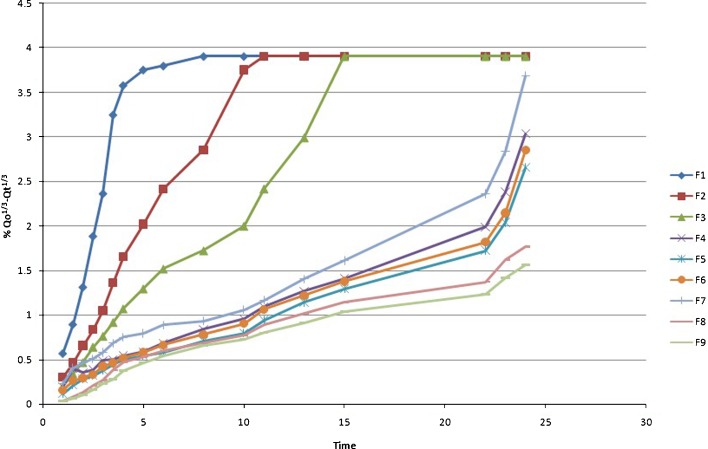
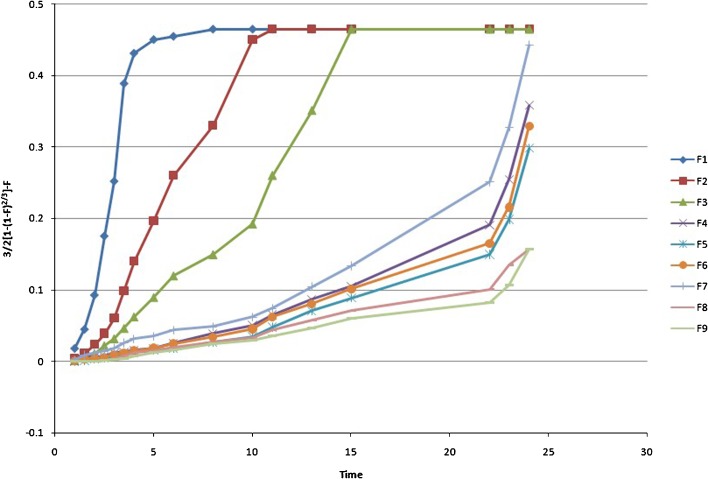
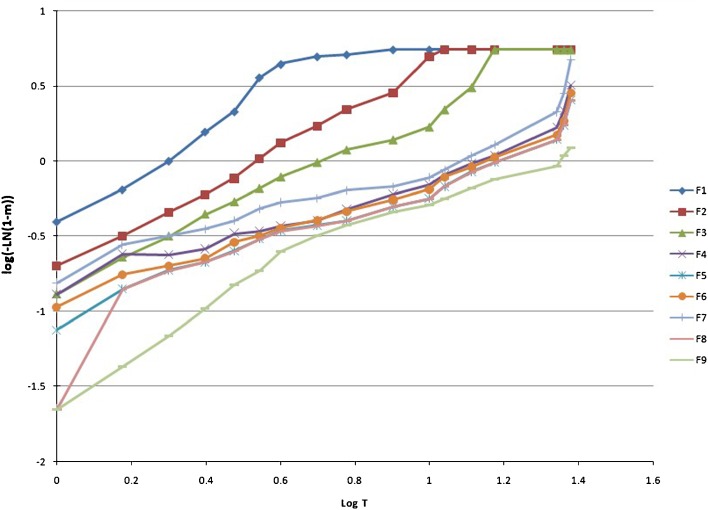
The drug release kinetic of famotidine SR was described by various mathematical model and equations. Table III and Figs. 2, 3, 4, 5, 6, 7, and 8 explain the release kinetics of the nine formulations. The determinant coefficients (r2) failed to fit all the batches. The best value for zero order was observed for formulation F4. The rate of drug release was very high in F1–F3 which showed gradually reduction in F4–F9 due to the increase in the quantity of the rate-controlling polymer. For successful modified release of drugs, either soluble or insoluble, it is essential that polymer hydration and surface gel layer formation is quick and consistent in order to prevent immediate disintegration of tablet and premature release (21,24). Bravo et al., using HPMC matrix tablet of diclofenac sodium, achieved best-fit release kinetic with the highest correlation coefficient (r2) for the zero-order plot followed by Higuchi and first-order equation (25). Reza et al. reported that Carbapol C934 (containing propanolol HCl) most likely followed a Higuchi profile of drug release (r2 = 0.9906), but the drug release from the other two carbopols seemed to be closed to the zero order (for C971r2 = 0.988, C974r2 = 0.9866) (26). In present study, the Higuchi, Korsmeyer, and Hixson–Crowell models are fitted to all types of formulations. The diffusional exponent n is anomalous or non-Fickian for F1–F7, which indicates that the drug release rate is controlled by more than one process, i.e., erosion and diffusion, while it is in the super case transport II type release in F8 and F9. Various researchers applied this equation to determine the drug release mechanism. For example, Talukdar et al. applied the same equation for evaluating the drug release mechanism from xanthan gum release matrix tablets (27). Shato et al. also used this equation for wax matrix granules (28), whereas Hakim et al. applied this equation for the Kollidon SR matrix system (29).
Table III.
Release Kinetics of Famotidine F1–F9 Formulations
| Zero order | First order | Higuchi | Korsmeyer–Peppas | Hixson–Crowell | Baker and Lonsdale | Weibull model | MDT | ||||||||||
|---|---|---|---|---|---|---|---|---|---|---|---|---|---|---|---|---|---|
| r 2 | K 0(h −1) | r 2 | K 1(h −1) | r 2 | k H(h −½) | r 2 | n | K kp(h −n) | r 2 | K HC(h −1/3) | r 2 | K B&L | r 2 | β | α | h | |
| F1 | 0.859 | 17.68 | 0.951 | 0.561 | 0.925 | 59.75 | 0.941 | 0.74 | 0.094 | 0.953 | 0.903 | 0.939 | 0.127 | 0.938 | 1.439 | 1.739 | 1.469 |
| F2 | 0.855 | 9.204 | 0.959 | 0.214 | 0.925 | 36.98 | 0.944 | 0.745 | 0.093 | 0.981 | 0.392 | 0.979 | 0.051 | 0.994 | 1.399 | 4.7 | 3.027 |
| F3 | 0.909 | 5.963 | 0.855 | 0.128 | 0.974 | 30.36 | 0.945 | 0.725 | 0.099 | 0.974 | 0.206 | 0.981 | 0.024 | 0.976 | 1.215 | 7.901 | 5.481 |
| F4 | 0.984 | 3.217 | 0.875 | 0.042 | 0.985 | 19.58 | 0.976 | 0.572 | 0.156 | 0.949 | 0.099 | 0.878 | 0.012 | 0.943 | 0.848 | 7.175 | 10.215 |
| F5 | 0.978 | 3.184 | 0.898 | 0.034 | 0.981 | 19.42 | 0.978 | 0.691 | 0.085 | 0.952 | 0.088 | 0.864 | 0.009 | 0.968 | 0.924 | 9.143 | 10.969 |
| F6 | 0.976 | 3.208 | 0.886 | 0.038 | 0.988 | 19.64 | 0.992 | 0.639 | 0.103 | 0.951 | 0.093 | 0.872 | 0.1 | 0.968 | 0.889 | 8.09 | 10.509 |
| F7 | 0.971 | 3.163 | 0.796 | 0.058 | 0.983 | 19.37 | 0.973 | 0.521 | 0.153 | 0.926 | 0.116 | 0.879 | 0.015 | 0.913 | 0.848 | 6.617 | 9.285 |
| F8 | 0.931 | 2.89 | 0.977 | 0.023 | 0.984 | 18.09 | 0.905 | 0.957 | 0.036 | 0.971 | 0.067 | 0.958 | 0.006 | 0.905 | 1.064 | 11.37 | 9.827 |
| F9 | 0.933 | 2.744 | 0.977 | 0.02 | 0.986 | 17.18 | 0.928 | 0.992 | 0.030 | 0.969 | 0.06 | 0.913 | 0.005 | 0.958 | 1.156 | 14.17 | 9.910 |
Fig. 2.
Zero-order rate plot of famotidine SR formulations (F1–F9)
Fig. 3.
First-order kinetics (semilogarithmic plot of time vs. percent drug remaining ) of F1–F9 famotidine SR formulations
Fig. 4.
Higuchi kinetics (percent cumulative drug release vs. square root of time) of famotidine SR (F1–F9) formulations
Fig. 5.
The model of Korsmeyer et al. (log time vs. log cumulative percent drug release) of famotidine F1–F9 SR formulations
Fig. 6.
Hixson’s cube root plot (time vs. percent cube root remaining where  is taken as the cube root of percent initial drug load and
  as the cube root of percent drug dissolved at time t) of famotidine SR (F1–F9) formulations
Fig. 7.
Baker and Lonsdale model (where F is the fraction drug release) of F1–F9 famotidine SR formulations
Fig. 8.
Weibull model (log T vs. log dissolved amount of drug plot where m is the solution at time t)
The Baker and Lonsdale model may be applied best for F8. The calculated Weibull parameter was <1 for F4–F7, which indicated a parabolic curve with steeper initial slope that was consistent with the exponential. The calculated β was >1 in F8 and F9, showing a complex release mechanism with S-shaped curve with upward curvature followed by a turning point.
Model-Independent Method
Formulation F4 was taken as reference formulation and the dissolution profile was compared with other formulation using the f2 similarity test. The profile of F4 was only observed to be similar with F5, F6, and F7 (Table IV). This technique was used in several other research studies for the comparison of drug release among dosage forms (30–32).
Table IV.
Similarity Factor (f 2) Values of F4 (Reference) with (F1–F3 and F5–F8) Famotidine SR Formulations
| Comparison | f 2 | Dissolution profile |
|---|---|---|
| F4 and F1 | 8.24 | Dissimilar |
| F4 and F2 | 15.42 | Dissimilar |
| F4 and F3 | 23.82 | Dissimilar |
| F4 and F5 | 56.02 | Similar |
| F4 and F6 | 70.4 | Similar |
| F4 and F7 | 51.78 | Similar |
| F4 and F8 | 41.48 | Dissimilar |
| F4 and F9 | 34 | Dissimilar |
The MDT was very low for the F1–F3 formulations, while the MDT was higher for other formulations. Higher MDT indicated slower drug release (Table III).
CONCLUSION
It became evident from the present research that hydrophilic HPMC 4,000 cps was found to be an effective SR polymer for the oral delivery of famotidine in the range of 35–40%. Polymer ratio <30% was not effective in controlling the release of the drug. Hence, the formulation F4–F7 was a superior system for the once-daily controlled-release system and can be prepared by direct compression method having good physical and chemical attributes.
Contributor Information
Muhammad Harris Shoaib, Phone: +92-21-4816410, Email: harrisshoaib2000@yahoo.com.
Saniah Al Sabah Siddiqi, Email: saniahsiddiqi@hotmail.com.
Rabia Ismail Yousuf, Email: rabia_pharmaceutics@yahoo.com.
Kamran Zaheer, Email: kamranzaheer63@hotmail.com.
Muhammad Hanif, Email: muhammadhanif14@yahoo.com.
Saeed Rehana, Email: rehana@uok.edu.pk.
Sabahat Jabeen, Email: sjabeen@uok.edu.pk.
References
- 1.Dollery C. Therapeutic drugs. 2. Edinburgh: Churchill Livingstone; 1999. [Google Scholar]
- 2.Pepsid. Electronic medicines compendium. Aventis Pharma Ltd. http://emc.medicines.org.uk/emc/assets/c/html/display.doc. Accessed 01 Aug 2003.
- 3.Alderman DA. A review of cellulose ethers in hydrophilic matrices for oral controlled-release dosage forms. Int J Pharm Technol Prod Manuf. 1984;5:1–9. [Google Scholar]
- 4.Reza MS, Quadir MA, Haid SS. Comparative evaluation of plastic hydrophobic and hydrophilic polymers as matrices for controlled release drug delivery. J Pharm Pharm Sci. 2003;6(2):274–291. [PubMed] [Google Scholar]
- 5.Gothoskar AV. Study of effect of polymer viscosity and polymer: excipient ratio on drug-release patterns from swellable matrices. Drug Delivery Technology. 2005;5:1–7. [Google Scholar]
- 6.VIVAPHARM, cellulose-based polymer for film-coating and sustained-release application. http://www.jrspharma.de/. Accessed 01 Aug 2005.
- 7.Rawlins EA. Bentley’s textbook of pharmaceutics. 8. UK: Baillieve Tindall; 1986. [Google Scholar]
- 8.British pharmacopoeia. London: Stationary Office London; 2004.
- 9.Gad SC. Pharmaceutical manufacturing handbook. New York: Wiley; 2008. [Google Scholar]
- 10.United States pharmacopoeia 23. Rockville: US Pharmacopeial Convention; 1995.
- 11.Hanson WA. Handbook of dissolution testing: compendial method. USA: Pharmaceutical Technology Publication; 1982. [Google Scholar]
- 12.Hadjiioannou TP, Christian GD, Koupparis MA, Macheras PE. Quantitative calculations in pharmaceutical practice and research. New York: VCH; 1993. [Google Scholar]
- 13.Bourne DW. Pharmacokinetics. In: Banker GS, Rhodes CT, editors. Modern pharmaceutics. 4. New York: Marcel Dekker; 2002. pp. 66–91. [Google Scholar]
- 14.Higuchi T. Mechanism of sustained action medication. Theoretical analysis of rate of release of solid drugs dispersed in solid matrices. J Pharm Sci. 1963;52:1145–1149. doi: 10.1002/jps.2600521210. [DOI] [PubMed] [Google Scholar]
- 15.Hixson AW, Crowell JH. Dependence of reaction velocity upon surface and agitation theoretical consideration. Ind Eng Chem. 1931;23:923–931. doi: 10.1021/ie50260a018. [DOI] [Google Scholar]
- 16.Korsmeyer RW, Gurny R, Doelker E, Buri P, Peppas NA. Mechanisms of solute release from porous hydrophilic polymers. Int J Pharm. 1983;15:25–35. doi: 10.1016/0378-5173(83)90064-9. [DOI] [PubMed] [Google Scholar]
- 17.Langenbucher F. Linearization of dissolution curves by the Weibull distribution. J Pharm Pharmacol. 1972;24:979–981. doi: 10.1111/j.2042-7158.1972.tb08930.x. [DOI] [PubMed] [Google Scholar]
- 18.Costa P, Sousa Lobo MJ. Modeling and comparison of dissolution profile. Eur J Pharm Sci. 2001;13:123–133. doi: 10.1016/S0928-0987(01)00095-1. [DOI] [PubMed] [Google Scholar]
- 19.Baker RW, Lonsdale HS. Controlled release: mechanism and rates. Controlled release of biologically active agents. New York: Plenum; 1974. pp. 15–71. [Google Scholar]
- 20.Ritger LP, Peppas NA. A simple equation for description of solute release 1. Fickian and anomalous release from swellable devices. J Control Release. 1987;5:37–42. doi: 10.1016/0168-3659(87)90035-6. [DOI] [PubMed] [Google Scholar]
- 21.Tiwari SB, Rajabi-Siahboomi AR. Applications of complementary polymers in HPMC hydrophilic extended release matrices. Drug Deliv Tech. 2009;9(7):20–27. [Google Scholar]
- 22.Barakat NS, Elbagory IM, Almurshedi AS. Controlled-release carbamazepine matrix granules and tablets comprising lipophilic and hydrophilic components. Drug Deliv. 2009;16(1):57–65. doi: 10.1080/10717540802518157. [DOI] [PMC free article] [PubMed] [Google Scholar]
- 23.Tajarobi F, Abrahmsén-Alami S, Hansen M, Larsson A. The impact of dose and solubility of additives on the release from HPMC matrix tablets—identifying critical conditions. Pharm Res. 2009;26(6):1496–1503. doi: 10.1007/s11095-009-9861-y. [DOI] [PubMed] [Google Scholar]
- 24.Dow Excipients. Technical presentations. http://www.dow.com/dowexcipients/resources/product/methocel/meth_presentations.htm (2009). Accessed 31 May 2009.
- 25.Saravanan M, Nataraj KS, Ganesh KS. Hydroxypropyl methyl cellulose based cephalexin extended release tablets: influence of tablet formulation, hardness and storage on in vitro release kinetics. Chem Pharm Bull. 2003;51(8):978–983. doi: 10.1248/cpb.51.978. [DOI] [PubMed] [Google Scholar]
- 26.Bravo SA, Lamas MA, Salomon CJ. In-vitro studies of diclofenac sodium controlled-release from biopolymeric hydrophilic matrices. J Pharm Sci. 2002;5(3):213–219. [PubMed] [Google Scholar]
- 27.Talukdar MM, Plaizier-vercammen J. Evaluation of xanthan gum as a hydrophilic matrix for controlled release dosage forms preparations. Drug Dev Ind Pharm. 1993;19:1037–1046. doi: 10.3109/03639049309062999. [DOI] [Google Scholar]
- 28.Shato H, Miyagawa Y, Okabe T, Miyajima M, Sunada H. Dissolution mechanism of diclofenac sodium from wax matrix granules. J Pharm Sci. 1997;86(8):929–934. doi: 10.1021/js960221w. [DOI] [PubMed] [Google Scholar]
- 29.Hakim M. Evaluation of a new rate retarding polymer Kollidon SR as matrix tablets. M.Pharm. thesis, Bangladesh, DU; 2001.
- 30.Patel N, Chotai N, Patel J, Soni T, Desai J, Patel R. Comparison of in-vitro dissolution profiles of oxcarbazepine-HP β-CD tablet formulations with marketed oxcarbazepine tablets. http://www.dissolutiontech.com (2008). Accessed 18 Jan 2009.
- 31.Karmakar AB, Gonjari ID, Hosmani AH, Dhabale PN, Bhise SB. Dissolution rate enhancement of fenofibrate using liquisolid tablet technique. Part II: evaluation of in vitro dissolution profile comparison method. Lat Am J Pharm. 2009;28(2):219–225. [Google Scholar]
- 32.Yuksel N, Kanik AE, Baykara T. Comparison of in vitro dissolution profiles by ANOVA based model dependent and independent methods. Int J Pharm. 2009;209:56–67. doi: 10.1016/s0378-5173(00)00554-8. [DOI] [PubMed] [Google Scholar]


