Abstract
The objective of this study was to develop solid lipid nanoparticles (SLNs) of simvastatin and to optimize it for independent variables (amount of glycerol monostearate, concentration of poloxamer, and volume of isopropyl alcohol) in order to achieve desired particle size with maximum percent entrapment efficiency (% EE) and percent cumulative drug release (% CDR). To achieve our goal, eight formulations (F1–F8) of SLNs were prepared by solvent injection technique and optimized by 23 full-factorial design. The design was validated by extra design checkpoint formulation (F9), and the possible interactions between independent variables were studied. The responses of the design were analyzed using Design Expert 7.1.6. (Stat-Ease, Inc, USA), and the analytical tools of software were used to draw Pareto charts and response surface plots. On the basis of software analysis, formulation F10 with a desirability factor of 0.611 was selected as optimized formulation and was evaluated for the independent parameters. Optimized formulation showed particle size of 258.5 nm, % EE of 75.81%, with of 82.67% CDR after 55 h. The release kinetics of the optimized formulation best fitted the Higuchi model, and the recrystallization index of optimized formulation was found to be 65.51%.
Key words: 23 factorial design, Pareto charts, recrystallization index, simvastatin, solid lipid nanoparticles
INTRODUCTION
Nanoparticles based on solid lipids have been proposed as a promising alternative to colloidal drug delivery system, polymeric nanoparticles, and liposomes. Compared to traditional carriers, the solid lipid nanoparticles (SLNs) combine the advantages of polymeric nanoparticles and o/w fat emulsions for drug administration such as good tolerability, lower cytotoxicity (1,2), higher bioavailability by oral administration (3), and increase in the drug stability (4). Other advantages of lipid excipients, such as biodegradability and cost effectiveness (5), promote their use as novel drug carriers. Consisting of physiological and biodegradable lipids, lipid nanoparticles are suitable for the incorporation of lipophilic, hydrophilic, and poorly water-soluble drugs within the lipid matrix in considerable amounts (6,7).
Simvastatin [butanoic acid, 2,2-dimethyl-,1,2,3,7,8,8a-hexahydro-3, 7-dimethyl-8-[2-(tetrahydro-4-hydroxy-6-oxo-2H-pyran-2-yl)-ethyl]-1-naphthalenyl ester, [1S-[1α,3α,7β,8β(2S*,4S*),-8aββ]]] lowers blood cholesterol levels through reversible and competitive inhibition of 3-hydroxy-3-methylglutaryl coenzyme A reductase, an enzyme involved in the biosynthesis of cholesterol. When simvastatin is given orally, it undergoes extensive hepatic first-pass metabolism by cytochrome P450 3A4, which is responsible for its low oral bioavailability (8). To overcome hepatic first-pass metabolism and to enhance bioavailability, intestinal lymphatic transport of the drug can be exploited, which can be possibly done by using lipids as drug carrier (9). Lipids can enhance lymph formation and simultaneously promote lymph flow rate (10). Transport of drugs through the intestinal lymphatics, via the thoracic lymph duct to the systemic circulation at the junction of the jugular and left subclavian vein, avoids presystemic hepatic metabolism and therefore enhances bioavailability. Simvastatin with a water solubility of 1.4 × 10⁻³ mg/ml is considered to be a reasonable substrate for intestinal lymphatic transport because of its high log P value of 4.7. Attempt for enhancements in oral bioavailability of statins using nanoparticulate drug delivery system are reported in literature (10,11).
Lipidic carriers used to prepare SLNs can be highly purified lipids such as tristearin or tripalmitin, hard fats such as stearic acid or behenic acid, waxes such as cetyl palmitate, and acylglycerol mixtures such as compritol or glyceryl monostearate (GMS) (12). In this study, GMS a non-polar lipid (C21H42O4), has been used to formulate SLNs. The objective behind the selection of GMS was its high drug entrapment efficiency as the presence of high amounts of mono-, di-, and triglycerides in GMS helps the drug to solubilize in the lipid fraction, and the less defined mixture of acylglycerol provides additional space for drug molecules to get entrapped (13).
The objective of the present study was to develop SLNs of simvastatin and to optimize it for independent variables (amount of glycerol monostearate, concentration of poloxamer, and volume of isopropyl alcohol) in order to achieve desired particle size with maximum percent entrapment efficiency (% EE) and percent cumulative drug release (% CDR). Factorial design enables all the factors to be varied simultaneously, allowing quantification of the effects caused by independent variables and interactions between them. Many researchers have optimized nanoparticulate formulations using factorial design (14–16).
MATERIALS AND METHODS
Materials
Simvastatin was a kind gift from Ranbaxy Laboratories, India. Glycerol monostearate (M.P. 52–54°C; molecular weight 358.63) was purchased from CDH, India. Poloxamer 407 (molecular weight 12.5 kDa) was purchased from BASF, USA. Dialysis bag (molecular weight cut off (MWCO) 12–14 kDa; pore size 2.4 nm) was supplied by Hi Media, Mumbai, India. Other chemicals are of analytical grade.
Methods
Experimental Design of SLNs
In this study, a 23 full-factorial experimental design was used to optimize SLNs. In order to optimize, the amount of GMS (X1), concentration of poloxamer 407 (X2) and volume of isopropyl alcohol (IPA) (X3) were selected as independent variables. Each factor was set at a high level and low level. The actual values and coded values of different variables are given in Table I. Eight formulations of SLNs (F1 to F8) were prepared according to the design as shown in Table II. The particle size, % EE, and % CDR were taken as response parameters.
Table I.
23 Full-Factorial Design of Simvastatin-Loaded SLNs and the Response Parameters (n = 3)
| Formulation code | Amount of GMS (X 1) | Concentration of poloxamer 407 (X 2) | Volume of IPA (X 3) | Particle size (nm) | % EE | % CDR |
|---|---|---|---|---|---|---|
| F 1 | −1 | −1 | −1 | 291.6 | 78.92 ± 2.31 | 69.13 ± 2.51 |
| F 2 | −1 | −1 | +1 | 271.6 | 69.67 ± 1.57 | 80.63 ± 2.49 |
| F 3 | −1 | +1 | −1 | 219.8 | 65.82 ± 2.33 | 86.27 ± 4.09 |
| F 4 | −1 | +1 | +1 | 203.4 | 58.61 ± 3.05 | 90.48 ± 3.52 |
| F 5 | +1 | −1 | −1 | 342.4 | 87.06 ± 1.83 | 53.9 ± 3.11 |
| F 6 | +1 | −1 | +1 | 314.5 | 80.95 ± 4.96 | 59.36 ± 3.62 |
| F 7 | +1 | +1 | −1 | 276.2 | 76.66 ± 3.11 | 67.54 ± 5.01 |
| F 8 | +1 | +1 | +1 | 255.5 | 67.96 ± 6.21 | 74.19 ± 3.81 |
(Actual values: X 1, +1 = 200 mg, −1 = 100 mg; X 2, +1 = 2%, −1 = 0.8%; X 3, +1 = 2 ml, −1 = 1 ml)
Table II.
Percent Free Drug Determinations for Optimization of Purification Time of Simvastatin-Loaded SLNs Using Dialysis Technique
| Formulation | % Free drug removed after 15 min | % Free drug removed after 30 min |
|---|---|---|
| F 1 | 5.30 | 5.37 |
| F 2 | 11.90 | 12.03 |
| F 3 | 20.19 | 20.71 |
| F 4 | 24.33 | 24.66 |
| F 5 | 2.45 | 2.65 |
| F 6 | 2.01 | 2.2 |
| F 7 | 7.63 | 7.7 |
| F 8 | 12.29 | 12.68 |
Preparation of SLNs
Solid lipid nanoparticles were prepared by solvent injection technique (17). Simvastatin (15 mg) and specified amount of GMS was dissolved in specified volume of IPA (boiling point 81°C to 83°C) with heating at melting temperature of GMS, i.e., 52°C. (GMS is soluble in IPA; however, it requires some heat for the ease of solubilization). The resulting solution was rapidly injected into the 10 ml of aqueous phase containing specified amount of poloxamer 407 that was continuously stirred at 400 rpm for 30 min on a magnetic stirrer; 0.1 N HCl (4 ml) was added to the dispersion to decrease the pH to around 1.5 to 2 to cause the aggregation of SLNs for the ease of separation. Thereafter, the dispersion was centrifuged to 10,000 rpm for 30 min at 10°C in Remi cooling centrifuge (Model C-24BL, VCAO-779, Vasai, India), and aggregates were purified by dialysis bag and resuspended to 10 ml distilled water containing 4% poloxamer 407 (by weight) as stabilizer with stirring at 1,000 rpm for 10 min.
Purification of Simvastatin-Loaded SLNs
Purification of simvastatin-loaded SLNs was done by dialysis technique. Sedimented soft pellet was taken in the dialysis bag and sealed at both ends. The dialysis bag then immersed into 100 ml of distilled water containing 0.2% w/v sodium lauryl sulphate and stirred at 100 rpm for 30 min. Five milliliter of sample was withdrawn at different time intervals of 5, 10, 15, and 30 min. The samples were diluted appropriately and analyzed for amount of drug by UV/visible spectrophotometer (Pharma spec 1700, Shimadzu, Kyoto, Japan) at 239 nm.
Evaluation and Characterization of Simvastatin SLNs
Particle Size Determination
The particle size of the formulations was determined by laser scattering technique using Malvern Hydro 2000SM (Malvern Instruments, UK) after appropriate dilution with double distilled water. Light scattering was measured at an angle of 90°. The aqueous nanoparticulate dispersion was added to the sample dispersion unit containing stirrer and then stirred to minimize the interparticle interactions, while the laser obscuration range was maintained between 10% and 20%.
Entrapment Efficiency
In order to determine the entrapment efficiency, the equation suggested by Zhang et al. 2006 (18) was modified, and % EE was calculated by the following equation
 |
1 |
where Wa is the amount of drug added in system, Ws is the amount of drug in supernatant after the centrifugation, and Wp is the amount of drug in the purification medium. The amounts were calculated from concentration values obtained from calibration curve on spectrophotometeric analysis of the samples at 239 nm (Shimadzu Pharmaspec 1700, Kyoto, Japan).
In Vitro Drug Release
In vitro drug release study of SLNs was performed by dialysis bag diffusion technique (19). Solid lipid nanosuspension equivalent to 5 mg simvastatin was filled in dialysis bag (MWCO 12–14 kDa, pore size 2.4 nm) and immersed in a receptor compartment containing 150 ml of phosphate buffer pH 7.4 stirred at 100 rpm and maintained at a temperature at 37 ± 0.5°C. The receptor compartment was covered to prevent evaporation of dissolution medium. Five milliliter of samples was withdrawn at various time intervals, diluted appropriately, and the absorbance was measured by UV/visible spectrophotometer at 239 nm. The absorbance was used to calculate concentration using calibration curve. The experiments were performed in triplicate. The calibration curve was obtained in the range of 5–25 μg/ml, absorbance 0.539 to 1.551; [y = 0.0515x + 0.1676; r2 = 0.9996]; Y-intercept = 0.1676 (95% CI 0.1668 to 0.1688) and slope = 0.0515 (95% CI 0.0509 to 0.0520). The calibration curve was repeated two times in a day and for three different days, and the average % relative standard deviation (% RSD) in both cases was found to be less than 2% that demonstrated interday precision between calibration curves. The LOD and LOQ of the calibration curve were determined as 0.0768 and 0.2330 µg/ml, respectively.
Statistical Analysis of Responses by Design Expert
Design Expert 7.1.6. (Stat-Ease, Inc, USA) was used for the analysis of effect of each variable on the designated response. Pareto charts were made for the analysis of each response coefficient for its statistical significance. Quantitative and qualitative contribution of each variable on each of the response was analyzed. The significant response polynomial equations generated by Design Expert were used to validate the statistical design (20). Response surface plots were generated to visualize simultaneous effect of each variable on each response parameter. Possible interactions between X1X2, X2X3, and X1X3 were also studied.
Selection of Optimized Formulation
Optimized formulation (F10) was selected on the basis of small particle size, higher entrapment efficiency, higher in vitro cumulative drug release after 55 h, and with good desirability.
DSC Analysis of Optimized SLNs
In order to evaluate the recrystallization index, differential scanning calorimetry (DSC) analysis was performed. Samples were sealed in aluminum pans. DSC measurements were taken out using Perkin Elmer DSC 7 instrument. The samples were heated from 25°C to 200°C at a heating rate of 10°C/min under nitrogen atmosphere. The recrystallization index (RI) was calculated by following equation.
 |
2 |
where ΔHSLN is enthalpy of fusion of SLN, and ΔHbulk lipid is enthalpy of fusion of GMS
RESULT AND DISCUSSION
Formulation Considerations
SLNs were prepared by solvent injection technique that relies on the rapid diffusion of the solvent across the solvent–lipid interface with the aqueous phase. Thus, the diffusion rate of the organic solvent through the interface seems to be a critical parameter for particle size determination (17). The major problem with the formulation of SLNs is its separation. Owing to their small size and low density of lipids, SLNs present difficulty in settling upon centrifugation. To overcome this problem, in the present study, the pH of the dispersion was reduced to 1.5–2 to adjust the zeta potential for aggregation of SLNs (21) and facilitate centrifugation and consequently separation.
Another factor that was analyzed was the purity of the product obtained. A possibility of presence of simvastatin particles in the sediment of simvastatin-loaded SLNs was explored. It is suggested that these particles can potentially interfere in the in vitro and in vivo behavior of simvastatin-loaded SLNs. Therefore, free drug particles were removed from the sediment of SLNs by purification by dialysis technique. Dialysis technique was considered suitable, as simvastatin with a low molecular weight (418.57) could be efficiently removed using dialysis bag made of Himedia membrane. Consequently, purification was accomplished by monitoring percent free drug removed after 5, 10, 15, and 30 min. Initially, the percent free drug removed increased with time and reached plateau levels by 30 min (Table II). Two-way ANOVA was used to check any significant difference between the percent free drug removed at 15 and at 30 min. It was observed that although the extent of free drug in various SLN formulations was significantly different (p < 0.05), there was no significant difference in percent free drug removed after purification time of 15 and 30 min (p > 0.05). Thus, free simvastatin from sediment of SLNs could be efficiently removed after purification for 15 min and hence was used throughout the experiment. It was also observed that formulation F4 showed highest percentage of free drug removed after 30 min. That means that the concentration of free drug particles was highest in solid lipid nanodispersion of F4 probably because F4 was prepared using higher levels of both poloxamer and IPA. It was concluded that some well-known facts such as (1) aqueous solubility of simvastatin increases with increasing concentration of surfactant and (2) higher solubility of simvastatin in organic solvents than in distilled water might be the reason for higher free drug concentration in F4.
Statistical Analysis of Experimental Data by Design Expert Software
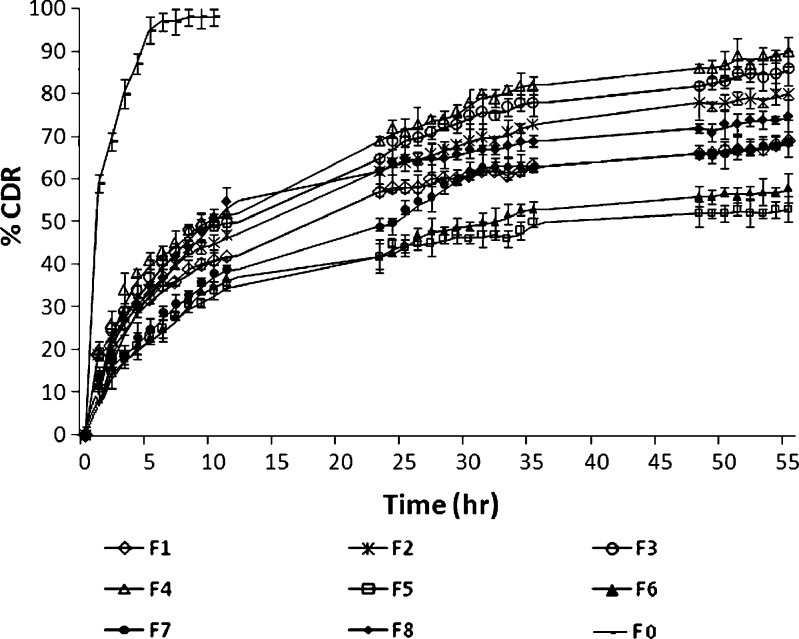
The results of the experimental design were analyzed using Design Expert software that provided considerable useful information and reaffirmed the utility of statistical design for conduct of experiments. The selected independent variables like the amount of GMS, concentration of poloxamer 407, and volume of IPA significantly influenced the particle size, % EE, and % CDR that is very much evident from the results in Table I. The in vitro drug release profiles of F1 to F8 are shown in Fig. 1. As is evident, formulation F4 formulated using low levels of GMS and high levels of both poloxamer and IPA displayed highest % CDR that was quite in contrast to formulation F5 formulated with high levels of GMS and low levels of both poloxamer and IPA exhibited least % CDR.
Fig. 1.
In vitro drug release study of F 0, F 1, F 2, F 3, F 4, F 5, F 6, F 7, and F 8 in phosphate buffer pH 7.4 using dialysis technique
Based on the results obtained for particle size, % EE, and % CDR, the response polynomial coefficients were determined in order to evaluate each response. Each response coefficient was studied for its statistical significance by Pareto charts as shown in Fig. 2. Pareto charts establish t value of effect that is studied by two limit lines namely the Bonferroni limit line (t value of effect = 3.082) and t limit line (t value of effect = 2.1199). Coefficients with t value of effect above the Bonferroni line are designated as certainly significant coefficient, coefficients with t value of effect between Bonferroni line and t limit line are termed as coefficients likely to be significant, while t value of effect below the t limit line is statistically insignificant coefficient and should be removed from the analysis. Thus, non-significant response coefficients were deleted, and the following significant polynomial response equation(s) for particle size, % EE, and % CDR were generated.
 |
3 |
 |
4 |
 |
5 |
Fig. 2.
Response coefficient significance study on a particle size, b EE, and c CDR of SLNs by Pareto chart
These equations were utilized for validation of the experimental design. An extra design checkpoint formulation (F9) was prepared, and the predicted value(s) for particle size, % EE, and % CDR were generated. Experimental values were determined by formulating and evaluating F9, and close resemblance between predicted and experimental values indicated validity of the generated model (Table III).
Table III.
Evaluation of Extra Design Checkpoint Formulation F 9 and Optimized Formulation F 10
| Response parameters | Formulation code | Experimental value | Predicted value | % RSD |
|---|---|---|---|---|
| Particle size (nm) | F 9 | 259.2 ± 3.53 | 271.75 | 3.62 |
| F 10 | 258.5 ± 2.88 | 242.17 | 4.46 | |
| % EE | F 9 | 69.87 ± 2.09 | 72.97 | 3.06 |
| F 10 | 75.81 ± 3.88 | 68.75 | 6.91 | |
| % CDR | F 9 | 76.84 ± 3.71 | 72.24 | 4.48 |
| F 10 | 82.67 ± 3.96 | 80.91 | 1.52 |
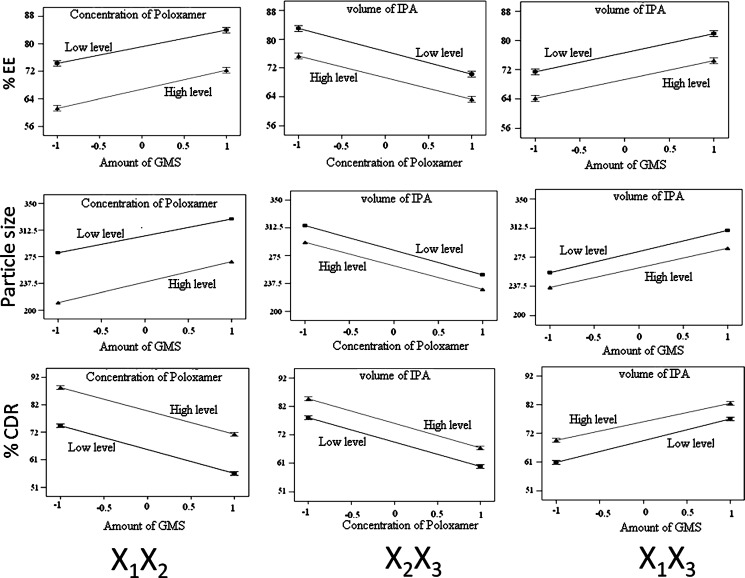
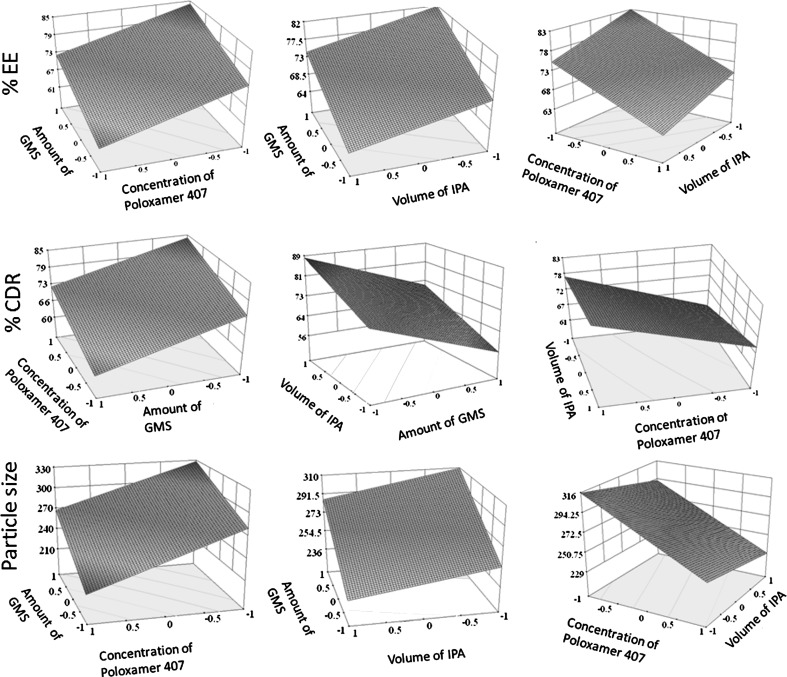
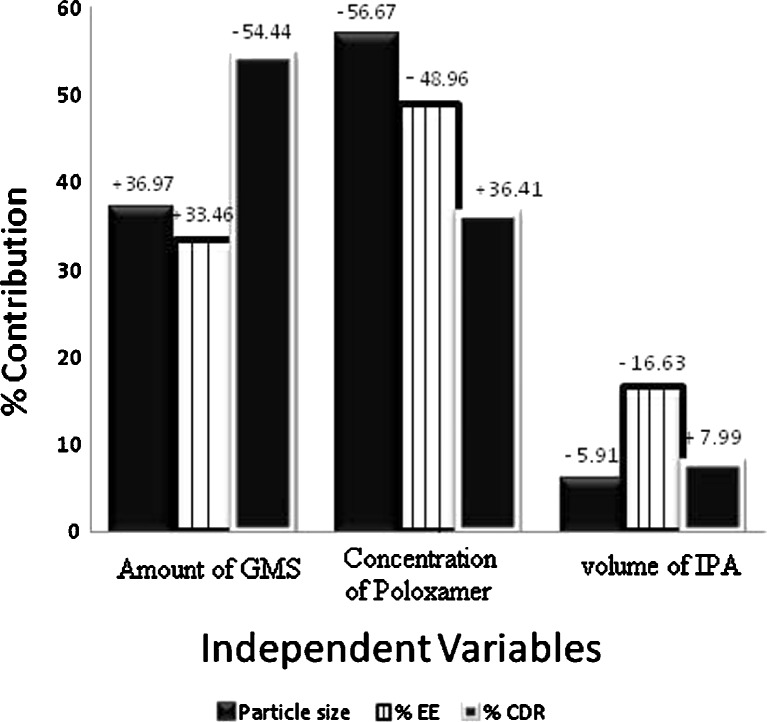
The possible interactions between X1X2, X2X3, and X1X3 for each response were also investigated (Fig. 3). Graphically, the interactions are visualized by lack of parallelism in the lines, but in this case, parallel lines obtained for each interaction term(s) for each response parameter(s) indicated lack of interactions, which in turn indicated that the experimental design has maximum efficiency in estimating main effects (20). The response surface plots (Fig. 4) generated using polynomial equations represent simultaneous effect of any two variables on response parameter taking one variable at constant level. On carefully observing these plots, the qualitative effect of each variable on each response parameter can be visualized. However, Design Expert can analyze both qualitative and quantitative effect of variables on response parameters as shown in Fig. 5. Here, the positive sign indicates the increase in level of one variable cause increase in the respective response parameter, while negative sign indicates the increase in level of one variable cause decrease in response parameter. The following conclusions could be drawn from Fig. 5.
Increased amount of GMS caused an increase in particle size. The fact that the size of lipid nanoparticles is highly dependent on lipid concentration can be explained in terms of tendency of lipid to coalesce at high lipid concentration. According to Stoke’s law, this behavior can be explained by difference in density between internal and external phase (22). Additionally, Schubert et al. (17) have reported that an increase in particle size of SLNs is due to reduction in the diffusion rate of the solute molecules in the outer phase as a result of viscosity increase in the lipid–solvent phase. With increasing the amount of GMS, % EE is bound to increase because of the increased concentration of mono-, di-, and triglycerides that act as solubilizing agents for highly lipophilic drug (5). Moreover, the increase in particle size might be because increased amount of lipid provides additional space for drug molecules to entrap, thus decreasing the total surface area. As a result, the percent cumulative drug release after 55 h was least for the SLN F5 that had the maximum particle size of 342.4 nm.
On increasing the concentration of poloxamer 407, the particle size was decreased. This might be due to the surfactant-induced reduction in surface tension between aqueous phase and organic phase. In addition, surfactant helps to stabilize the newly generated surfaces and prevents particle aggregation (17). The % EE was decreased because of the well-known fact that the aqueous solubility of drug increases with increasing concentration of surfactant in aqueous phase. However, the percent cumulative drug release increased because of the corresponding decrease in particle size, which in turn increased the surface area available for dissolution.
Increasing volume of IPA had an effect similar to that of concentration of poloxamer but to a lesser extent as can be observed in Fig. 5. The decrease in particle size might be due to decreased viscosity of organic phase that in turn increased the diffusion rate. The % EE was decreased because of the fact that the simvastatin has higher solubility in IPA as compared to distilled water, and the increase in % CDR was attributable to the corresponding decrease in particle size, which in turn increased the surface area and hence dissolution.
Fig. 3.
Interaction studies between variables of SLNs
Fig. 4.
Response surface plots showing influence of variables on response parameters of SLNs
Fig. 5.
Percentage contribution and effect of independent variables on various response parameters of SLNs
Thus, qualitative and quantitative influence of independent variables on particle size, % EE, and % CDR were clearly interpreted from Fig. 5 by Design Expert that is an equally advantageous tool for selection of optimized formulation. The tool offers the possibility to vary each variable simultaneously and presents possible optimum selections with their respective desirability value (16). According to our criteria of lower particle size, higher % EE, and higher % CDR after 55 h, F10 was selected as optimized formulation (desirability value of 0.611). Consequently, the coded optimized level for the amount of GMS, the concentration of poloxamer, and the volume of IPA for F10 were identified as −1.0, 0.38, and −1.0, respectively. These coded optimized values can be converted to actual optimized values by using principles of transformation by use of the following equation
 |
6 |
Thus, for each variable, actual optimized values were calculated by the following equations.
 |
7 |
 |
8 |
 |
9 |
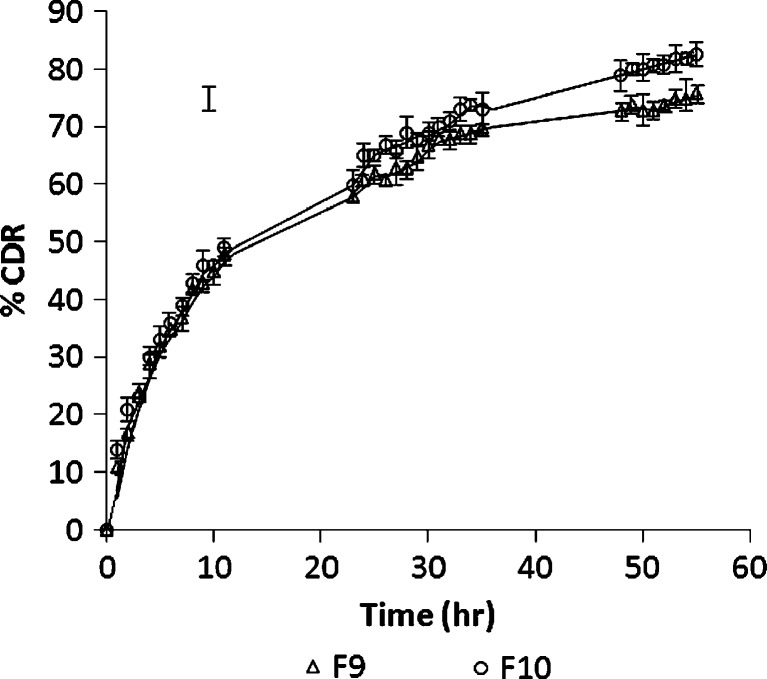
Thus, optimized formulation F10 was prepared using 100 mg of GMS, 1.1% w/v of poloxamer, and 1 ml of IPA and evaluated for responses. The particle size of optimized formulation was found to be 258.5 nm that displayed an entrapment efficiency of 75.81%. In vitro drug release study demonstrated 82.67% of CDR after 55 h (Fig. 6).
Fig. 6.
In vitro drug release study of F 9 to F 10 in phosphate buffer pH 7.4
The optimized formulation was then subjected to DSC, and the recrystallization index was calculated as 65.51%, and other relevant parameters determined from DSC analysis are given in Table IV. The higher recrystallization index of SLNs indicates less chance for SLNs to undergo polymorphism. Moreover, it can be hypothesized that there are less chances of drug expulsion on aging. The release kinetics was evaluated by fitting the data into first order, zero order, Higuchi, Peppas, and Hixon–Crowell equations using PCP Disso software 2.0v Pune, India. Based on the results, the release of simvastatin from SLNs best-fitted Higuchi equation (r2 = 0.9629) and the possible mechanisms for the drug release from F10 might be diffusion of the drug from the matrix and matrix erosion resulting from degradation of lipids. Though high log P value of SMV indicates its lipophilic nature and consequently increased solubility of drug in lipids having low HLB (HLB of GMS is 3.8) but the mono-, di-, and triglycerides present in GMS helps to increase the drug solubility and hence drug release. A similar report has been made by other researchers as well (11,12). Thus, the in vitro release data indicated that the optimized nanometeric SLN of simvastatin was capable of sustaining the release of simvastatin.
Table IV.
Melting Point, Enthalpy Change, and Recrystallization Index of Simvastatin, GMS, Physical Mixture, and Simvastatin-Loaded SLN F 10
| Sample | Melting point (°C) | ΔH (J/G) | % Recrystallization index of lipid in formulations |
|---|---|---|---|
| Simvastatin | 138 | 66.37 | – |
| GMS | 55.26 | 48.009 | 100 |
| Physical mixture simvastatin/GMS (1:10) | 58.96 | 42.94 | 89.44 |
| Formulation F 10 | 51.14 | 31.45 | 65.51 |
CONCLUSION
Solid lipid nanoparticles of simvastatin were successfully developed to yield an optimized formulation with least nanometeric particle size and highest possible entrapment efficiency that could sustain the release of drug for over 55 h. Use of 23 full-factorial design enabled to develop an acceptable formulation using minimum raw materials and in minimum time.
References
- 1.Maaßen S, Schwarz C, Mehnert W, Lucks JS, Yunis-Specht F, Muller BW, et al. Comparison of cytotoxicity between polyester nanoparticles and solid lipid nanoparticles. Proc Int Symp Control Rel Bioact Mater. 1993;20:490–491. [Google Scholar]
- 2.Muller RH, Maaßen S, Weyhers H, Specht F, Lucks JS. Cytotoxicity of magnetite loaded polylactide, polylactide/glycolide particles and solid lipid nanoparticles (SLN) Int J Pharm. 1996;138:85–94. doi: 10.1016/0378-5173(96)04539-5. [DOI] [Google Scholar]
- 3.Yang SC, Zhu JB, Lu Y, Liang BW, Yang CZ. Body distribution of camptothecin solid lipid nanoparticles after oral administration. Pharm Res. 1999;16:751–757. doi: 10.1023/A:1018888927852. [DOI] [PubMed] [Google Scholar]
- 4.Mehnert W, Mader K. Solid lipid nanoparticles. Production, characterization and applications. Adv Drug Del Rev. 2001;47:165–196. doi: 10.1016/S0169-409X(01)00105-3. [DOI] [PubMed] [Google Scholar]
- 5.Mukherjee S, Ray S, Thakur RS. The current status of solid lipid nanoparticles. Pharmabit. 2007;XV(1):53–60. [Google Scholar]
- 6.Almeida AJ, Runge S, Muller RH. Peptide-loaded solid lipid nanoparticles (SLN): influence of production parameters. Int J Pharm. 1997;149:255–265. doi: 10.1016/S0378-5173(97)04885-0. [DOI] [Google Scholar]
- 7.Bunjes H, Drechsler M, Koch MHJ, Westesen K. Incorporation of the model drug ubidecarenone into solid lipid nanoparticles. Pharm Res. 2001;18:287–293. doi: 10.1023/A:1011042627714. [DOI] [PubMed] [Google Scholar]
- 8.Goodman and Gilman’s . The Pharmacological basis of therapeutics. 10. New York: McGraw Hill; 2006. [Google Scholar]
- 9.Nishioka Y, Yoshino H. Lymphatic targeting with nanoparticulate system. Adv Drug Del Rev. 2001;47:55–64. doi: 10.1016/S0169-409X(00)00121-6. [DOI] [PubMed] [Google Scholar]
- 10.Suresh G, Manjunath K, Venkateswarlu V, Satyanarayana V. Preparation, characterization, and in vitro–in vivo evaluation of lovastatin solid lipid nanoparticles. AAPS Pharm Sci Tech. 2007;8:E1–E9. doi: 10.1208/pt0801024. [DOI] [PMC free article] [PubMed] [Google Scholar]
- 11.Lae J, Chen J, Lu Y, Sun J, Hu F, Yin Z, et al. Glyceryl monooleate/poloxamer 407 cubic nanoparticles as oral drug delivery systems: I. In vitro evaluation and enhanced oral bioavailability of the poorly water-soluble drug simvastatin. AAPS Pharm Sci Tech. 2009;10(3):960–966. doi: 10.1208/s12249-009-9292-4. [DOI] [PMC free article] [PubMed] [Google Scholar]
- 12.Souto EB, Muller RH. Application of lipid nanoparticles (SLN and NLC) in food industry. J Food Tech. 2006;4:90–95. [Google Scholar]
- 13.Manjunath K, Reddy JS, Venkateswarlu V. Solid lipid nanoparticles as drug delivery systems. Methods Find Exp Clin Pharmacol. 2005;27:1–20. doi: 10.1358/mf.2005.27.2.876286. [DOI] [PubMed] [Google Scholar]
- 14.Bozkir A, Saka OM. Formulation and investigation of 5-FU nanoparticles with factorial design-based studies. IL Farmaco. 2005;60:840–846. doi: 10.1016/j.farmac.2005.06.016. [DOI] [PubMed] [Google Scholar]
- 15.Bhavsar MD, Tiwari SB, Amiji MM. Formulation optimization for the nanoparticles-in-microsphere hybrid oral delivery system using factorial design. J Control Rel. 2006;110:422–430. doi: 10.1016/j.jconrel.2005.11.001. [DOI] [PubMed] [Google Scholar]
- 16.Derakhshandeh K, Erfan M, Dadashzadeh S. Encapsulation of 9-nitrocamptothecin, a novel anticancer drug, in biodegradable nanoparticles: factorial design, characterization and release kinetics. Eur J Pharm Biopharm. 2007;66:34–41. doi: 10.1016/j.ejpb.2006.09.004. [DOI] [PubMed] [Google Scholar]
- 17.Schubert MA, Muller-Goymann CC. Solvent injection as a new approach for manufacturing lipid nanoparticles—evaluation of the method and process parameters. Eur J Pharm Biopharm. 2003;55:125–131. doi: 10.1016/S0939-6411(02)00130-3. [DOI] [PubMed] [Google Scholar]
- 18.Zhang D, Tan T, Gao L. Preparation of oridonin-loaded solid lipid nanoparticles and studies on them in vitro and in vivo. Nanotech. 2006;17:5821–5828. doi: 10.1088/0957-4484/17/23/018. [DOI] [Google Scholar]
- 19.Reddy LH, Murthy RSR. Etoposide-loaded nanoparticles made from glyceride lipids: formulation, characterization, in vitro drug release, and stability evaluation. AAPS Pharm Sci Tech. 2005;6(2):E158–E166. doi: 10.1208/pt060224. [DOI] [PMC free article] [PubMed] [Google Scholar]
- 20.Bolton S, Bon C. Pharmaceutical statistics: practical and clinical applications. 4. New York: Marcel Dekker; 2004. [Google Scholar]
- 21.Hu FQ, Yuan H, Zhang HH, Fang M. Preparation of solid lipid nanoparticles with clobetasol propionate by a novel solvent diffusion method in aqueous system and physicochemical characterization. Int J Pharm. 2002;239:121–128. doi: 10.1016/S0378-5173(02)00081-9. [DOI] [PubMed] [Google Scholar]
- 22.Leroux JC, Allemann E, Doelker E, Gurny R. New approach for the preparation of nanoparticles by an emulsification–diffusion method. Eur J Pharm Biopharm. 1994;41:14–18. [Google Scholar]


