

Abstract
To investigate the encapsulation of Print 3G, a peptidic agent that could reduce the angiogenic development of breast tumors, pegylated liposomes used as intravenous vectors were studied and characterized. Recently, the path of liposomes has been explored with success to improve the pharmacological properties of peptidic drugs and to stabilize them. In this study, loaded unilamellar vesicles composed of SPC:CHOL:mPEG2000-DSPE (47:47:6) were prepared by the hydration of lipid film technique. An HPLC method was developed and validated for the determination of Print 3G to calculate its encapsulation efficiency. Observed Print 3G adsorption on different materials employed during liposome preparation (such as glass beads, tubing, and connections for extrusion) led to the modification of the manufacturing method. The freeze-thawing technique was used to enhance the amount of Print 3G encapsulated into blank liposomes prepared using the hydration of lipid film procedure. Many factors may influence peptide entrapment, namely the number of freeze-thawing cycles, the lipid concentration, the peptide concentration, and the mixing time. Consequently, a design of experiments was performed to obtain the best encapsulation efficiency while minimizing the number of experiments. The lipid concentration and the number of freeze-thawing cycles were identified as the positive factors influencing the encapsulation. As a result of the optimization, an optimum was found and encapsulation efficiencies were improved from around 30% to 63%. Liposome integrity was evaluated by photon correlation spectroscopy and freeze-fracture electron microscopy to ensure that the selected formulation possesses the required properties to be a potential candidate for further in vitro and in vivo experiments.
KEY WORDS: design of experiments, drug delivery system, freeze-thawing, liposomes, peptide
INTRODUCTION
Solid tumors, whose expansion is directly related to the unregulated growth of cells and changes in the microenvironment, require the development of new blood vessels in order to develop and reach maturity (1,2). Tumor cells need blood supply for growth, invasion and metastasis; their diameter cannot exceed 2–3 mm if vascularization is not sufficient for nutrient supply, waste removal, and exchange of gases. Thus, tissue invasion and the presence of metastasis are directly correlated with microvessel density (3). Angiogenesis, defined by the growth of new blood vessels from an existing vasculature (4), is observed in physiological pathways during embryogenesis, fetal development, and, in the adult, it occurs transiently during the female reproductive cycle and wound healing (3). By contrast, tumor angiogenesis appears when tumor cells, surrounding stromal and inflammatory cells release soluble factors, producing an “angiogenic switch” in favor of tumor vasculature development, triggered by various signals such as metabolic or mechanical stress, immune or inflammatory response or genetic mutations (5).
Use of antiangiogenic therapy presents several advantages such as the broad applicability to different tumor locations, the possibility of developing more selective treatments—with minimal side effects that could be associated with other types of cancer targets—and a partial independence of tumor cell resistance mechanisms. However, this therapy also presents some difficulties related to the heterogeneous characteristics of tumor vasculature (3). Print 3G, a hydrophilic 25-aa peptide (MW = 3,000) is an antagonist of oncoprotein involved in breast cancer and may reduce the angiogenic development of breast tumors, leading to tumor dormancy. Unfortunately, only a few biologically active peptides are successfully used in clinical medicine because administration of peptidic drugs presents several drawbacks, related to their rapid elimination from the blood circulation by the lymphatic system, enzymatic degradation, uptake by the reticulo-endothelial system (RES) and non-selective accumulation (6–10).
The necessity of intravenous administration of Print 3G led to the development of pegylated liposomes as drug carriers. Recently, several studies explored with success the path of liposomes for the administration of different peptides (7,11,12). Liposomes, spherical structures composed of one or several phospholipid bilayers, possess many attractive characteristics to stabilize peptidic drugs and to improve their pharmacological properties. Being biocompatible and biodegradable, they cause no or very mild antigenic, pyrogenic, allergic, and toxic reactions. They can entrap hydrophilic drugs within their aqueous compartment, lipophilic compounds in their membrane or amphipathic drugs. First generation liposomes have been shown to be easily eliminated from the bloodstream and accumulated in the Kupfer cells in the liver and in spleen macrophages (13). Therefore, the strategy has been to graft polymers onto nanoparticles and particularly onto liposomal phospholipids with polyethylene glycol (PEG). Cholesterol was added to the formulation because of its stabilizing properties (14). The increase in circulation lifetime by PEG2000 was demonstrated by Dos Santos et al., who showed an enhancing of vascular remanence for the surface-grafted PEG liposomes, preventing aggregation and building a steric barrier around the liposome, in comparison with non-grafted vectors (14). PEGs are synthetic, inert, and biocompatible polymers, allowing the formation of a protective layer on the particle surface, providing protection against opsonization and capture by the RES (15). These two properties, namely the increase in circulation time and the decrease in capture by the RES, explain the enhanced permeability and retention effect, applicable to almost all rapidly growing solid tumors (16). The enhanced extravasations of macromolecules from blood vessels to tumor and their retention within these tissues, due to the anatomical and permeability particularities of tumors, represent a phenomenon not observed in normal tissue, leading to a passive targeting towards affected tissues. In fact, tumor endothelium possesses anatomical and physiological abnormalities in comparison with normal endothelium, such as disorganized anatomy and blood flow, high vascular permeability (large fenestrations amounting to 400–600 nm in diameter), and a lack of smooth muscle layer and efficient lymphatic system (5,17). Therefore, pegylated liposomes, too large to be collected by fenestrated organs such as the liver, will passively accumulate in solid tumor.
The purpose of this study was to investigate the encapsulation of Print 3G into pegylated liposomes made of SPC:CHOL:mPEG-2000-DSPE (47:47:6, molar% ratio) and to characterize these vesicles. Small unilamellar vesicles (SUV) were produced and their integrity was evaluated by photon correlation spectroscopy and freeze-fracture electron microscopy. An HPLC method was developed and validated for the determination of Print 3G so as to calculate its encapsulation efficiency. Because many factors may influence drug encapsulation into a liposome, a design of experiments was built to obtain the best encapsulation efficiency while minimizing the number of experiments. Performing only those experiments at critical points of the model consumes a lesser quantity of the active principle, which, in the case of peptidic drugs, is very expensive. With this in mind, this study proposes a practical approach based on the theory of experimental design, expected to facilitate and accelerate the development of novel liposomal formulations. Our aim was to identify the critical parameters for attaining the optimal encapsulation of a peptidic drug into a suitable vector in order to obtain a potential candidate for further in vitro and in vivo studies.
MATERIALS AND METHODS
Materials
Soybean phosphatidylcholine (SPC; purity, 98%) and N-(carbonyl-methoxypolyethylenglycol-2000)-1,2-distearoyl-sn-glycero-3-phosphoethanolamine, sodium salt (mPEG-2000-DSPE, purity 100%) were provided by Lipoid (Ludwigshafen, Germany). Cholesterol (CHOL, purity >99%) and trifluoroacetic acid (TFA, purity >99%) were purchased from Sigma-Aldrich (Bornem, Belgium). Print 3G (purity, 98.44%) was acquired from GL Biochem (Shanghai, China). HPLC grade acetonitrile (LiChrosolv®) was supplied by Merck (Darmstadt, Germany). Water was deionized using the Millipore system (18.2 MΩ/cm resistivity) and was filtered through a 0.22 µm Millipore Millipak®-40 disposable filter unit (Millipore Corporation, USA). All other reagents and solvents were of analytical grade.
Liposome Preparation
Unilamellar vesicles made of SPC:CHOL:mPEG-2000-DSPE (47:47:6, molar% ratio) were prepared by the hydration of lipid film method. Briefly, required amounts of SPC, CHOL, and mPEG-2000-DSPE were dissolved in 3 ml chloroform and were evaporated under reduced pressure in a round-bottomed flask in order to form a thin lipid film. The film was hydrated using a vortex mixer with 3 ml of 50 μM Print 3G solution in 0.22-μm-filtered 10 mM HEPES buffer, containing 67 mM NaCl and was adjusted to pH 7.4 with 0.1 N NaOH solution. The obtained suspension was extruded five times through a 0.2 μm Nucleopore polycarbonate membrane (Whatman International Ltd, Maidstone, UK).
A second preparation method using freeze-thawing cycles was also used. In practice, blank liposomes were prepared by the hydration of lipid film method described previously. The hydration of the thin film was performed with 1.5 ml of 10 mM HEPES buffer. Thereafter, the blank liposome suspension was mixed with 1.5 ml of 100, 200, or 300 μM Print 3G solution in HEPES buffer, frozen for 1 min at −196°C in liquid nitrogen and thawed for 5 min at 30°C in a water bath. One, three, six, or 11 cycles were performed to promote the entry of Print 3G into the vesicles. Between each cycle, the suspension was mixed for 10, 60, or 110 s using a vortex mixer.
Liposomes prepared by the hydration of lipid film method or by the freeze-thawing method underwent two ultracentrifugations at 35,000 rpm for 3 h 30 at 4°C using the Beckman SW60 rotor (86,496×g) to remove free Print 3G.
Determination of Encapsulation Efficiency
Print 3G Determination
An HPLC method with UV/visible diode array detector (DAD) was developed and validated for the determination of Print 3G. The HPLC equipment consisted of a Hewlett-Packard 1100 series (Agilent Technologies, USA). Ten-microliter samples were injected on a Zorbax 300 SB-C18 (3.5 μm, 150 × 4.6 mm I.D. from Agilent) in an oven set at 35°C with a mobile phase containing water and acetonitrile (ACN). Both solvents were acidified with 0.1% of TFA. The applied gradient was as follows: 18–22.8% ACN from 0 to 20 min, 100% ACN at 25 min, and 18% at 25.2 min. Finally, the column was equilibrated by an isocratic mobile phase water-ACN (82:18, v/v) for 9.8 min before the next injection. The flow rate was set at 1.0 ml/min. Detection was achieved with the DAD detector at an absorbance wavelength of 220 nm. Calibration and validation standards of Print 3G were prepared in HEPES buffer at three concentration levels: 12.5, 25.0, and 125.0 μg/ml and were stored in the dark at 4°C. Each series was prepared in duplicate for the calibration standards and in triplicate for the validation standards. The e.noval® software V2.0 (Arlenda, Liège, Belgium) was used to compute the accuracy profile and validation results.
Encapsulation Efficiencies
Encapsulation efficiency (EE) may be expressed in two ways:
-
EE in terms of the quantity of peptide loaded into liposomes as a function of the quantity operated (EEp).
This EE was calculated by the following equation (Eq. 1).
where the “amount of free Print 3G” is the amount of Print 3G (in μg) present in the supernatants harvested after the successive ultracentrifugations and the “total amount of Print 3G” is the amount of Print 3G (in μg) implemented.
1 -
EE in terms of the quantity of peptide loaded into liposomes as a function of the quantity of lipids (EEl).
This EE was calculated by the following equation (Eq. 2).
where the “total amount of Print 3G” is the amount of Print 3G (in μg) implemented, the “amount of free Print 3G” is the amount of Print 3G (in μg) present in the supernatants harvested after the successive ultracentrifugations and the “total amount of lipids” is the amount of lipids (in μg) present in the liposome suspensions, determined by an enzymatic method (LabAssay Phospholipid, choline oxidase—DAOS method, Wako Chemicals, Neuss, Germany). Phospholipids are hydrolyzed to choline in a reaction catalyzed by phospholipase D. The oxidation of choline in betaine by choline oxidase leads to a quantitative production of hydrogen peroxide, which causes DAOS and 4-aminoantipyrine to undergo an oxidative condensation catalyzed by peroxidase, producing a blue pigment. The amount of phospholipids contained in the sample is determined by measuring the absorbance at 600 nm of the blue color (spectrophotometer Perkin-Elmer Lambda 11).
2
Design of Experiments
Data were fitted by means of multiple linear regressions (MLRs) and were analyzed using the statistical software package Modde 6.0 (Umetrics AB, Sweden). All experiments were carried out in a randomized order to minimize the effect of unexplainable variability in the observed response due to irrelevant factors.
Screening Study
The screening study was performed using a Plackett–Burman design in order to find the relevant main parameters of the peptide encapsulation efficiency (18). Four experimental factors were investigated through a design matrix of 11 experiments (N = 8, N0 = 3) using a simple linear model (Eq. 3):
 |
3 |
where Y is the dependent variable, βi represents the parameter estimates, Xi is the level of the independent variables, and β0 is the model constant. The experimental response was expressed in terms of encapsulation efficiency (%EEp) and the parameters were as follows: (1) peptide concentration (PC), (2) lipid concentration (LC), (3) number of freeze-thawing cycles (NC), and (4) mixing time (MT). The extreme levels of each factor were set based on preliminary experiments and the literature. Prior to any investigations, the normality of data and residues were checked by using the Shapiro–Wilk normality test (N = 11, α = 5%) and N-probability plot, respectively. Finally, the significance of each variable was tested using both the coefficients plot and confidence intervals (α = 5%). Symbols and coded and actual levels of variables of the screening study are shown in Table I.
Table I.
Experimental Conditions for the Screening and Optimization Studies
| Symbol | Factors | Experimental values (screening) | Experimental values (optimization) | ||
|---|---|---|---|---|---|
| Low level (−1.0) | High level (+1.0) | Low level (−1.0) | High level (+1.0) | ||
| X 1 (PC) | Peptide concentration (μM) | 50 | 150 | 100 | |
| X 2 (LC) | Lipid concentration (mM) | (20:20:2.5) | (40:40:5) | (20:20:2.5) | (40:40:5) |
| (SPC:Chol:mPEG-PE) | |||||
| X 3 (NC) | Number of freeze-thawing cycles | 1 | 11 | 1 | 11 |
| X 4 (MT) | Mixing time (s) | 10 | 110 | 10 | |
Optimization Study
The optimization study was performed using a central composite face-centered design (α = 1) in order to find the optimal conditions of the peptide encapsulation. The main relevant parameters, found in the screening study (lipid concentration and number of freeze-thawing cycles), were investigated through a design matrix of 12 experiments (N = 8, N0 = 4) using a quadratic model (Eq. 4):
 |
4 |
where Y is the dependent variable, βi, βij, βii are the parameter estimates, Xi,j are the levels of the independent variables and β0 is the model constant. Before any investigations were carried out, diagnostic plots were examined to find eventual outliers, required transformations, and to ensure MLR was meaningful. The N-probability plot, residuals plot and Shapiro–Wilk test (N = 12, α = 5%) were used for this purpose. Model adequacy was confirmed by ANOVA analysis. Finally, the retained quadratic model was expressed, graphically, in terms of response surface model. The Nedler–Mead simplex method was used to find the optimal conditions for the peptide encapsulation. The theoretical maximum response was predicted (α = 5%) and compared to the corresponding experimental value. Symbols and coded and actual level of the variables of the optimization study are shown in Table I.
Evaluation of Liposome Integrity
Liposome integrity was evaluated by photon correlation spectroscopy (PCS) and freeze-fracture electron microscopy to ensure that the selected formulation possesses the required properties of shape and size for further intravenous administration of the encapsulated peptide.
Photon Correlation Spectroscopy
Liposome dispersions were measured by PCS (HPPS, Malvern Instruments). Measurements were made at 25°C with a fixed angle of 90°. Quoted sizes, measured after ultracentrifugation, represented the average mean for the liposomal hydrodynamic diameter (nm). The polydispersity index expressed the size distribution width. Measurements were made before and after freeze-thawing cycles to ensure that liposome size remained acceptable after freeze-thawing cycles.
Freeze-Fracture Electron Microscopy
Freeze-fracture replicas of liposome suspensions were analyzed under transmission electron microscopy. In practice, a drop of liposome suspension, containing 20% (v/v) glycerol as a cryoprotectant, was deposited into a small gold cup and rapidly frozen in liquid nitrogen. Fracturing, freeze etching, and shadowing with Pt-C were performed at −100°C in shadowing equipment (Balzers® BAF-400) fitted with a freeze-fracture and etching unit. The replicas were examined with a JEOL (JEM-100SX) transmission electron microscope, operating at 80 kV accelerating voltage.
RESULTS AND DISCUSSION
Peptide Determination Method
The analytical method was developed to ensure the separation between Print 3G and its manufacture and degradation impurities, which interfere at the time of retention, and to obtain a suitable peptide peak shape.
The aim of the validation was to determine the suitability of the method for its intended use and consequently to prove the reliability of the obtained results within well-defined limits. The acceptance limits were set at ±5% and the α-risk at 5%. Several widely recognized validation criteria were evaluated, including trueness (systematic error), precision (random error), accuracy, and limits of detection and quantification. The present method was validated using the accuracy profile approach. From the results obtained, the mean relative bias and the upper and lower β-expectation tolerance limits at 95% were determined (Table II). The best and simplest response function was achieved with the linear regression, and the upper and lower β-expectation tolerance limits (%) did not exceed the fixed acceptance limits (±5%) for each concentration level. Using the accuracy approach, this validation provides the guarantee that each further measurement of the unknown samples is included within the tolerance limits. The method was found to be accurate over a concentration range from 12.45 to 124.5 μg/ml and the limit of detection was evaluated at 2.192 μg/ml.
Table II.
Method Validation for Print 3G Determination
| Level | Response function | Mean introduced concentration (μg/ml) | Relative bias (%) | Relative β-expectation tolerance limits (%) |
|---|---|---|---|---|
| 1.0 | 124.5 | 0.2426 | [−4.212, 4.697] | |
| 2.0 | Linear regression | 49.82 | −0.2094 | [−2.808, 2.390] |
| 3.0 | 12.45 | −1.462 | [−4.522, 1.597] |
Preparation of Liposomes
Preparation of Liposomes by the Hydration of Lipid Film Method
Peptide-loaded liposomes were initially prepared by the hydration of lipid film method. However, when the potential Print 3G adsorption onto materials employed to prepare loaded liposomes was evaluated, a significant loss of Print 3G was observed. The loss of peptide after each step of the manufacturing process was evaluated: mixing without glass beads; mixing with glass beads; mixing in a polypropylene tube; extrusion without PC membrane; and extrusion after passage on PC membrane. Concentration of the five harvested solutions was determined by HPLC and the loss of Print 3G was expressed in terms of mean percentage and standard deviation of three replicates (Table III). When a 16.6 µM Print 3G solution was mixed with glass beads during the lipid film hydration, a concentration decrease of 28.83 ± 19.55% was observed. After one extrusion on a 0.2 µm PC membrane, average loss amounted to 66.06 ± 16.64%. As shown in Table III, a significant loss of Print 3G was observed during the manufacturing process, associated with an important standard deviation. Because of its consequent adsorption, no significant amount of peptide could be encapsulated.
Table III.
Peptide Average Loss of Print 3G Solution (40 µg/ml) by Adsorption During the Manufacturing of Liposomes by Hydration of Lipid Film (n = 3)
| Average loss (%) | SD | |
|---|---|---|
| Mixing with glass beads | 28.83 | 19.55 |
| Mixing without glass beads | 2.83 | 0.74 |
| Mixing in a propylene tube | 0 | 0 |
| Extrusion without a PC membrane | 53.43 | 15.96 |
| Extrusion with a PC membrane | 66.06 | 16.64 |
SD standard deviation
A few studies (19–22) have already described the adsorption of peptides onto solid surfaces, in particular, using pipette tips, reaction vials, tubing, and connections for extrusion. This adsorption is believed to be due to noncovalent interactions and to depend upon experimental conditions (peptide properties, physical state of the surface, and sample environment properties).
Consequently, the freeze-thawing technique was investigated to promote the entry of peptide into blank liposomes, avoiding the contact of Print 3G with the manufacturing materials used.
Preparation of Liposomes by the Freeze-Thawing Method
The first results obtained by the second manufacturing method were produced with parameters chosen on the basis of the literature (23,24): three freeze-thawing cycles, a lipid concentration of 50 mM, and 10 s of mixing time. The Print 3G concentration was 50 µM. Encapsulation efficiencies amounted to 26.20 ± 7.98%, n = 3 (EEp) and to 0.26 ± 0.07%, n = 3 (EEl).
In order to evaluate the potential loss of Print 3G with this second method, a 50 µM Print 3G solution was quantified after 11 freeze-thawing cycles (100.91 ± 1.28%, n = 3) and after ultracentrifugation cycles (100.69 ± 1.77%, n = 3), demonstrating that no significant loss was observed.
Because many factors may influence the entrapment of peptide into the vesicles: the number of freeze-thawing cycles, lipid concentration, peptide concentration, and mixing time, a design of experiments was performed (for the screening, a Plackett and Burman plan and for the optimization, a central composite design).
Design of Experiments
Screening Study
Encapsulation efficiency was studied as a function of four parameters: peptide concentration, lipid concentration, number of freeze-thawing cycles, and mixing time. Symbols and coded and actual level of variables plus the experimental design of the screening study are shown in Tables I and IV.
Table IV.
Plackett–Burman Design Matrix with Corresponding Experimental Results
| Run order | X 1 | X 2 | X 3 | X 4 | %EEp |
|---|---|---|---|---|---|
| 11 | −1 | −1 | −1 | 1 | 6.98 |
| 8 | −1 | 1 | −1 | −1 | 51.45 |
| 9 | 1 | −1 | 1 | −1 | 34.67 |
| 4 | 1 | 1 | 1 | 1 | 55.96 |
| 10 | −1 | −1 | −1 | −1 | 20.03 |
| 3 | 1 | 1 | −1 | 1 | 39.95 |
| 6 | −1 | −1 | 1 | 1 | 36.15 |
| 7 | 1 | 1 | 1 | −1 | 56.67 |
| 5 | 0 | 0 | 0 | 0 | 37.42 |
| 2 | 0 | 0 | 0 | 0 | 41.36 |
| 1 | 0 | 0 | 0 | 0 | 42.35 |
The experimental results of the Plackett–Burman design are indexed in Table IV. The Shapiro–Wilk test clearly showed that the normality of the collected data was ensured and, as a result of this, no normalization transformation was required (Gcalc = 0.930 is larger than Gtable = 0.850). After fitting the simple linear model, statistical analysis demonstrated the normality of the residues, as can be seen in Fig. 1a. Indeed, in the N-probability plot, deleted studentized residuals are plotted on a cumulative normal probability scale. The deleted studentized residual is the raw residual, ei, divided by its “deleted standard deviation”, which is the residual standard deviation computed with observation i left out of the analysis. The points on this plot form a nearly linear pattern, which indicates that the normal distribution was a good model for the residues of the linear model.
Fig. 1.


Residual analysis. N-probability plot of residues a for the screening study; b for the optimization. c The residuals plot (versus predicted response) for the second-order polynomial model used during the optimization. The reference line at 0 emphasizes that the residuals are split about 50–50 between positive and negative
Normality conditions fulfilled, the significant parameters of the peptide encapsulation were determined using the coefficients plot (Fig. 2), which illustrates the influence of all factors on response with clearly stated 95% confidence intervals. All factors in the studied model were characterized by a p value. The smaller the p value, the greater the influence of the parameter concerned on the model. From the information given by the coefficients plot, we can infer that the lipid concentration and number of the freeze-thawing cycles had a positively significant effect on the peptide encapsulation. By contrast, the peptide concentration and the mixing time were considered as not significant and were disregarded for the optimization step. Using the calculated parameter estimators, the simple linear model can be written as follows (Eq. 5):
 |
5 |
Fig. 2.

Coefficients plot for the simple linear model (screening). PC peptide concentration, LC lipid concentration, NC number of freeze-thawing cycles, MT mixing time
Optimization Study
During the optimization, the two relevant parameters, found in the previous screening study (the lipid concentration and the number of freeze-thawing cycles), were optimized using a central composite face-centered design. Other factors were kept constant throughout this study. This particular type of design was chosen because the optimal conditions were expected to be found close to the extreme level, for at least one of the studied parameters. All the results are indexed in Table V. Before further investigation, data normality was tested using the Shapiro–Wilk test, which indicated that a normalization transformation was required (Gcalc = 0.921 is larger than Gtable = 0.859). After fitting the second-order polynomial model, the analysis of residues was performed. The N-probability plot demonstrated the normality of the residues (Fig. 1b) and that the residuals plot (Fig. 1c) did not exhibit any particular structure, emphasizing the adequacy of the used model.
Table V.
Central Composite Face-Centered Design Matrix with Experimental Results
| Run order | X 1 | X 2 | %EEp |
|---|---|---|---|
| 3 | −1 | −1 | 18.51 |
| 8 | 0 | −1 | 43.14 |
| 1 | 1 | −1 | 37.55 |
| 4 | −1 | 0 | 29.15 |
| 7 | 0 | 0 | 54.06 |
| 5 | 1 | 0 | 55.36 |
| 2 | −1 | 1 | 30.69 |
| 11 | 0 | 1 | 59.03 |
| 9 | 1 | 1 | 62.94 |
| 12 | 0 | 0 | 52.57 |
| 10 | 0 | 0 | 49.5 |
| 6 | 0 | 0 | 54.02 |
At this point, the ANOVA analysis of the retained model was undertaken. The first decomposition, in ANOVA, split the total variation into two parts (Eq. 6) and was used to test the significance of the regression model.
 |
6 |
SStotal represents the total variation of the selected response, SSregression the amount of the variation that can be modeled, and SSresidual the amount of the variation that cannot be modeled. The size of the corresponding variances was compared by an F test (α = 5%). As shown in Table VI, the variance explained by the quadratic model was significantly larger than the unexplained variance. Accordingly, the first test of the ANOVA analysis assessed the significance of the regression. The second decomposition, in ANOVA, split the residual variation into two parts (Eq. 7) and was performed to compare the model error with the replicate error components.
 |
7 |
Table VI.
ANOVA Analysis for the Second-Order Polynomial Model
| Source | Sum of squares | Degrees of freedom | Mean square | F value | p value |
|---|---|---|---|---|---|
| Total corrected | 2,080.15 | 11 | 189.105 | ||
| Regression | 2,055.89 | 5 | 411.178 | 101.695 | <0.0001 |
| Residual | 24.26 | 6 | 4.043 | ||
| Lack of fit | 10.52 | 3 | 3.5054 | 0.765 | 0.584a |
| Pure error | 13.74 | 3 | 4.5811 |
aNull hypothesis (H0): the model has a lack of fit (α = 5%)
SSLof represents the lack of fit of the quadratic model and SSreplicate the experimental variability. The corresponding variances were also compared by means of an F test (α = 5%). As can be seen in Table VI, the p value of 0.584 ensured that the model did not present a significant lack of fit. The quadratic model can be written as follows (Eq. 8):
 |
8 |
Finally, the coefficient of determination, R2 or explained variation, was calculated at 0.988 and the coefficient of prediction, Q2 or the fraction of the variation of the response that can be predicted, was calculated at 0.950.
In order to maximize the experimental response, the optimal conditions were evaluated using the Nedler–Mead simplex method. In Fig. 3, the response surface showed a stationary point when 11 freeze-thawing cycles were applied and for the following lipid concentrations: 36.1 mM SPC, 36.1 mM CHOL, and 4 mM mPEG-2000-DSPE. The extreme value for the number of cycles, which had been previously predicted, justified the use of a central composite face-centered design. Under these conditions, the observed response (n = 3) was measured at 62.68 ± 2.93%, which represents an increase of 36.48% in comparison with the first chosen conditions and is close to the predicted response of 64.75 ± 3.55%. EEl was also calculated, amounting to 0.89 ± 0.04%.
Fig. 3.

The response surface of the optimization study. The upper darker area represents the optimal condition for the peptide encapsulation
The positive impact of the number of freeze-thawing cycles, identified as the first parameter with a positive and significant influence on the encapsulation efficiencies (EEp), could be explained by an increase in the permeability of the lipid bilayer when liposome suspensions are plunged into liquid nitrogen. Cryopreservation studies (25–28) indicate that the formation of ice crystals during the freezing of liposomes is responsible for the leakage of compound trapped in SUV. Furthermore, this leakage increases at the gel–liquid phase transition temperature of the phospholipid bilayer composed of phosphatidylcholine (29). This outflow could be related to the reverse effect observed in the study of Higgins et al., namely to the entry of the peptide into the inner cavity of the liposome (29). In that study, higher drug permeability was observed with a slow cooling rate in comparison with a high cooling rate and those experiments were not conducted in the exact conditions used for our experiments. However, the observations made in that study could identify the crossing of Print 3G through the phospholipid bilayer and could also explain the fact that the more cycles we carried out, the more drug entry was promoted.
Increasing the lipid concentration level certainly led to an increase in the number of liposomes present per milliliter and, therefore, to an increase in the total inner volume of liposomes (30). This explains why encapsulation efficiencies were improved for high lipid concentrations. Nevertheless, a saturation of this effect and even a decrease was observed on the response surface of the optimization study (Fig. 3). This might be explained by the handling difficulties of suspensions at very high lipid concentrations and by the possible impediment of the viscosity of the medium, which could hamper the free movement of Print 3G into the inner cavity of liposomes.
Characterization of Peptide-Loaded Liposomes
Unilamellar liposomes were first characterized using the PCS technique. Measurements were made before and after freeze-thawing cycles in order to ensure the physical integrity of liposomes during this manufacturing step. Sizes of 161.2 ± 12.7 nm before and of 162.0 ± 4.4 nm after freeze-thawing cycles were obtained with a polydispersity index always lower than 0.2, proof that samples were relatively monodisperse. Moreover, freeze-fracture electron microscopy allowed us to visualize the shape of liposomes after the freezing step, providing results close to those obtained with PCS (Fig. 4).
Fig. 4.
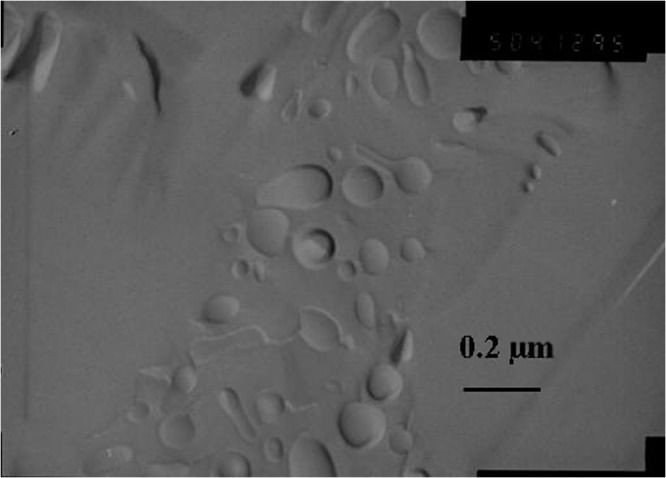
Transmission electron micrograph of freeze-fractured sample composed of SPC:CHOL:mPEG-2000-PE liposomes after 11 freeze-thawing cycles. Bar represents 0.2 μm
CONCLUSION
In conclusion, the theory of experimental design allowed us to prepare a peptide-loaded liposome formulation with an EEp close to 62% in a minimum of experiments number. This formulation of SUV, produced by the freeze-thawing method, was characterized in terms of size (around 200 nm) and shape by photon correlation spectroscopy and freeze-fracture electron microscopy. At the end of this study, the critical parameters to attain the optimal encapsulation of a peptidic drug into a suitable vector were identified to obtain an attractive candidate for further in vitro and in vivo studies. Moreover, this study highlights a practical approach based on the theory of experimental design, to facilitate and accelerate the development of novel liposomal formulations. Moreover, it emphasizes the fact that the experimental design is an essential tool to develop optimally formulations for valuable and expensive drugs.
Acknowledgments
This study was supported by the Walloon Region. We are grateful to P. Compere for helping us to carry out the freeze-fracture electron microscopy study.
References
- 1.Marson LP, Miller WR, Dixon JM. Angiogenesis and breast cancer. Breast. 1998;7:299–307. doi: 10.1016/S0960-9776(98)90071-6. [DOI] [Google Scholar]
- 2.Campbell RB. Influence of tumor physiology on delivery of therapeutics. In: Torchilin V, editor. Delivery of protein and peptide drugs in cancer. London: Imperial College Press; 2006. pp. 9–35. [Google Scholar]
- 3.Morabito A, Sarmiento R, Bonginelli P, Gasparini G. Antiangiogenic strategies, compounds, and early clinical results in breast cancer. Crit Rev Oncol Hematol. 2004;49:91–107. doi: 10.1016/S1040-8428(03)00168-9. [DOI] [PubMed] [Google Scholar]
- 4.Scappaticci FA. Mechanisms and future directions for angiogenesis-based cancer therapies. J Clin Oncol. 2002;20:3906–3927. doi: 10.1200/JCO.2002.01.033. [DOI] [PubMed] [Google Scholar]
- 5.Carmeliet P, Jain RK. Angiogenesis in cancer and other diseases. Nature. 2000;407:49–257. doi: 10.1038/35025220. [DOI] [PubMed] [Google Scholar]
- 6.Torchilin V. Anti-cancer proteins and peptides in liposomes. In: Torchilin V, editor. Delivery of protein and peptide drugs in cancer. London: Imperial College Press; 2006. pp. 155–182. [Google Scholar]
- 7.Katanasaka Y, Ida T, Asai T, Maeda N, Oku N. Effective delivery of an angiogenesis inhibitor by neovessel-targeted liposomes. Int J Pharm. 2008;6:219–224. doi: 10.1016/j.ijpharm.2008.04.046. [DOI] [PubMed] [Google Scholar]
- 8.Zhou XH, Li Wan Po A. Peptide and protein drugs: I. Therapeutics applications, absorption and parenteral administration. Int J Pharm. 1991;75:97–115. doi: 10.1016/0378-5173(91)90184-P. [DOI] [Google Scholar]
- 9.Banga AK, Chien YW. Systemic delivery of therapeutics peptides and proteins. Int J Pharm. 1988;48:15–50. doi: 10.1016/0378-5173(88)90246-3. [DOI] [Google Scholar]
- 10.Zhou XH, Wan Po AL. Peptide and protein drugs: I. Therapeutics applications, absorption and parenteral administration. Int J Pharm. 1991;75:97–115. doi: 10.1016/0378-5173(91)90184-P. [DOI] [Google Scholar]
- 11.Hanato J, Kuriyama K, Mizumoto T, Debari K, Hatanaka J, Onoue S, Yamada S. Liposomal formulations of glucagon-like peptide-1: improved bioavailability and anti-diabetic effect. Int J Pharm. 2009;382:111–116. doi: 10.1016/j.ijpharm.2009.08.013. [DOI] [PubMed] [Google Scholar]
- 12.Petrikovics I, Budai M, Baskin SI, Rockwood GA, Childress J, Budai L, Grof P, Klebovich I, Szilazi M. Characterization of liposomal vesicles encapsulating rhodanese for cyanide antagonism. Drug Deliv. 2009;16:312–319. doi: 10.1080/10717540903003711. [DOI] [PubMed] [Google Scholar]
- 13.Klibanov AL, Torchilin VP, Zalipsky S. Long-circulating sterically protected liposomes. In: Torchilin VP, Weissig V, editors. Liposomes, 2nd edn, a practical approach. New York: Oxford University Press; 2003. pp. 231–265. [Google Scholar]
- 14.Dos Santos SN, Allen C, Doppen AM, Anantha M, Cox KA, Gallagher RC, Karlsson G, Edwards K, Kenner G, Samuels L, Webb MS, Bally MB. Influence of poly(ethylene glycol) grafting density and polymer length on liposomes: relating plasma circulation lifetimes to protein binding. Biochim Biophys Acta. 2007;1768:1367–1377. doi: 10.1016/j.bbamem.2006.12.013. [DOI] [PubMed] [Google Scholar]
- 15.Torchilin V. Multifunctional and stimuli-sensitive pharmaceutical nanocarriers. Eur J Pharm Biopharm. 2009;71:431–444. doi: 10.1016/j.ejpb.2008.09.026. [DOI] [PMC free article] [PubMed] [Google Scholar]
- 16.Maeda H, Bharate GY, Daruwalla J. Polymeric drugs for efficient tumor-targeted drug delivery based on EPR-effect. Eur J Pharm Biopharm. 2008;71:409–419. doi: 10.1016/j.ejpb.2008.11.010. [DOI] [PubMed] [Google Scholar]
- 17.Greish K, Iyer AK, Fang J, Kawasuji M, Maeda H. Enhanced permeability and retention (EPR) effect and tumor selective delivery of anticancer drugs. In: Torchilin VP, editor. Delivery of protein and peptide drugs in cancer. London: Imperial College Press; 2006. pp. 37–52. [Google Scholar]
- 18.Vatanara A, Rouholamini Najafabadi A, Gilani K, Asgharian R, Darabi M, Rafiee-Tehrani M. A Plackett-Burman design for screening of the operation variables in the formation of salbutamol sulphate particles by supercritical antisolvent. J Supercrit Fluids. 2007;40:111–116. doi: 10.1016/j.supflu.2006.03.028. [DOI] [Google Scholar]
- 19.Hyenstrand P, Metcalf JS, Beattie KA, Codd GA. Effects of adsorption to plastics and solvent conditions in the analysis of the cyanobacterial toxin microcystin-LR by high performance liquid chromatography. Water Res. 2001;35:3508–3511. doi: 10.1016/S0043-1354(01)00068-9. [DOI] [PubMed] [Google Scholar]
- 20.John H, Walden M, Schafer S, Genz S, Forssmann WG. Analytical procedures for quantification of peptides in pharmaceutical research by liquid chromatography-mass spectrometry. Anal Bioanal Chem. 2004;378:883–897. doi: 10.1007/s00216-003-2298-y. [DOI] [PubMed] [Google Scholar]
- 21.Sallberg M, Blixt M, Zhang ZX, Ekstrand J. Passive adsorption of immunologically active and inactive synthetic peptides to polystyrene is influenced by the proportion of non-polar residues in the peptide. Immunol Lett. 1995;46:25–30. doi: 10.1016/0165-2478(95)00010-3. [DOI] [PubMed] [Google Scholar]
- 22.Grohganz H, Rischer M, Brandl M. Adsorption of the decapeptide Cetrorelix depends both on the composition of dissolution medium and the type of solid surface. Eu J Pharm Sci. 2004;21:191–196. doi: 10.1016/j.ejps.2003.10.008. [DOI] [PubMed] [Google Scholar]
- 23.Ramaldes GA, Deverre J-R, Grognet J-M, Puisieux F, Fattal E. Use of an enzyme immunoassay for the evaluation of entrapment efficiency and in vitro stability in intestinal fluids of liposomal bovine serum albumin. Int J Pharm. 1996;143:1–11. doi: 10.1016/S0378-5173(96)04710-2. [DOI] [Google Scholar]
- 24.Katanasaka Y, Ida T, Asai T, Maeda N, Oku N. Effective delivery of an angiogenesis inhibitor by neovessel-targeted liposomes. Int J Pharm. 2008;360:219–224. doi: 10.1016/j.ijpharm.2008.04.046. [DOI] [PubMed] [Google Scholar]
- 25.Fransen GJ, Salemink PJM, Crommelin DJA. Critical parameters in freezing of liposomes. Int J Pharm. 1986;33:27–35. doi: 10.1016/0378-5173(86)90035-9. [DOI] [Google Scholar]
- 26.Talsma H, Van Steenbergen MJ, Crommelin DJA. The cryopreservation of liposomes. III: almost complete retention of a water-soluble marker in small liposomes in a cryoprotectant containing dispersion after a freezing/thawing cycle. Int J Pharm. 1991;77:119–126. doi: 10.1016/0378-5173(91)90309-C. [DOI] [Google Scholar]
- 27.Siow LF, Rades T, Lim MH. Characterizing the freezing behavior of liposomes as a tool to understand the cryopreservation procedures. Cryobiology. 2007;55:210–221. doi: 10.1016/j.cryobiol.2007.08.002. [DOI] [PubMed] [Google Scholar]
- 28.Holovati JL, Gyongyossy-Issa MI, Acker JP. Effects of trehalose-loaded liposomes on red blood cell response to freezing and post-thaw membrane quality. Cryobiology. 2009;58:75–83. doi: 10.1016/j.cryobiol.2008.11.002. [DOI] [PubMed] [Google Scholar]
- 29.Higgins J, Hodges NA, Olliff CJ, Phillips AJ. Factors influencing cryoprotective activity and drug leakage from liposomes after freezing. J Pharm Pharmacol. 1986;38:259–263. doi: 10.1111/j.2042-7158.1986.tb04563.x. [DOI] [PubMed] [Google Scholar]
- 30.Zuidam JZ, de Vrueh R, Crommelin DJA. Characterization of liposomes. In: Torchilin VP, Weissig V, editors. Liposomes, 2nd edn, a practical approach. New York: Oxford University Press; 2003. pp. 31–78. [Google Scholar]