

Abstract
Chronic alcoholism leads to neurotoxic effects in the central nervous system. Neuroadaptive changes in the brain may lead to tolerance to, and dependence on, alcohol as a result of alterations in synaptic complexity. G-proteins are negatively regulated by RGS proteins, which are integral to many neural pathways that include neurotransmission, hormonal responses, and chemotactic signals. These considerations, together with findings from microarray analyses of human autopsy brain, suggest that proteins involved in G-protein signalling, specifically the RGS protein family, may play an important role in the functioning of neural systems that are affected by chronic alcohol abuse. We used Real Time PCR to measure the expression of two members of the RGS family, RGS4 and RGS7, in the superior frontal gyrus and primary motor cortex from alcoholic and non-alcoholic cases. Overall, cirrhotic alcoholics had lower expression levels of RGS4 mRNA than controls and non-cirrhotic alcoholics. We also report that the four RGS4 SNPs (SNP1, 4, 7 and 18) may be associated with alcoholism in European Caucasians at the haplotype level. The haplotype T-C-G (SNP1-4-18) may exert a protective effect against alcoholism.
Keywords: Sex differences, G-protein signaling, cirrhosis, Real Time PCR
Introduction
Chronic and excessive alcohol consumption has deleterious effects on the CNS, where it has been shown to cause brain damage to specific areas of the cerebral cortex (Kril et al. 1997). Neuropathological studies have shown that alcoholics have reduced brain weights and brain atrophy compared with non-drinking controls, and that the extent of atrophy can be correlated with estimates of lifetime alcohol consumption (Harding et al. 1996; Harper 1998; Kril and Halliday 1999). The reduced brain weight in alcoholics is attributed to a loss of white matter (Harper et al. 1985; de la Monte 1988) but cortical grey matter is also affected. Alcoholics show reduced dendritic arborization in a number of cortical regions, although neuronal loss only occurs in discrete regions, particularly the superior frontal gyrus (Kril and Harper 1989).
CNS damage is more severe in alcoholics who have concomitant diseases such as cirrhosis of the liver or the Wernicke-Korsakoff Syndrome (WKS) (Kril and Harper 1989). Women may be more vulnerable to the development of alcoholic brain damage (Mann et al. 1992). Neuropathological and neuroimaging studies suggest that the brain damage in alcoholic women is similar to that in men despite a shorter drinking history and lower peak alcohol consumption (Jacobson 1986; Harper et al. 1990; Harper 1998; Pfefferbaum et al. 2001). Female alcoholics are also more susceptible to grey-matter injury and cognitive deterioration than males (Schweinsburg et al. 2003; Wang et al. 2003).
In the brain, the acute effects of alcohol are mediated by interactions with various neurotransmitter and signalling systems. Long term alcoholism results in adaptive changes in neuronal function which may be mediated by changes in gene expression (Nestler and Aghajanian 1997). Microarray and proteomic studies have identified a number of genes involved in synaptic function and cell signalling which are differentially regulated in the frontal cortex of human alcoholics (Lewohl et al. 2000; Mayfield et al. 2002; Lewohl et al. 2004; Liu et al. 2004).
Regulator of G-protein signaling (RGS) proteins negatively modulate G-protein signalling thereby significantly influencing the kinetics and strength of in vivo receptor signalling pathways of the central nervous system and heart (Hooks et al. 2008). The RGS family is functionally and structurally diverse with 37 genes in the human genome containing RGS or RGS-like domains (Siderovski and Willard 2005; Willars 2006). Despite this diversity, RGS proteins share a conserved 125-amino-acid domain that forms the major contact sites with Gα subunit. Such contact stabilizes the binding between Gα and the transition state analogue of GTP hydrolysis, hence accelerating the Gα subunit GTP-hydrolytic activity (Tesmer et al. 2005).
The potent role played by RGS proteins in drug addiction is demonstrated by their wide distribution of mRNA expression and protein throughout the brain, including parts of the limbic system and reward pathway such as amygdala, stria terminalis and ventral tegmental area (Hooks et al. 2008). Moreover, cell culture and animal studies showed that RGS proteins are associated with modulation of responses to substances of abuse, and their mRNA expression is reciprocally affected by these drugs. For example, RGS4 negatively modulates μ-opioid receptor (MOR) signalling (Georgoussi et al. 2006) while acute morphine injection leads to increased transcription in nucleus accumbens (Bishop et al. 2002). The R7 RGS family (RGS6, RGS7, RGS9 and RGS11) also shows dramatic regulation by opioids; for example, RGS9 knockout mice demonstrated increased sensitivity to and more severe dependence on morphine (Zachariou et al. 2003). Although the function of RGS4 and its role in the pathophysiology of neuropsychiatric disorders such as schizophrenia and addiction remain unknown, RGS4 modulates serotonergic and dopaminergic signalling in the prefrontal cortex (Gu et al.) and may therefore play a role in mediating the effects of chronic alcohol abuse.
In microarray studies RGS4 is differentially expressed in the brain of human alcoholics (Lewohl et al. 2000). Although genetic associations between RGS4 and alcoholism have not been explored, RGS4 is a candidate gene for schizophrenia. RGS4 is located on chromosome 1q23.3. A whole-genome association study identified SNPs in 13 genes associated with both alcoholism and schizophrenia, two of which are located at 1q22-23 (Namkung et al. 2005). Four RGS4 SNPs and two haplotypes were found to be associated with schizophrenia by Chowdari et al. (2002) using a family-based approach: three localized in the upstream sequence [SNP1 (rs10917670); SNP4 (rs951436); SNP7 (rs951439)] and one in the first intron [SNP18 (rs2661319)]. A recent fMRI study showed that RGS4 SNP4 A allele carriers had reduced gray and white matter volume in certain prefrontal areas (Buckholtz et al. 2007). Another recent promoter activity study suggests that a 5′ upstream region, which includes SNP1, 4 and 7, may act as a repressor on RGS4 expression (Chowdari et al. 2008).
We studied the expression of RGS4 and RGS7 transcripts in human autopsy tissue from well-characterized alcoholics and matched controls. The data suggest that RGS4 but not RGS7 is differentially expressed in alcoholics and that there are sex differences in expression. As no previous study has explored the genetic association between polymorphisms in RGS4 and alcoholism, we also determined whether such association occurs in European Caucasians using a case-control approach.
Results
We analysed the expression levels of three commonly used housekeeping genes, GAPDH (glyceraldehyde-3-phosphate dehydrogenase), β-actin and HPRT (hypoxanthine phosphoribosyl transferase), as well as two brain-specific genes, neuron specific enolase (ENO2) and synaptophysin (SYP) to determine the most appropriate housekeeper for analysis. The expression of each of these transcripts was measured using Real Time PCR in every sample. Comprehensive statistical analysis was carried out on the raw CT values for each gene. No significant differences were found in the expression of GAPDH, β actin or ENO2 between groups, genders or brain regions. No significant differences were found in the expression of HPRT between groups or areas, but there was a significant difference in the expression of this transcript between males and females (F1,49 = 6.2, P < 0.02). There was a significant difference between ground for synaptophysin in the frontal cortex (F1,63 = 6.822, P = 0.02) but not in the motor cortex (F1,61 = 2.12, P = 1.3) making it unsuitable to be used as a house-keeping gene. BestKeeper, a software program designed to select the most appropriate house keeping gene for a given study, identified GAPDH as the ideal housekeeper for the data set. Accordingly, CT values for RGS4 and RGS7 were expressed relative to the CT value of GAPDH for each sample.
To determine if the expression of RGS4, or RGS7 was correlated with age at death, post-mortem interval (PMI) or brain weight, linear regression was performed on each parameter. Regression analysis was carried out using all subjects combined and with subjects separated according to alcohol status (controls vs. combined alcoholics). There was no significant correlation between either RGS4 or RGS7 expression and age at death or post mortem interval (PMI) for combined cases or for cases separated into their respective groups.
The expression of RGS4 mRNA was significantly correlated with brain weight (frontal, F1,59 = 8.597, P = 0.005; motor, F1,57 = 12.956, P = 0.001). When the groups were separated into controls and combined alcoholics, RGS4 (frontal, F1,36 = 9.036, P < 0.005; motor, F1,36 = 13.029, P = 0.001) showed significant regressions on brain weight in combined alcoholics but not in controls. To determine whether these regressions differed, a test of homogeneity of slopes was applied (Wilkinson. et al. 1992). The Group × Brain Weight interaction was not significant (RGS4 frontal: F2,55 = 0.9, P = 0.4; motor: F2,54 = 0.6, P = 0.55), which showed there was no difference between the slopes of the regression lines in the two groups. Since the case-groups did not differ significantly on brain weight (above), a simple factorial ANOVA was appropriate to analyse the data. The regression analyses described above were repeated in case-groups divided by gender. No difference was found between males and females in any of these tests.
In both frontal and motor cortices, RGS4 transcript levels differed significantly between groups (frontal, F2,58 = 7.135, P = 0.0017; motor, F2,56 = 5.678, P = 0.0057; Figure 1). Cirrhotic alcoholics had lower RGS4 expression than controls (frontal, P < 0.01; motor, P = 0.01) or non-cirrhotic alcoholics (frontal P < 0.02; motor, P < 0.03) on post-hoc tests. There was an overall difference between males and females, with RGS4 transcript levels being significantly lower in females than males (F1,50 = 6.75, P = 0.012). Post-hoc testing showed that the expression of RGS4 was significantly lower in cirrhotic alcoholic males than control males (frontal, P < 0.002; motor, P < 0.02) or non-cirrhotic alcoholic males (frontal, P < 0.006; motor, P < 0.05) in both brain regions. There were no such differences in female cases and controls.
Figure 1.
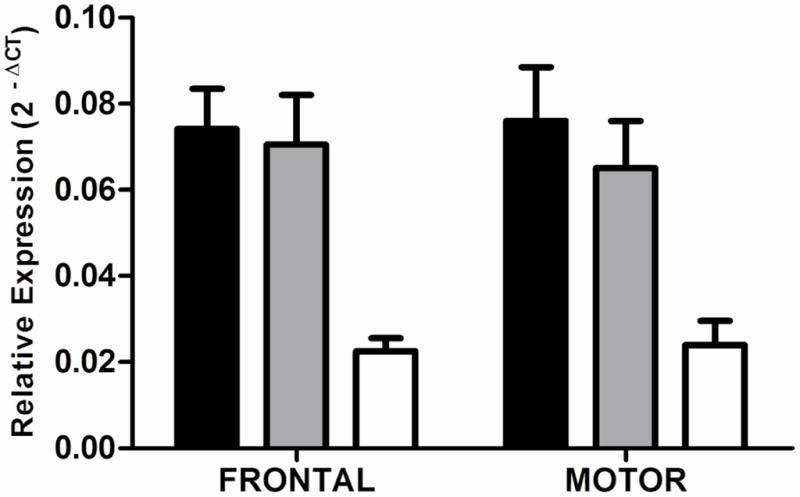
RGS4 transcript expression. Expression of RGS4 in the superior frontal gyrus and sensory motor cortex of cirrhotic alcoholics (open bars) is significantly lower than that of controls (black bars; frontal, P < 0.01; motor, P = 0.01) or non-cirrhotic alcoholics (shaded bars; frontal, P < 0.02; motor, P = 0.03). Mean ΔCT values were converted to 2−ΔCT values for presentation. The data presented in the graph includes cases and controls of both sexes. Error bars represent S.E.M.
There was no difference in expression of RGS7 either between case groups or between brain regions (frontal, F2,58 = 1.7, P = 0.2; motor, F2,56 = 1.6, P = 0.2; Figure 2).
Figure 2.

RGS7 transcript expression. Expression of RGS7 in the superior frontal gyrus and sensory motor cortex of controls (black bars), non-cirrhotic alcoholics (shaded bars) and cirrhotic alcoholics (open bars). There was no significant difference in expression between groups. Mean ΔCT values were converted to 2−ΔCT values for presentation. The data presented in the graph includes cases and controls of both sexes. Error bars represent S.E.M.
Genotyping results are shown in Table 1. For genotype distribution, no significant difference was observed between controls and alcoholics for SNP1, 4 and 7, only a marginal, non-significant difference was observed in SNP18 (χ2 = 5.600; P = 0.073). The genotype distributions of SNP 1, 4 and 18 in both controls and alcoholics were in Hardy-Weinberg equilibrium (Schweinsburg et al.). For SNP7, genotype distribution of alcoholics was in HWE but was not for controls (exact P = 0.017). For allele frequency, no significant difference was observed between the groups for any of the SNPs.
Table 1.
Association analysis of genotype allele frequencies of RGS4 SNPs.
| Genotype freq. (N(%) | P | Allele freq. N(%) | P | |||||
|---|---|---|---|---|---|---|---|---|
| Controls | Alcoholics | Controls | Alcoholics | |||||
| SNP1 (rs10917670) | TT | 30 (0.259) | 20 (0.202) | T | 106 (0.457) | 89 (0.450) | ||
| TC | 46 (0.397) | 49 (0.495) | C | 126 (0.543) | 109 (0.550) | 0.8779 | ||
| CC | 40 (0.344) | 30 (0.303) | 0.3341 | |||||
| Total | 116 | 99 | ||||||
| SNP4 (rs951436) | AA | 31 (0.256) | 32 (0.304) | A | 115 (0.475) | 111 (0.529) | ||
| AC | 53 (0.438) | 47 (0.448) | C | 127 (0.525) | 99 (0.471) | 0.2578 | ||
| CC | 37 (0.306) | 26 (0.248) | 0.5572 | |||||
| Total | 121 | 105 | ||||||
| SNP7 (rs951439) | CC | 46 (0.377) | 29 (0.261) | C | 139 (0.570) | 116 (0.523) | ||
| CT | 47 (0.385) | 58 (0.523) | T | 105 (0.430) | 106 (0478) | 0.3071 | ||
| TT | 29 (0.238) | 24 (0.216) | 0.0834 | |||||
| Total | 122* | 111 | ||||||
| SNP18 (rs2661319) | AA | 27 (0.223) | 28 (0.259) | A | 107 (0.442) | 114 (0.528) | ||
| AG | 53 (0.438) | 58 (0.537) | G | 135 (0.558) | 102 (0.472) | 0.0671 | ||
| GG | 41 (0.339) | 22 (0.204) | 0.0723 | |||||
| Total | 121 | 108 | ||||||
Genotype distribution deviates significantly from Hardy-Weinberg equilibrium (P=0.018)
Linkage disequilibrium (LD) analysis showed that all four SNPs were in moderate to strong pairwise LD (D′: 0.74–0.93; r2: 0.50–0.79). Compared with previous family-based genetic studies in schizophrenia (e.g. Zhang, et al. (2005), Chowdari, et al. (2008)), the LD of the four RGS4 SNPs are not as strong, because the case-control approach involves unrelated individuals.
In two-marker haplotype analysis (Table 2), the frequency of haplotype T-G (SNP1-18) was significantly lower in alcoholics (permutated χ2 = 9.274; permutated P = 0.0091). In three-marker haplotype analysis (Table 2), haplotype T-C-G (SNP1-4-18) was detected with a significantly lower frequency in alcoholics than controls (permutated χ2 = 8.339; permutated P = 0.0126). In four-marker haplotype analysis, a significant difference in haplotype frequency of T-C-C-G (SNP1-4-7-18) was detected; however, since the genotypic distribution of SNP7 deviated significantly from HWE in controls, this result can only provide weak support for SNP7 involvement.
Table 2.
Association analysis of two-marker, three-marker and four-marker haplotypes formed by RGS4 SNPs. χ2 and P values are based on observations of 10 000 permutations. Bold type indicates P < 0.05.
| Haplotype | Control freq. | Alcoholics freq. | Permutated χ2 | Permutated P | |
|---|---|---|---|---|---|
| SNP1-18 | CG | 0.465 | 0.446 | 0.162 | 0.9746 |
| TA | 0.372 | 0.445 | 2.606 | 0.3251 | |
| CA | 0.074 | 0.085 | 0.191 | 0.9658 | |
| TG | 0.089 | 0.023 | 9.274 | 0.0091 | |
| SNP1-4-18 | CCG | 0.454 | 0.417 | 0.657 | 0.9772 |
| TAA | 0.353 | 0.416 | 1.996 | 0.6734 | |
| CAA | 0.069 | 0.071 | 0.009 | 1.0000 | |
| TCG | 0.057 | 0.008 | 8.339 | 0.0126 | |
| TAG | 0.037 | 0.020 | 1.175 | 0.8638 | |
| TCA | 0.016 | 0.029 | 0.869 | 0.9391 | |
| CAG | 0.010 | 0.024 | 1.350 | 0.8132 | |
| SNP1-4-7-18* | CCCG | 0.437 | 0.419 | 0.168 | 1.0000 |
| TATA | 0.344 | 0.414 | 2.457 | 0.5736 | |
| CACA | 0.063 | 0.063 | 0 | 1.0000 | |
| TATG | 0.041 | 0.024 | 1.160 | 0.8833 | |
| TCCG | 0.052 | 0.006 | 8.453 | 0.0117 | |
| TCTA | 0.021 | 0.029 | 0.345 | 0.9999 | |
| CACG | 0.005 | 0.019 | 2.054 | 0.6753 | |
SNP7 genotypic distribution in controls deviates from HWE.
Partitioning of the expression data according to each individual’s RGS4 genotype had no effect for any of the SNPs individually or in combination. Probable haplotypes for each individual were assigned using PHASE. Within the expression cohort, only two control individuals were predicted to have the protective RGS4 haplotype. Although these individuals had higher expression of RGS4 compared with those without the protective haplotype, this did not reach significance most likely due to the small number of cases with the protective haplotype in this population.
Discussion
The expression of RGS4 and RGS7 transcripts were measured in the superior frontal gyrus and primary motor cortex of control, non-cirrhotic alcoholic and cirrhotic alcoholic cases using Real Time RT-PCR. Overall, the expression of RGS4 was significantly lower in cirrhotic alcoholics than in controls or alcoholics without co-morbid disease. The effect of alcohol on the expression of this transcript was particularly marked in males; the RGS4 transcript was significantly less abundant in male cirrhotic alcoholics than in male controls. There was no such reduction of these transcripts in female cases. Further studies should be carried out to determine if RGS4 is regulated via different mechanisms in males and females. In contrast, there was no difference in RGS7 expression between controls and alcoholics overall, or between males and females.
The primers used to measure RGS4 expression amplified three of the five known splice variants (Ding et al.). These splice variants are differentially expressed in the human brain and have been shown to be differentially regulated in schizophrenia (Ding and Hegde 2009). Although no difference in expression was seen in alcoholics without co-morbid disease, chronic alcohol abuse may have an effect on the expression of individual variants, which is masked when using primers that are not selective for individual splice variants. Future studies should investigate the expression levels of individual splice variants in the prefrontal cortex of chronic alcoholics.
Neuropathological studies have shown that the damage to the cerebral cortex that occurs as a consequence of chronic alcohol abuse is not uniform. The superior frontal gyrus is particularly susceptible to neuronal loss but other cortical regions, such as the primary motor cortex, do not show neuronal loss (Kril and Harper 1989). Both cortical regions show changes in dendritic arborization, which likely has an effect on synaptic connectivity. Dendritic shrinkage is reversible following prolonged abstinence from alcohol in an experimental model (McMullen et al. 1984). The expression of RGS4 was lower in both the superior frontal gyrus, and the motor cortex, suggesting that the decrease in this transcript is not the result of neuronal loss per se but may instead reflect the changes in dendritic arborization that occurs in both cortical regions. Whether changes in RGS4 expression occur as a direct consequence of chronic alcohol abuse, or as a result of changes in synaptic number, and whether these changes in expression are reversible upon abstinence from alcohol, remain to be elucidated.
In this study, we used a case-control association approach to explore differences in genotypic composition of four RGS4 SNPs, and detected a significantly lower T-C-G (SNP1-4-18) haplotype frequency in alcoholics than in controls. This suggests that this haplotype, although it is not common, may have a protective effect against alcoholism. The significant difference detected in four-marker haplotype analysis may not offer compelling support for SNP7 involvement because its genotypic distribution in controls deviated significantly from HWE, either due to small sample size or population stratification. Confirmation of the current findings, either in a larger case-control population or a family-based approach, is required.
To date, there have been no published studies on the effects of alcohol on the expression of RGS transcripts or proteins in laboratory animals. However, RGS expression is altered by the administration of other drugs of abuse and in other diseases. A microarray study using brain tissue from human schizophrenics showed a decrease in RGS4 mRNA in the prefrontal cortex (Mirnics et al. 2001). One suggested hypothesis was that this decrease could be an adaptive response to compensate for a reduction in synapse number or function. This may be true for many neurodegenerative disorders, including alcoholism.
Drug abuse results in neuroadaptive changes in the brain that include the development of tolerance, dependence and withdrawal. RGS4 modulates neurotransmission by impeding G-protein coupled receptor signalling. It is known to modulate a variety of signalling systems, including opioid, serotonergic and dopaminergic receptor systems. This therefore makes it excellent candidate for involvement in mediating the effects of pleiotropic drugs such as alcohol. RGS4 is a negative regulator of MOR (Georgoussi et al. 2006) and studies using knockout mice showed that a loss of RGS4 led to a more-severe physical dependence and withdrawal on morphine due to sensitization of the cAMP pathway in locus ceruleus neurons (Zachariou et al. 2006; Hooks et al. 2008). Since MOR-mediated transmission participates in alcohol reward, tolerance and withdrawal (Sander et al. 1998), RGS4 may play a significant role in the regulation of these events. RGS4 also negatively modulates 5-HT1A regulation of NMDA receptors in the prefrontal cortex (Gu et al.). A loss of RGS4 in the prefrontal cortex of alcoholics may therefore alter glutamate receptor signalling and predispose these neurons to glutamate-mediated excitotoxicity.
In conclusion, we report a difference in expression of RGS4 in the brains of male cirrhotic alcoholics compared with male controls, with no difference in expression in female subjects. We also report that the four RGS4 SNPs (SNP1, 4, 7 and 18) may be associated with alcoholism in European Caucasians at the haplotype level. The haplotype T-C-G (SNP1-4-18) may exert a protective effect against alcoholism. The present findings need to be validated with larger sample size or in family-based association studies.
Experimental Procedures
Subject Characteristics
Tissues were collected through The Queensland Brain Bank and The Australian Brain Donor Program NSW Tissue Resource Centre. Ethical clearance for the project was obtained from the Griffith University Human Ethics Committee (Protocol Number: MSC/02/06/HREC). The cerebellum and brainstem were detached from the cerebrum by sectioning through the upper midbrain at the level of the superior colliculus. The cerebrum was hemi-sected, with one half being taken for pathological examination. Cortical and sub-cortical pieces were dissected from the other hemisphere, immersed in ~10 vol of 0.32 M sucrose, and slowly frozen as previously described for the optimal preservation of synaptosomal function (Dodd et al. 1986). Frozen tissue pieces were stored at −70°C until required.
For genotyping studies, DNA was extracted from125 controls and 115 alcoholics. Subjects were classified by their daily average ethanol consumption in most of their adult life as reported in their medical records. Controls were those who consumed an average of <20 g of ethanol per day or were teetotalers; alcoholics were those who had a mean intake of >80 g of ethanol per day (for 30 years on average). All cases were of European origin. No schizophrenic case was included.
Expression studies were performed on a subset of the above cohort. Total RNA was extracted from the superior frontal gyrus (Brodmann areas 6 and 8) and primary motor cortex (area 4) of 24 controls and 40 alcoholics who were matched as closely as possible for PMI and age at death. There was no significant difference between case groups for either age at death (F2,61 = 2.64, P = 0.08) or PMI (F2,61 = 0.4, P = 0.7). Fresh brain weights were measured at autopsy for each case. There was no significant difference in brain weight between groups (F2,61 = 2.57, P = 0.08). For expression studies, alcoholics were further divided into those with (27 cases) or without (13 cases) pathologically confirmed cirrhosis of the liver. Exact alcohol consumption details were not available in every case, but in a related study drawing on the same bank of tissue, the average daily consumption rate in alcoholics without alcohol-associated disease was 13 standard drinks (130 g ethanol), while for alcoholics with cirrhosis, it was 25 standard drinks (250 g ethanol) (Dodd et al. 2004). Cases with a history of poly-drug abuse or other neurological conditions were excluded. Brief details of the cases are shown in Table 3.
Table 3.
Case Information – Expression Study
| Group | N | Age (y) | PMI (h) | BW (g) |
|---|---|---|---|---|
| Control | 24 | 61.5 ± 2.8 | 30.1 ± 5.0 | 1334 ± 24.3 |
| Female | 12 | 58.1 ± 4.6 | 27.9 ± 7.3 | 1266 ± 24.6 |
| Male | 12 | 65.0 ± 2.9 | 32.4 ± 7.2 | 1402 ± 32.0 |
| Alcoholic without comorbid disease | 27 | 52.8 ± 2.8 | 29.9 ± 3.2 | 1338 ± 25.1 |
| Female | 10 | 47.3 ± 4.3 | 26.7 ± 5.2 | 1232 ± 24.6 |
| Male | 17 | 56.0 ± 3.4 | 31.7 ± 4.0 | 1401 ± 27.7 |
| Cirrhotic Alcoholic | 13 | 59.5 ± 3.9 | 24.2 ± 5.6 | 1249 ± 33.5 |
| Female | 6 | 58.3 ± 6.2 | 28.9 ± 11.8 | 1162 ± 38.5 |
| Male | 7 | 60.6 ± 5.5 | 20.3 ± 3.4 | 1323 ± 33.6 |
PMI, post-mortem interval, BW, brain weight
Values are means ± SEM
Total RNA Extraction
Total RNA was extracted from the superior frontal gyrus and primary motor cortex using Trizol™ (Gibco BRL, Invitrogen, Mt Waverley, Vic, Australia) according to the manufacturer’s instructions. In brief, 5 mL Trizol™ was added to a 0.5 g piece of frozen brain tissue, homogenized on ice with a polytron (Kinematika, Switzerland) for 30 s and incubated for 5 min at room temperature. Chloroform (1 mL) was added and the tube shaken vigorously for 15 s, incubated for 2 min and centrifuged at 10 000 × g for 20 min at 4°C. Isopropanol (2.5 mL) was added to the aqueous phase and the sample was incubated at room temperature for 10 min prior to centrifugation at 10 000 × g for 15 min at 4°C. The supernatant was removed and the pellet resuspended in 1 mL 75% ethanol and centrifuged at 10 000 × g for 20 min. The ethanol was removed and the pellet was air-dried. DEPC-treated water (~50 μL) was added to the RNA pellet and incubated for 10 min at 60°C. RNA quantity was measured by absorbance at 260 nm. The RNA was then dispensed in 20 μL aliquots and stored at −70°C until required. RNA quality was assessed by agarose gel electrophoresis and an Agilent 2100 Bioanalyzer (Agilent, Palo Alto, CA, USA) and showed minimal degradation.
Reverse Transcription
Samples were reverse-transcribed using an Oligo(dT)20mer. A mix of 3.8 μM oligo(dT)20 (Sigma-Aldrich, Castle Hill, NSW, Australia), 2 μg total RNA, 0.77 mM dNTPs (Promega, Annandale, NSW, Australia) in a final volume of 13 μL with DEPC-treated water, was incubated at 65°C for 5 min and placed on ice for at least 1 min. 4 μL 5× first-strand synthesis buffer, 50 mM dithiothreitol (DTT), 40 U RNaseOUT™ and 200 U Superscript™ III (Invitrogen) were added and the solution incubated at 50°C for 1 h. The reaction was deactivated by heating to 70°C for 15 min. Samples were aliquoted and stored at −70°C until required.
Primer Design
Primers were designed using Primer Express® v1.5 Software (Applied Biosystems, Scoresby, Vic, Australia) and synthesised by Sigma-Aldrich. Each primer set was verified for gene specificity using BLAST from the GenBank non-redundant nucleotide sequence database. All of the assays were designed such that at least one of the primer pair spanned an exon boundary to eliminate gDNA amplification. The primers for RGS4 amplify three of the five known splice variants; RGS4-1 (NM_001102445.2), RGS4-2 (NM_005613.5) and RGS4-3 (NM_001113380.1). The sequence of the primers is shown in Table 4.
Table 4.
Primer Sequences – Expression Study
| Primers | GenBank Accession No | |
|---|---|---|
| SYP | Forward: 5′-TGAAGGTGCTGCAATGGGT-3′ Reverse: 5′-TGTTGGCACAATCCACGC-3′ |
NM_003179 |
| RGS4 | Forward: 5′-CCAGGCAACCAAAGAGGTGA-3′ Reverse: 5′-GGCCTCATCAAAGCAGGTTATT-3′ |
NM_005613 |
| RGS7 | Forward: 5′-GATTCCAAGAGTTATGACAAAACCAC-3′ Reverse: 5′-CATCAGTTTGTAAATGTGCTCCTGA-3′ |
NM_002924 |
| ENO2 | Forward: 5′-TGGAGACAAACAGCGTTACTTAGG-3′ Reverse: 5′-GAGAGACCTGAGCTGATGAGGG-3′ |
NM_001975.2 |
| ACTB | Forward: 5′-CTGGAACGGTGAAGGTGACA-3′ Reverse: 5′-AAGGGACTTCCTGTAACAATGCA-3′ |
NM_001101.2 |
| HPRT | Forward: 5′-TGACACTGGCAAAACAATGCA-3′ Reverse: 5′-GTTCCTTTTCACCAGCAAGCT-3′ |
NM_000194.1 |
| GAPDH | Forward: 5′-TGCACCACCAACTGCTTAGC-3′ Reverse: 5′-TCCATCATCAGAAAGGCAGTA-3′ |
NM_002046 |
Real Time PCR
Real Time PCR was carried out using an ABI 7000 sequencer (Applied Biosystems) with SYBR® Green as the detection system. Primer concentrations were optimized to determine the minimum primer concentration that gave a low threshold cycle and a maximum ΔRn while minimizing non-specific amplification. Each polymerase chain reaction (PCR) on the 96-well plate consisted of 5 ng of cDNA, 12.5 μL SYBR® Green PCR Master Mix (Applied Biosystems), 300 nM of each pair of oligonucleotide primers in a 25 μL final volume per well. Wells with no template were included for each primer set as negative controls. GAPDH was used as the internal reference for determining ΔCT values. All samples were amplified in duplicate.
The amplification plot of fluorescence vs. cycle number was used to set the threshold (T) in the exponential phase of the reaction above the baseline. This was kept constant between runs to allow for analysis between plates. The cycle threshold (CT) was calculated as the cycle number of an amplifying PCR product where it crosses the fixed threshold line. Intra- and inter-assay variability was tested using cDNA serial dilutions generated from universal human reference RNA (Stratagene, Integrated Sciences, Willoughby, NSW, Australia) on three separate days for each primer pair.
The difference in the mean CT values of the duplicate samples against the housekeeping genes were calculated using Microsoft Excel to give the ΔCT. The relative quantitation value was then expressed as 2−ΔCT for presentation as outlined in User Bulletin #2: ABI Prism 7700 Sequence Detection System using the comparative CT method (Applied Biosystems).
DNA Extraction and Genotyping
Genomic DNA was extracted from human brain tissue by phenol/chloroform method followed by ethanol precipitation.
SNP1, 4 and 18 were genotyped by PCR-RFLP method. In brief, 10 ng of sample DNA was added into the reaction mix, which consisted of 1x PCR buffer with MgCl2, 200 μM dNTPs, forward and reverse primers at 800 nM each and 0.3 U Taq DNA polymerase. Amplification cycle included a 3-minute 95°C initial denaturation step, followed by 35 cycles of 95°C for 30 s, annealing for 30 s and 72°C for 30 s, and lastly at 72°C for 7 mins for elongation. The PCR products were then incubated with restriction enzyme overnight. Final products were loaded onto an agarose gel (2–4%) for the determination of enzyme digestion pattern. Details of the protocols are listed in Table 5.
Table 5.
Genotyping methods details.
| Genotyping Method | Primers | Annealing Temperature | Amplicon Size | Restriction Enzymes | Resulting Fragment | |
|---|---|---|---|---|---|---|
| SNP1 | PCR-RFLP | Forward:5′-GAAAAGTTGGAATGGGGATG-3′ Reverse: 5′-TTCATTTGCATTGTGCAGGT-3′ |
60°C | 245 bp | BstNI | T: 245 bp C: 156 bp, 89 bp |
| SNP4 | PCR-RFLP | Forward: 5′-GGTGCAAAGAATTGGACACA-3′ Reverse: 5′-ACATCAATGAGAGTTCAGTTATCG-3′ |
60°C | 140bp | ClaI | C:140bp A:115bp,25bp |
| SNP7 | HRM | Forward: 5′-TGCTGTGTGGCTGAATGTCT-3′ Reverse: 5′-TGGCAAAAAGTTTGAAGGCTA-3′ |
58°C | 128 bp | - | - |
| SNP18 | PCR-RFLP | Forward: 5′-TGGGGCAGAGAGATAAGGAA-3′ Reverse: 5′-TCCATCATCAGAAAGGCAGTA-3′ |
60°C | 129 bp | CviQI | A:129 bp G:108 bp, 21 bp |
High resolution melting (HRM) was used for SNP7 genotyping as the PCR-RFLP protocol yielded ambiguous digestion patterns. HRM determines genotypes by measuring the change in fluorescence of the sample with increasing temperature in real time; the melt profiles are distinct for each genotype. 10 ng of sample DNA was added into a reaction mix, which was composed of 1x PCR buffer (without MgCl2), 1.5 mM MgCl2, 200 μM dNTPs, forward and reverse primers (Table 4) at 300 nM each, 1.5 μM SYTO9 (Invitrogen, USA) and 1.25 U Taq Gold DNA polymerase (Applied Biosystem, USA). This 25 μL reaction mixture then underwent PCR followed by HRM in Rotor-Gene 6000TM Real-time Rotary Analyzer (Corbett Life Science, Australia). The amplification procedure consisted of 95°C for 2 mins, 45 cycles of 95°C for 5 s and 58°C for 10 s, and 72°C for 2 mins. A 2-minute pre-hold applied before the HRM procedure (temperature increased from 73°C to 83°C at a rate of 0.1°C per 2 seconds). Rotor-Gene 6000 Series Software v1.7 (Corbett LifeScience, Australia) was used to analyse the resultant curves. Genotyping amplimers of all SNPs were validated by sequencing.
Analysis of data
Analysis of the expression data was performed using STATISTICA 7.0 (Statsoft Pacific Pty Ltd, Melbourne, Australia). Analysis of Variance (ANOVA) was followed by the relevant post hoc test where appropriate. The effects of age at death, PMI, brain weight and gender were determined. Differences between the slopes of the regression lines were also tested. When regression was significant, covariance analysis was used to normalize the data and to produce adjusted least-square means and S.E.M. values.
HWE of genotype frequencies of each SNP was tested by exact tests using the DeFinetti programme (http://ihg2.helmholtz-muenchen.de/ihg/snps.html). Genotype and allele frequencies were compared between cases and controls by χ2 test using SPSS 16 (SPSS, USA). HaploView v4.1 (Barrett et al. 2005) was used for linkage disequilibrium (LD) calculation (D′ and r2), haplotype prediction and case-control haplotype frequency comparison (χ2 test with 10 000 permutations to correct for multiple testing bias).
Acknowledgments
We would like to acknowledge the Queensland Brain Bank, School of Chemistry and Molecular Biosciences, the University of Queensland in collaboration with the Australian Brain Bank Network and the Australian Brain Donor Programs NSW Tissue Resource Centre who provided the alcoholic and control brain tissue for analysis. Allison Eckert and Donna Sheedy provided detailed information on each of the cases used. We thank the next of kin for providing informed written consent for the studies. Financial support was provided by the National Institute of Alcoholism and Alcohol Abuse (USA, NIH AA12404) (R01 AA012725-04) and the NHMRC. Ada M.-C. Ho was funded by the Margaret Mittelheuser Commemorative Fellowship from AFUW-Q/FFI during the course of this study.
Abbreviations used
- RGS
regulator of G-protein signaling
- WKS
Wernicke-Korsakoff Syndrome
- G-protein
guanine nucleotide binding protein
- MOR
mu-opioid receptor
- PMI
post-mortem interval
- GAPDH
Glyceraldehyde-3-phosphate dehydrogenase
- HPRT
hypoxanthine phosphoribosyl transferase
- ENO2
enolase 2 (neuron-specific enolase)
- SYP
synaptophysin
- CT
cycle threshold
- SNP
single nucleotide polymorphism
- HWE
Hardy-Weinberg equilibrium
- LD
linkage disequilibrium
- HRM
High resolution melting
- SNP
single nucleotide polymorphism
Footnotes
Publisher's Disclaimer: This is a PDF file of an unedited manuscript that has been accepted for publication. As a service to our customers we are providing this early version of the manuscript. The manuscript will undergo copyediting, typesetting, and review of the resulting proof before it is published in its final citable form. Please note that during the production process errors may be discovered which could affect the content, and all legal disclaimers that apply to the journal pertain.
References
- Barrett JC, Fry B, Maller J, Daly MJ. Haploview: analysis and visualization of LD and haplotype maps. Bioinformatics. 2005;21:263–265. doi: 10.1093/bioinformatics/bth457. [DOI] [PubMed] [Google Scholar]
- Bishop GB, Cullinan WE, Curran E, Gutstein HB. Abused drugs modulate RGS4 mRNA levels in rat brain: comparison between acute drug treatment and a drug challenge after chronic treatment. Neurobiol Dis. 2002;10:334–343. doi: 10.1006/nbdi.2002.0518. [DOI] [PubMed] [Google Scholar]
- Buckholtz JW, Meyer-Lindenberg A, Honea RA, Straub RE, Pezawas L, Egan MF, Vakkalanka R, Kolachana B, Verchinski BA, Sust S, Mattay VS, Weinberger DR, Callicott JH. Allelic variation in RGS4 impacts functional and structural connectivity in the human brain. J Neurosci. 2007;27:1584–1593. doi: 10.1523/JNEUROSCI.5112-06.2007. [DOI] [PMC free article] [PubMed] [Google Scholar]
- Chowdari KV, Bamne M, Wood J, Talkowski ME, Mirnics K, Levitt P, Lewis DA, Nimgaonkar VL. Linkage disequilibrium patterns and functional analysis of RGS4 polymorphisms in relation to schizophrenia. Schizophr Bull. 2008;34:118–126. doi: 10.1093/schbul/sbm042. [DOI] [PMC free article] [PubMed] [Google Scholar]
- Chowdari KV, Mirnics K, Semwal P, Wood J, Lawrence E, Bhatia T, Deshpande SN, BKT, Ferrell RE, Middleton FA, Devlin B, Levitt P, Lewis DA, Nimgaonkar VL. Association and linkage analyses of RGS4 polymorphisms in schizophrenia. Hum Mol Genet. 2002;11:1373–1380. doi: 10.1093/hmg/11.12.1373. [DOI] [PubMed] [Google Scholar]
- de la Monte SM. Disproportionate atrophy of cerebral white matter in chronic alcoholics. Arch Neurol. 1988;45:990–992. doi: 10.1001/archneur.1988.00520330076013. [DOI] [PubMed] [Google Scholar]
- Ding L, Hegde AN. Expression of RGS4 splice variants in dorsolateral prefrontal cortex of schizophrenic and bipolar disorder patients. Biol Psychiatry. 2009;65:541–545. doi: 10.1016/j.biopsych.2008.10.026. [DOI] [PubMed] [Google Scholar]
- Ding L, Mychaleckyj JC, Hegde AN. Full length cloning and expression analysis of splice variants of regulator of G-protein signaling RGS4 in human and murine brain. Gene. 2007;401:46–60. doi: 10.1016/j.gene.2007.07.002. [DOI] [PubMed] [Google Scholar]
- Dodd PR, Foley PF, Buckley ST, Eckert AL, Innes DJ. Genes and gene expression in the brain of the alcoholic. Addict Behav. 2004;29:1295–1309. doi: 10.1016/j.addbeh.2004.06.010. [DOI] [PubMed] [Google Scholar]
- Dodd PR, Hardy JA, Baig EB, Kidd AM, Bird ED, Watson WE, Johnston GA. Optimization of freezing, storage, and thawing conditions for the preparation of metabolically active synaptosomes from frozen rat and human brain. Neurochem Pathol. 1986;4:177–198. doi: 10.1007/BF02834357. [DOI] [PubMed] [Google Scholar]
- Georgoussi Z, Leontiadis L, Mazarakou G, Merkouris M, Hyde K, Hamm H. Selective interactions between G protein subunits and RGS4 with the C-terminal domains of the mu- and delta-opioid receptors regulate opioid receptor signaling. Cell Signal. 2006;18:771–782. doi: 10.1016/j.cellsig.2005.07.003. [DOI] [PubMed] [Google Scholar]
- Gu Z, Jiang Q, Yan Z. RGS4 modulates serotonin signaling in prefrontal cortex and links to serotonin dysfunction in a rat model of schizophrenia. Mol Pharmacol. 2007;71:1030–1039. doi: 10.1124/mol.106.032490. [DOI] [PubMed] [Google Scholar]
- Harding AJ, Halliday GM, Ng JL, Harper CG, Kril JJ. Loss of vasopressin-immunoreactive neurons in alcoholics is dose-related and time-dependent. Neuroscience. 1996;72:699–708. doi: 10.1016/0306-4522(95)00577-3. [DOI] [PubMed] [Google Scholar]
- Harper C. The neuropathology of alcohol-specific brain damage, or does alcohol damage the brain? J Neuropathol Exp Neurol. 1998;57:101–110. doi: 10.1097/00005072-199802000-00001. [DOI] [PubMed] [Google Scholar]
- Harper CG, Kril JJ, Holloway RL. Brain shrinkage in chronic alcoholics: a pathological study. Br Med J (Clin Res Ed) 1985;290:501–504. doi: 10.1136/bmj.290.6467.501. [DOI] [PMC free article] [PubMed] [Google Scholar]
- Harper CG, Smith NA, Kril JJ. The effects of alcohol on the female brain: a neuropathological study. Alcohol Alcohol. 1990;25:445–448. [PubMed] [Google Scholar]
- Hooks SB, Martemyanov K, Zachariou V. A role of RGS proteins in drug addiction. Biochem Pharmacol. 2008;75:76–84. doi: 10.1016/j.bcp.2007.07.045. [DOI] [PubMed] [Google Scholar]
- Jacobson R. The contributions of sex and drinking history to the CT brain scan changes in alcoholics. Psychol Med. 1986;16:547–559. doi: 10.1017/s003329170001031x. [DOI] [PubMed] [Google Scholar]
- Kril JJ, Harper CG. Neuronal counts from four cortical regions of alcoholic brains. Acta Neuropathol (Berl) 1989;79:200–204. doi: 10.1007/BF00294379. [DOI] [PubMed] [Google Scholar]
- Kril JJ, Halliday GM. Brain shrinkage in alcoholics: a decade on and what have we learned? Prog Neurobiol. 1999;58:381–387. doi: 10.1016/s0301-0082(98)00091-4. [DOI] [PubMed] [Google Scholar]
- Kril JJ, Halliday GM, Svoboda MD, Cartwright H. The cerebral cortex is damaged in chronic alcoholics. Neuroscience. 1997;79:983–998. doi: 10.1016/s0306-4522(97)00083-3. [DOI] [PubMed] [Google Scholar]
- Lewohl JM, Wang L, Miles MF, Zhang L, Dodd PR, Harris RA. Gene expression in human alcoholism: microarray analysis of frontal cortex. Alcohol Clin Exp Res. 2000;24:1873–1882. [PubMed] [Google Scholar]
- Lewohl JM, Van Dyk DD, Craft GE, Innes DJ, Mayfield RD, Cobon G, Harris RA, Dodd PR. The application of proteomics to the human alcoholic brain. Ann N Y Acad Sci. 2004;1025:14–26. doi: 10.1196/annals.1316.002. [DOI] [PubMed] [Google Scholar]
- Liu J, Lewohl JM, Dodd PR, Randall PK, Harris RA, Mayfield RD. Gene expression profiling of individual cases reveals consistent transcriptional changes in alcoholic human brain. J Neurochem. 2004;90:1050–1058. doi: 10.1111/j.1471-4159.2004.02570.x. [DOI] [PubMed] [Google Scholar]
- Mann K, Batra A, Gunthner A, Schroth G. Do women develop alcoholic brain damage more readily than men? Alcohol Clin Exp Res. 1992;16:1052–1056. doi: 10.1111/j.1530-0277.1992.tb00698.x. [DOI] [PubMed] [Google Scholar]
- Mayfield RD, Lewohl JM, Dodd PR, Herlihy A, Liu J, Harris RA. Patterns of gene expression are altered in the frontal and motor cortices of human alcoholics. J Neurochem. 2002;81:802–813. doi: 10.1046/j.1471-4159.2002.00860.x. [DOI] [PubMed] [Google Scholar]
- McMullen PA, Saint-Cyr JA, Carlen PL. Morphological alterations in rat CA1 hippocampal pyramidal cell dendrites resulting from chronic ethanol consumption and withdrawal. J Comp Neurol. 1984;225:111–118. doi: 10.1002/cne.902250112. [DOI] [PubMed] [Google Scholar]
- Mirnics K, Middleton FA, Stanwood GD, Lewis DA, Levitt P. Disease-specific changes in regulator of G-protein signaling 4 (RGS4) expression in schizophrenia. Mol Psychiatry. 2001;6:293–301. doi: 10.1038/sj.mp.4000866. [DOI] [PubMed] [Google Scholar]
- Namkung J, Kim Y, Park T. Whole-genome association studies of alcoholism with loci linked to schizophrenia susceptibility. BMC Genet. 2005;6(Suppl 1):S9. doi: 10.1186/1471-2156-6-S1-S9. [DOI] [PMC free article] [PubMed] [Google Scholar]
- Nestler EJ, Aghajanian GK. Molecular and cellular basis of addiction. Science. 1997;278:58–63. doi: 10.1126/science.278.5335.58. [DOI] [PubMed] [Google Scholar]
- Pfefferbaum A, Rosenbloom M, Deshmukh A, Sullivan E. Sex differences in the effects of alcohol on brain structure. Am J Psychiatry. 2001;158:188–197. doi: 10.1176/appi.ajp.158.2.188. [DOI] [PubMed] [Google Scholar]
- Sander T, Gscheidel N, Wendel B, Samochowiec J, Smolka M, Rommelspacher H, Schmidt LG, Hoehe MR. Human mu-opioid receptor variation and alcohol dependence. Alcohol Clin Exp Res. 1998;22:2108–2110. [PubMed] [Google Scholar]
- Schweinsburg BC, Alhassoon OM, Taylor MJ, Gonzalez R, Videen JS, Brown GG, Patterson TL, Grant I. Effects of alcoholism and gender on brain metabolism. Am J Psychiatry. 2003;160:1180–1183. doi: 10.1176/appi.ajp.160.6.1180. [DOI] [PubMed] [Google Scholar]
- Siderovski DP, Willard FS. The GAPs, GEFs, and GDIs of heterotrimeric G-protein alpha subunits. Int J Biol Sci. 2005;1:51–66. doi: 10.7150/ijbs.1.51. [DOI] [PMC free article] [PubMed] [Google Scholar]
- Tesmer VM, Kawano T, Shankaranarayanan A, Kozasa T, Tesmer JJ. Snapshot of activated G proteins at the membrane: the Galphaq-GRK2-Gbetagamma complex. Science. 2005;310:1686–1690. doi: 10.1126/science.1118890. [DOI] [PubMed] [Google Scholar]
- Wang GJ, Volkow ND, Fowler JS, Franceschi D, Wong CT, Pappas NR, Netusil N, Zhu W, Felder C, Ma Y. Alcohol intoxication induces greater reductions in brain metabolism in male than in female subjects. Alcohol Clin Exp Res. 2003;27:909–917. doi: 10.1097/01.ALC.0000071740.56375.BA. [DOI] [PubMed] [Google Scholar]
- Wilkinson L, Hill M, Vang E. SYSTAT: Statistics, Version 5.2 Edition. SYSTAT, Inc; Evanston, IL: 1992. [Google Scholar]
- Willars GB. Mammalian RGS proteins: multifunctional regulators of cellular signalling. Semin Cell Dev Biol. 2006;17:363–376. doi: 10.1016/j.semcdb.2006.03.005. [DOI] [PubMed] [Google Scholar]
- Zachariou V, Renthal W, Gold SJ, Young KH, Su J, Rahman Z, Howland D, Ring R, Han M, Nestler EJ. RGS4 modulates morphine reward and depndence. Society for Neuroscience Abstract. 2006:742. [Google Scholar]
- Zachariou V, Georgescu D, Sanchez N, Rahman Z, DiLeone R, Berton O, Neve RL, Sim-Selley LJ, Selley DE, Gold SJ, Nestler EJ. Essential role for RGS9 in opiate action. Proc Natl Acad Sci U S A. 2003;100:13656–13661. doi: 10.1073/pnas.2232594100. [DOI] [PMC free article] [PubMed] [Google Scholar]
- Zhang F, St Clair D, Liu X, Sun X, Sham PC, Crombie C, Ma X, Wang Q, Meng H, Deng W, Yates P, Hu X, Walker N, Murray RM, Collier DA, Li T. Association analysis of the RGS4 gene in Han Chinese and Scottish populations with schizophrenia. Genes Brain Behav. 2005;4:444–448. doi: 10.1111/j.1601-183X.2005.00167.x. [DOI] [PubMed] [Google Scholar]