

Abstract
Spo0A-phosphate is essential for the initiation of cellular differentiation and developmental processes in Gram-positive spore-forming bacteria. Here we combined comparative genomics with analyses of microarray expression profiles to identify the Spo0A-phosphate regulon in Bacillus subtilis. The consensus Spo0A-phosphate DNA-binding motif identified from the training set based on different computational algorithms is an 8 bp sequence, TTGTCGAA. The same motif was identified by aligning the upstream regulatory sequences of spo0A-dependent genes obtained from the expression profile of Sad67 (a constitutively active form of Spo0A) and their orthologs. After the transcription units (TUs) having putative Spo0A-phosphate binding sites were obtained, conservation of regulons among the genomes of B.subtilis, Bacillus halodurans and Bacillus anthracis, and expression profiles were employed to identify the most confident predictions. Besides genes already known to be directly under the control of Spo0A-phosphate, 276 novel members (organized in 109 TUs) of the Spo0A-phosphate regulon in B.subtilis are predicted in this study. The sensitivity and specificity of our predictions are estimated based on known sites and combinations of different types of evidence. Further characterization of the novel candidates will provide information towards understanding the role of Spo0A-phosphate in the sporulation process, as well as the entire genetic network governing cellular differentiation and developmental processes in B.subtilis.
INTRODUCTION
To adapt to changes in the environment during the transition from exponential to stationary growth phase, Bacillus subtilis has evolved a well tuned adaptive system. At this stage, regulons functioning in genetic competence (1), cell motility (2), antibiotic production (3), synthesis of degradative enzymes (4) and sporulation (5) are induced. It has been demonstrated that these different developmental responses are interconnected and they are co-regulated by a highly sophisticated transcriptional network (6–9). One major issue in deciphering the complete regulatory network is to dissect the complex network into single regulons that are groups of genes distributed over the whole genome controlled by a single transcription factor (9).
The focus of this study is on the sporulation regulon in B.subtilis. Sporulation of B.subtilis cells is the ultimate bacterial adaptive response to nutritional stress and involves the differential development of two cells, mother and daughter. Entry into sporulation in B.subtilis is dependent upon a signal transduction mechanism that ultimately results in the transfer of a phosphate group from ATP to the regulatory protein Spo0A (10). Activated Spo0A (Spo0A-phosphate) then binds to its operator site(s) located in the promoter regions of its target genes (operons). Among the targets of Spo0A-phosphate are the transcription units (TUs) spoIIA, spoIIE and spoIIG involved in the activation of alternative sigma factors σF and σE which in turn direct the transcription of genes functioning in daughter and mother cells, respectively (11,12). Spo0A-phosphate also regulates the transcription of abrB and sinI-R operons encoding the transition state regulators, which regulate the transcription of a large set of genes (13,14). The overall importance of Spo0A-phosphate as a global regulator of transcription is highlighted by microarray experiments, revealing that ∼14.3% of all ORFs in the B.subtilis genome have transcript levels at least 3-fold dependent on the spo0A allele during the early to middle sporulation process (15). However, only 10 TUs (14 genes) out of 585 spo0A-dependent genes were previously recognized as being directly spo0A dependent (16).
Thanks to the development of microarray techniques and computational methods, the rate of regulon discovery has been greatly accelerated in the past few years. In B.subtilis, transcriptional profiling of many important transcriptional factors controlling various cellular developments has been performed, including the key competence transcription factor ComK (17,18), the essential sporulation regulator, Spo0A (15), the stress response sigma factor σB (19), the alternative sigma factors functioning in the establishment of sporulation, σE and σH (20,21), a pleotropical repressor CodY (22) and 16 two-component regulators (23,24). Although clustering of microarray data has provided a high throughput technology for identifying co-regulated genes (25,26), the small number of experimental time points and conditions in most B.subtilis microarray data sets make it difficult to distinguish direct from indirect effects on transcript levels. To deal with the difficulties, we combined the analysis of expression profiles with a comparative genomics approach in this study.
The simple premise underlying the comparative genomics approach to DNA motif discovery is that selective pressure causes functional elements to evolve at a slower rate than non-functional sequences (27). Thus, binding sites for a given transcription factor stand out in the relative non-conserved (compared with the coding regions) upstream regions of orthologous genes (28). This approach is now widely used to identify cis regulatory elements in eukaryotic genomes (27,29,30). In bacteria, several groups employed a similar strategy to define regulons (31–34). Here, besides looking for binding sites at the upstream regions of TUs for a given genome, conservation of regulon gene content was also considered. By this approach, the assignment of a gene to a regulon is reinforced if the gene itself and its orthologs in other genomes all have DNA binding sites in the upstream regulatory regions of their respective TUs. To assess the degree of conservation we used all three complete Bacillus genomes, B.subtilis, Bacillus halodurans and Bacillus anthracis for our comparative analysis. Bacillus halodurans is quite similar to B.subtilis in terms of genome size and organization, G+C content and general taxonomic properties (35,36), but B.anthracis is more closely related to an opportunistic pathogen, Bacillus cereus (37), which is distantly related to B.subtilis. It is expected that results derived from three pair-wise comparisons will be more informative.
Our overall procedure to predict the Spo0A-phosphate regulon is as follows (see Fig. 1). The first step is to generate a weight matrix model of the Spo0A-phosphate binding sites from the combined set of previously known Spo0A- phosphate-dependent genes and newly identified ones from microarray profiling, also using their orthologs in other Bacillus species. Since all documented Spo0A-phosphate binding sites are located in the upstream regulatory region of a TU, the second step is to predict the TUs in the genomes of B.subtilis, B.anthracis and B.halodurans. In this study, a TU is defined as a continuous series of genes on the same strand with an intergenic distance not exceeding 80 nt. This criterion is based on our current knowledge about the intergenic distance for genes within TUs in B.subtilis (20). Next, the weight matrix was applied to scan the upstream sequences of all TUs in B.subtilis, B.anthracis and B.halodurans to search for potential binding sites of Spo0A-phosphate. The cut-off score separating the putative binding sites from the background sequences was computed based on the analysis of score distributions of binding sites in the genome. At this stage, we had a set of TUs controlled by a set of putative sites for all three genomes. We also have mRNA measurements for B.subtilis that identifies genes whose expression is at least 3-fold dependent on Spo0A-phosphate (15). While that dependence could be direct or indirect, if there is also a strong putative binding site for Spo0A-phosphate we can expect that the regulation is direct. Furthermore, if strong putative binding sites in B.subtilis are conserved in the other Bacillus species, we also expect that those genes will be regulated. In those genes that contain all types of evidence, a strong putative site which is conserved in the other Bacillus species and a 3-fold or greater dependence on Spo0A-phosphate, we can be quite confident of direct regulation.
Figure 1.

Flow chart depicting the whole procedure for predicting new members of the Spo0A-phosphate regulon in B.subtilis.
MATERIALS AND METHODS
Data sets and genomic sequences
The complete genomic sequences of B.anthracis (37), B.subtilis (35), B.halodurans (36) and Clostridium acetobutylicum (38) with their annotation files were obtained from GenBank (39). The unannotated contig sequences of Bacillus stearothermophilus were downloaded from ftp://ftp. genome.ou.edu/pub/bstearo. Bacillus subtilis genes whose transcript levels are 3-fold dependent on the spo0A allele were extracted from the database accompanying the paper by Fawcett et al. (15).
Identification of Spo0A-phosphate DNA-binding motif
Preparation of training set I. We collected 10 genes (TUs) known to be directly regulated by Spo0A-phosphate in B.subtilis. Orthologs of these 10 genes in the genomes of B.halodurans, B.anthracis and B.stearothermophilus were identified by BLAST search. In total seven orthologs in B.halodurans, five orthologs in B.anthracis and seven orthologs in B.stearothermophilus were obtained by BLAST search. The upstream sequences of previously known spo0A directly controlled genes (10 genes with 11 promoters) in B.subtilis, Bacillus thuringiensis (one gene), Bacillus megaterium (two genes) and Bacillus licheniformis (one gene) were collected from the literature. The upstream sequences of their orthologs in B.halodurans, B.anthracis and B.stearothermophilus were extracted from genomic or contig sequences. In total, 34 sequences were prepared as training set I. The length of these sequences range from 200 to 400 nt.
Preparation of training set II. Training set II was prepared by on-line database search using the query of 3-fold expression dependency on Sad67 at 15, 30 and 60 min (15). We obtained 13 genes (ykaA, spoIIGA, yneE, spo0A, sinI, yqzD, yuxH, yukF, yvyE, narQ, ywcI, yxzC and abrB). This is based on two considerations: first, the earlier the expression of a gene is changed by the induction of IPTG (15 min), the more likely it is under the direct control of spo0A; secondly, the resulting genes obtained at the 15 min time point are more reliable if their expressions are consistent across the other two time points (30 and 60 min). Four (spoIIGA, spo0A, sinI and abrB) out of the above 13 genes overlapped with those in training set I, they were discarded from training set II to avoid dependence between the two training sets. In addition, yxzC was also removed from training set II because it is not the leader gene of the TU as the other eight genes are. Therefore, training set II was created by collecting the upstream sequences (400 nt from the translation start) of the resulting eight genes and their corresponding orthologs in B.halodurans, B.anthracis and B.stearothermophlius. In total, 18 sequences were prepared as training set II.
Combined set used for identifying the final weight matrix of Spo0A-phosphate binding motif
A combined training set was generated by combining training set I and II. However, two sequences in training set I (B.anthracis spoIIGA and B.licheniformis spoIIAA) and one sequence in training set II (yukF) together with its orthologs were removed due to very low scoring binding sites in these sequences. Based on the initial training sets, these genes did not appear to have sites that matched the spo0A-phosphate pattern, at least within the region used in our analysis, and so were eliminated from the combined training set. The combined set contained 42 sequences (Table 1).
Table 1. Combined set sequences for generating the Spo0A-phosphate positional weight matrix, including regulatory sequences upstream from the translation start site of known spo0A directly controlled genes in B.subtilis and orthologous genes in other Bacillus species.
| Gene | Species | Binding site | Position | Score |
|---|---|---|---|---|
| abrBI | B.subtilis | ttgtcgaa | –59 | 9.93 |
| dltAI | B.subtilis | ttgtcgaa | –198 | 9.93 |
| kinAI | B.subtilis | atgtcgaa | –37 | 8.82 |
| kinCI | B.subtilis | ttgtcgaa | –51 | 9.93 |
| narQII | B.subtilis | ttgtcgaa | –55 | 9.93 |
| sinII | B.subtilis | atgtcgaa | –163 | 8.82 |
| spo0A-p1I | B.subtilis | ttgtcgaa | –182 | 9.93 |
| spo0A-p2I | B.subtilis | ttgtcgaa | –61 | 9.93 |
| spo0FI | B.subtilis | ttgacgaa | –29 | 7.43 |
| spoIIEI | B.subtilis | ttgtcaaa | –63 | 7.87 |
| spoIIGAI | B.subtilis | ttgtcgag | –130 | 7.35 |
| ykaAII | B.subtilis | ttgtcgaa | –56 | 9.93 |
| yneEII | B.subtilis | ttgtcgga | –99 | 6.75 |
| yqzDII | B.subtilis | atgtcgaa | –247 | 8.82 |
| yuxHII | B.subtilis | ttgacgaa | –54 | 7.43 |
| yvyEII | B.subtilis | atgtcgaa | –154 | 8.82 |
| ywcIII | B.subtilis | ttgttgaa | –200 | 6.00 |
| abrBI | B.halodurans | atgtcgaa | –59 | 8.82 |
| BH2351 (yneE ortholog)II | B.halodurans | ttgtcgaa | –91 | 9.93 |
| BH3630 (yvyE ortholog)II | B.halodurans | atgtcgaa | –242 | 8.82 |
| kinCI | B.halodurans | atgtcaaa | –118 | 6.76 |
| spo0AI | B.halodurans | ttgtcgaa | –112 | 9.93 |
| spo0FI | B.halodurans | ttctcgaa | –150 | 6.37 |
| spoIIEI | B.halodurans | ttgtcaaa | –60 | 7.87 |
| spoIIGAI | B.halodurans | ttgtcaaa | –30 | 7.87 |
| abrBI | B.stearothermophilus | ttgtcgaa | –58 | 9.93 |
| kinCI | B.stearothermophilus | ttttcgaa | –131 | 6.04 |
| spo0AI | B.stearothermophilus | ttgtcgaa | –158 | 9.93 |
| spo0AI | B.stearothermophilus | ttgtcgaa | –66 | 9.93 |
| spo0FI | B.stearothermophilus | ttgtcgca | –11 | 6.75 |
| spoIIEI | B.stearothermophilus | acgtcgaa | –98 | 5.64 |
| spoIIGAI | B.stearothermophilus | ttgtcaaa | –112 | 7.87 |
| ykaAII | B.stearothermophilus | ttgtcgaa | –110 | 9.93 |
| yvyEII | B.stearothermophilus | ttgtcgaa | –137 | 9.93 |
| abrBI | B.anthracis | ttgtcaaa | –67 | 7.87 |
| spo0AI | B.anthracis | ttgtcgaa | –74 | 9.93 |
| spo0FI | B.anthracis | ttgacgaa | –338 | 7.43 |
| ykaAII | B.anthracis | ttatcgaa | –312 | 6.04 |
| yvyEII | B.anthracis | ttgtcgag | –126 | 7.35 |
| spo0AI | B.megaterium | ttgtcgaa | –81 | 9.93 |
| spoIIGAI | B.megaterium | atgtcgaa | –179 | 8.82 |
| spo0AI | B.thuringiensis | ttgtcgaa | –71 | 9.93 |
Genes that are initially from training set I and training set II are labeled with I and II, respectively.
Motif-finding programs
The Spo0A-phosphate binding motif was identified by running the motif finding programs CONSENSUS (version 6c) (40), WCONSENSUS and ANN-Spec on the three sets of sequences (training sets I and II, and combined sets). CONSENSUS uses a greedy algorithm to find the most significant local multiple alignment in a set of sequences. From each multiple alignment a score called information content (Iseq) can be calculated:
![]()
where j is the position within the site, L is the length of the site, b refers to one of the four bases, and fbj is the observed frequency of each base at that position, and pb is the a priori probability of the individual bases. In this study, pA, pT, pC and pG were set to 0.3, 0.3, 0.2 and 0.2, respectively, since the GC contents in non-coding regions of the B.subtilis and B.halodurans genomes are 39.8 and 39.3%, respectively (36). The statistical significance of an alignment having some information content can be determined and used to rank alignments with different lengths, number of sequences and site symmetry. WCONSENSUS is a variant of CONSENSUS capable of identifying a DNA motif without prior knowledge of the length of the motif.
ANN-Spec (version 1.0) uses the Gibbs sampling algorithm to find the multiple alignment that best distinguishes the difference between a positive sequence set from a background sequence set (41). The background sequences were prepared by collecting the upstream regions of 400 randomly selected TUs from the B.subtilis genome. Motif lengths from seven to 16 were tried in which both single and double strands of DNA were searched for DNA binding motifs. Because of the non-deterministic nature of the algorithm, multiple training runs are performed (100), with each run iterating 1000 times. The results were sorted by their best attained objective function values (best energy). The weight matrix having the highest score for a given length was recognized as the most significant one.
Search Spo0A-phosphate binding sites in genomes
The program PATSER (version 3b) (40) was used to search Spo0A-phosphate binding sites in the genomes of B.subtilis, B.halodurans and B.anthracis using the final weight matrix we identified. PATSER scores every l-mer in a DNA sequence given a weight matrix of length l. The score of the l-mer, S, is the sum of the respective positional weights (42):
![]()
where W(b, j) is the weight for base b at position j, and f(b, j) is the frequency of b at position j; for a specific sequence it is either 1 or 0.
Because all known Spo0A binding sites occur in the regulatory regions of TUs, the putative regulatory regions in each genome were generated by taking 400 nt upstream from the translation start site of the leading gene of each TU. The cut-off score for putative Spo0A-phosphate binding sites was determined by comparing distributions of binding site scores and background sequence scores as described in the text.
Identification of orthologs between two genomes
Genes which diverged because of speciation events are called orthologs (43). Orthologous genes between B.subtilis and B.halodurans, between B.subtilis and B.anthracis, and between B.subtilis and C.acetyobutylicum were identified by comparing the complete set of protein sequences from each of the two species using gapped BLASTP (44). In this research, orthologous genes between two genomes were identified using criteria described previously (34,45): (i) sequence similarities between two ORFs should be statistically significant. Any alignment with a BLASTP E-value of 1e–15 was considered statistically significant; (ii) sequence similarity should extend to at least 60% of one of the ORFs; (iii) two ORFs from different genomes have the highest similarity reciprocally.
Calculation of the expected number of TUs in the Venn diagram
The expected number (OPexp_conservation) of TUs from two genomes that share at least one gene, given n1 and n2 TUs in each genome that have putative binding sites at their upstream regions, can be calculated by the following formula:
OPexp_conservation = n1 ∗ n2 ∗ O / N1 ∗ N2
where O is the total number of TUs that share at least one gene between two genomes and N1 and N2 are the total numbers of TUs in each genome. The value of O for B.subtilis and B.anthracis is 1309 and 1154 for B.subtilis and B.halodurans. The total numbers of TUs are 2395, 2425 and 3430 for B.subtilis, B.halodurans and B.anthracis, respectively.
The expected number of TUs (OPexp_expression) in B.subtilis whose transcript levels are 3-fold dependent on spo0A and having putative spo0A-phosphate binding sites can be calculated as follows:
OPexp_expression = n ∗ m / N
where n is the number of TUs that have putative binding sites, m is the number of TUs in the B.subtilis genome that are at least 3-fold dependent on spo0A, and N is the total number of TUs in B.subtilis. To get the value of m, we first extracted all spo0A-dependent genes identified by microarray experiments from the database accompanying the paper by Fawcett et al. (15). To maintain consistency with the analyses done by these authors, we used at least 3-fold expression level change as the query criteria to search both expression profiles of Spo0A and Sad67 and we obtained 734 genes. We then mapped these 734 genes to their corresponding TUs, giving us 555 TUs.
The overlapped parts of the expected Venn diagram can be calculated by multiplying the total expected number in one evidence category and the frequency of overlapping between the evidence categories. For instance, the expected number of B.subtilis TUs that are shared with B.halodurans and having their transcript levels at least 3-fold dependent on spo0A can be calculated as: 17.6 ∗ Eoverlap = 4.1 where 17.6 is the expected number of TUs conserved between B.subtilis and B.halodurans and having putative Spo0A-phosphate binding sites, and Eoverlap is the frequency of overlapping between the two evidence categories, which is 555/2395.
Other programs
Sequence logos were constructed using the MAKELOGO program (46). Multiple alignments of protein sequences were constructed using the program CLUSTALX (47). The rest of the analysis was performed by using ad hoc PERL (48) scripts.
RESULTS
Structure of Spo0A and conservation in the DNA binding domain
Spo0A consists of two domains of similar size, an N-terminal phosphoacceptor domain (Spo0AN) and a C-terminal effector domain (Spo0AC). At the heart of the regulatory network controlling the sporulation process is the phosphorylation of Spo0A. Phosphorylation occurring at the N-terminal receiver domain switches on the transcription activation function residing in the C-terminal effector domain (49). The crystal structures of Spo0AN, Spo0AN-phosphate (phosphorylated Spo0AN) and Spo0AC from B.sterothermophilus have been reported (50), revealing that Spo0AC contains a helix–turn–helix (HTH) DNA-binding domain (51). The co-crystal structure of the Spo0AC from B.subtilis with its DNA target was recently solved at 2.3 Å resolution (52). The structure revealed that two molecules of Spo0AC form a tandem dimer upon binding to adjacent ‘0A’ boxes (5′-TGNCGAA-3′). The following amino acid residues have been shown to participate in sequence-specific recognition of the DNA target: R214, R217 and E213. Figure 2 shows a multiple sequence alignment of the DNA binding motif of Spo0A from six Bacillus species and two Clostridium species. The alignment shows that the entire DNA binding motif of Spo0A is highly conserved across species, and the amino acid residues responsible for binding specificity are strictly identical in all eight species. This high degree of sequence conservation implies a conserved recognition pattern for Spo0A-phosphate binding to its operators.
Figure 2.

Multiple sequence alignment of Spo0A proteins from endospore-forming bacteria. Only sequences around the HTH DNA binding domain are shown. Amino acid residues (E213, R214, R217) involved in base-specific contacts are highlighted. The HTH motif is indicated under the alignment. Bacillus megaterium Spo0A is a partial sequence obtained from published literature.
Identification of the Spo0A-phosphate DNA binding motif
The Spo0A DNA binding motif was initially determined ‘by eye’ through the alignment of Spo0A binding sites. The consensus motif, termed ‘0A-box’, was reported as a 7 nt sequence of 5′-TGNCGAA-3′(14) and 5′-TGTCGAA-3′ (12). Unlike the recognition sites of restriction endonucleases, consensus words usually do not accurately represent the binding specificity of transcription factors. Some positions in the motif will be more conserved than others and preference for each of the four bases can be different at each position. A more accurate representation of DNA binding sites is a 4 × L weight matrix for an L long DNA motif (42). Several algorithms have previously been developed for motif finding given multiple sequences including CONSENSUS (40), ANN-Spec (41), Gibbs sampler (53) and MEME (54).
Traditionally, one starts by collecting known upstream regulatory sequences of co-regulated genes and employing motif discovery algorithms to identify the common cis regulatory motif. Although a large number of DNA footprinted Spo0A sites are available (16), we did not use them to generate the weight matrix model for the Spo0A-phosphate binding motif because most of the footprinting experiments were performed with unphosphorylated Spo0A (11,13,14,55–58) and we were not sure if the binding pattern would be the same for Spo0A-phosphate. Instead, we generated two training sets from which to determine the binding site pattern of Spo0A-phosphate. Training set I is a collection of upstream regions of 10 spo0A directly dependent genes (11 sequences) in B.subtilis and 23 orthologs in six other Bacillus species (see Materials and Methods). In addition, we identified a set of eight novel spo0A directly dependent genes based on the analysis of a microarray data set (see Materials and Methods). In total, 18 upstream sequences from these eight genes and their orthologs (see Materials and Methods) were used as training set II. Having these two sets of training sequences allows us to check the consistency of the motif model for Spo0A-phosphate binding sites.
We used three computer programs to identify the Spo0A-phosphate binding motif from our training set I and training set II: CONSENSUS, WCONSENSUS and ANN-Spec. CONSENSUS was designed to find an ungapped local alignment from multiple sequences using a greedy algorithm (40,59). WCONSENSUS is a variant of CONSENSUS capable of identifying an alignment without prior knowledge of its length. Both programs can calculate the statistical significance of an alignment and report it as the E-value. Both strands were considered and the motif length was varied from 7 to 18 nt while running CONSENSUS. The most significant motifs identified from training set I were a 12 nt sequence TTTGTCGAANAA (E = 2.12 × 10⁻²¹) by CONSENSUS, and a 9 nt sequence TTTGTCGAA (E = 3.42 × 10⁻²⁰) by WCONSENSUS.
After multiple training runs of the program ANN-Spec, the most significant motif for a given length was identified by their best objective function values (best energy values). We obtained a series of the most significant motifs with different lengths from training set I. They all share a core consensus motif and the shortest most significant motif is a 7 nt sequence TGTCGAA. However, no E-value is calculated by ANN-Spec that allows us to compare the statistical significance of motifs with different lengths.
Combining the results of all three programs, we consider the 8 nt sequence (TTGTCGAA) as the Spo0A-phosphate binding motif (Fig. 3A), the length of 8 nt was actually verified by search results using the program PhyloCon newly developed by Wang and Stormo (60). As an independent confirmation, this motif (Fig. 3B) was also identified as the most significant motif in our training set II. Therefore, the final weight matrix used to identify Spo0A-phosphate binding sites in our study was generated from the combined set of sequences. Sequence data in the combined set are shown in Table 1. Parameters of the final weight matrix are shown in Table 2 and its sequence logo is presented in Figure 3C.
Figure 3.
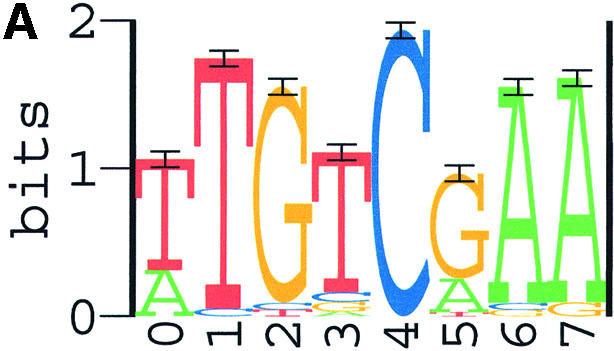
Sequence logos for the Spo0A-phosphate DNA binding motifs identified with ANN-Spec. (A) The most significant motif from training set I; (B) the most significant motif from training set II; (C) the most significant motif from the combined set. Horizontal axis, position in the binding motif; vertical axis, information content in bits. The height of each letter is proportional to its prevalence at the given position. Score unit: nat, natural logarithm of information content.
Table 2. Positional weight matrix for the Spo0A-phosphate DNA binding motif.
| A | C | G | T | Consensus |
|---|---|---|---|---|
| –0.20 | –3.83 | –3.83 | 0.91 | T |
| –2.36 | –2.04 | –3.83 | 1.14 | T |
| –2.36 | –2.04 | 1.52 | –2.36 | G |
| –1.43 | –3.83 | –1.43 | 1.07 | T |
| –3.83 | 1.57 | –3.83 | –2.36 | C |
| –0.64 | –3.83 | 1.42 | –3.83 | G |
| 1.14 | –2.04 | –2.04 | –3.83 | A |
| 1.14 | –3.83 | –1.43 | –3.83 | A |
Consensus sequence for the binding motif is shown in the rightmost column. Score unit: nat.
Score distribution of binding sites and determination of cut-off score
The final weight matrix was used by the program PATSER to scan the upstream regions of TUs in the genomes of B.subtilis, B.anthracis and B.halodurans to find potential Spo0A- phosphate binding sites. PATSER (version 3b) (40) allows one to score a DNA sequence of length l against a weight matrix. When scanning both strands of all upstream regulatory regions in a genome, we have a total of 2 ∗ N ∗ (L – l + 1) scores, where N is the number of TUs in each genome, L is the length of the upstream region of each TU, and l is the length of the weight matrix (DNA motif). Since the specific binding sites of Spo0A-phosphate in each genome are only a small fraction of all 2 ∗ N ∗ (L – l + 1) possible sites, we determined the cut-off score separating the binding sites from the large number of background sequences. The method applied in this study is based on the analysis of score distributions of binding sites and background sequences. Specifically, all sites in a genome were divided into two subsets given a moving test cut-off. Background sequences have scores lower than the test cut-off and putative binding sites above the test cut-off. The final cut-off score is reached when the average score of the putative binding sites equals the average score of the combined training set.
In this study, the test cut-off was gradually increased from 1 to 9 nats (natural logarithm of information content). The resulting average scores of the putative binding sites given a test cut-off and the numbers of these sites are shown in Table 3. When the test cut-off was increased to 7.35, the average scores of binding sites in B.subtilis and B.halodurans are 8.24 and 8.21, respectively, which are very close to the average score (8.36) of the combined set (Table 1). Therefore, 7.35 was chosen as the cut-off score for Spo0A-phosphate binding sites. The score distributions of all 8mers (background plus binding sites) and top scores for all TUs in B.subtilis are approximately normal with means of –13.10 and 4.75 nats, respectively (Fig. 4), indicating that most 8mers in the genomes are recognized as background by the Spo0A-phosphate weight matrix. Similar score distributions of all sites and top-scoring sites for all TUs were also observed in both B.anthracis and B.halodurans (data not shown). The combined training set has a mean and standard deviation (SD) of 8.36 ± 1.45 nats (Fig. 4). Using the cut-off of 7.35, two of the 17 B.subtilis sites in the combined set (Table 1) are missed, leaving a maximum sensitivity of 0.88.
Table 3. Average scores of all sites in the upstream regions of all TUs.
| 1 | 2 | 3 | 4 | 5 | 6 | 6.75 | 7.35 | 7.5 | 8 | 9 | ||
|---|---|---|---|---|---|---|---|---|---|---|---|---|
| Bacillus subtilis | a | 2.70 | 3.60 | 4.63 | 5.54 | 6.50 | 7.16 | 7.96 | 8.24 | 8.72 | 9.55 | 9.93 |
| B | 13817 | 8214 | 4290 | 2278 | 1162 | 715 | 371 | 299 | 190 | 96 | 63 | |
| Bacillus halodurans | A | 2.76 | 3.69 | 4.73 | 5.57 | 6.51 | 7.09 | 8.00 | 8.21 | 8.69 | 9.55 | 9.93 |
| B | 14940 | 8916 | 4796 | 2732 | 1424 | 918 | 425 | 364 | 227 | 111 | 73 |
A, average scores of the set of putative sites above the moving test cut-off; B, the number of sites in the set defined in A. Score unit: nat.
Figure 4.

Distribution of site scores. (Squares) All 8mer scores in the upstream regions of all TUs in B.subtilis; (triangles) top scores in the upstream regions of all TUs in B.subtilis; (diamonds) top scores in the combined training set. The frequency of the training set scores was multiplied by 20 for presentation purposes.
Identifying the Spo0A-phosphate regulons
The sets of upstream regulatory sequences of all TUs in B.subtilis, B.anthracis and B.halodurans were scanned by PATSER using the final weight matrix. Using the cut-off score described above, we identified 273, 337 and 328 TUs in B.subtilis, B.anthracis and B.halodurans, respectively. The total number of TUs in each species, as estimated by the procedure of Eichenberger et al. (20), are 2395, 3430 and 2425 in B.subtilis, B.anthracis and B.halodurans, respectively. So, using the cut-off of 7.35 for putative sites, the fractions of TUs predicted to be controlled by Spo0A-phosphate by the weight matrix alone are between 9.8 and 13.5%, with B.subtilis in between at 11.4%. However, we do not expect these predictions to be especially accurate on their own. Two of the known regulatory sites in the combined set are missed by using this threshold, which tells us that our predictions have some false negatives. We also expect false positives because weight matrices obtained from a small, and probably biased, sample are not completely accurate. Even if the matrix gave a true representation of the binding specificity of the protein, there may be true binding sites that are not involved in gene regulation for other reasons, such as inappropriate location relative to the promoters. In order to improve the reliability of the predictions, we include additional information, specifically the measurement of gene expression dependent on Spo0A-phosphate (15) and the conservation of predicted binding sites in other Bacillus species. While expression changes may be due to Spo0A-phosphate directly or indirectly, the occurrence of high scoring predicted sites increases the likelihood that the regulation is direct. Occurrences of high scoring predicted sites can occur by chance, but their association with regulated genes and the conservation in other species indicate that they are likely to be involved in gene regulation.
Table 4 lists all of the genes in each TU with a predicted site above the cut-off of 7.35 that meets one or more of the above criteria. There are a total of 121 TUs in the list, containing 288 genes. Figure 5 shows the distribution by the different types of evidence and also shows the expected number in each category if the observations were each independent (see Materials and Methods for details of the calculation). Using the criterion of expression level being at least 3-fold dependent on Spo0A-phosphate, 555 (23.2%) of the TUs have at least one gene above that threshold. However, the added requirement of a predicted binding site reduces the number of TUs to 89. However, given the large number of TUs meeting each criterion alone (11.4 and 23.2%), one would expect ∼63 TUs to meet both criteria even if expression was unrelated to predicted binding sites. So, the 89 TUs probably contain some, perhaps many, false positives. The number of TUs with predicted binding sites that contain genes orthologous to those in B.anthracis or B.halodurans that also have predicted sites are 32 and 33, respectively. If the conservation was by chance, the expected numbers would be ∼15 and 18, respectively, so those probably also contain some false positives. However, as the different types of evidence are merged the number expected to occur by chance decreases faster than the observed numbers. Essentially, zero TUs would be expected to have a predicted binding site that is conserved in both species and contains genes that are regulated by a factor of 3. We observed seven such TUs, containing a total of 21 genes, many of which have unknown functions (Table 4). In the subsets with two types of evidence the observed set of genes also exceeds the expected by ∼2-fold or more, so that most of them are likely to be true positives. Only for the genes with one type of evidence does the expected number come close to the observed number, and therefore those may be largely false positives. Because we have no way of distinguishing the true positives from the false positives, Table 4 contains the complete list of all TUs that meet any of the combined criteria, but those with only one type of evidence should be considered highly tentative.
Table 4. Genes in B.subtilis predicted to be members of the Spo0A-phosphate regulon, including both known and new members.
| TU | Evidence | Functions of genes in TU | Position | Score |
|---|---|---|---|---|
| abrB*† | a, b, c | Transcriptional pleiotropic regulator of transition state genes | –59 | 9.93 |
| divIVA* | a, b, c | Cell-division initiation protein | –359 | 8.82 |
| spo0A*† | a, b, c | Two-component response regulator central for the initiation of sporulation | –182c, –166, –61 | 9.93, 7.87, 9.93 |
| ypjD-dapB-ypjFG*H-papS-birA | a, b, c | Unknown; dihydrodipicolinate reductase, transcriptional repressor of the biotin operon | –56 | 7.87 |
| yqeGH-aroD-yqeIJK*LM | a, b, c | Unknown | –94, –36c | 9.93, 9.93 |
| yqhL* | a, b, c | Unknown | –75 | 9.93 |
| yvyE*†-yvhJ* | a, b, c | Unknown | –154 | 8.82 |
| spoIIE† | a, b | Serine phosphatase | –63c | 7.87 |
| valS-folC | a, b | Valyl-tRNA synthetase | –348 | 7.43 |
| yerQ | a, b | Unknown | –367 | 7.43 |
| yloI-priA-def-fmt-yloMNOPQRS-spoVM | a, b | Unknown | –391 | 8.82 |
| ypjC | a, b | Unknown | –307c | 7.87 |
| yvyD | a, b | Unknown | –99c | 9.93 |
| flgBC*-fliE*F*G* | a, c | Flagellar basal-body rod proteins | –42c | 7.35 |
| fruR*B*A | a, c | Transcriptional repressor of the fructose operon, fructose 1-phosphate kinase, PTS fructose-specific enzyme IIABC component | –170 | 9.93 |
| spoIIGA*†sigE* | a, c | Protease (processing of pro-sigma-E to active sigma-E), RNA polymerase sporulation mother cell-specific (early) sigma factor | –130c | 7.35 |
| yfkQRST* | a, c | Similar to spore germination response | –366, –222c | 7.35, 9.93 |
| yhbAB*-cspR-yhbDEF | a, c | Unknown | –120 | 7.43 |
| yttP* | a, c | Unknown | –132c | 8.82 |
| ywqC*D*E* | a, c | Unknown; similar to capsular polysaccharide biosynthesis | –95 | 8.82 |
| fbaA* | b, c | Fructose-1,6-bisphosphate aldolase | –340, –137 | 7.43, 9.93 |
| spo0F*† | b, c | Two-component response regulator involved in the initiation of sporulation | –29 | 7.43 |
| yfnA* | b, c | Unknown; similar to metabolite transporter | –64c | 9.93 |
| ylbQ-yllA* | b, c | Unknown; similar to 2-dehydropantoate 2-reductase | –383, –166 | 7.87, 7.87 |
| ylxY-ymxGH* | b, c | Unknown | –215 | 7.87 |
| yttI-accA* | b, c | Acetyl-CoA carboxylase (beta and alpha subunit) | –207, –176c | 9.93, 7.87 |
| ctrA | a | CTP synthetase | –347 | 7.43 |
| degS | a | Two-component sensor histidine kinase involved in degradative enzyme and competence regulation | –61c | 8.82 |
| spoVB | a | Involved in spore cortex synthesis (stage V sporulation) | –311c | 7.43 |
| topA-gid-codV-clpQY-codY | a | DNA topoisomerase I, glucose-inhibited division protein, site-specific integrase, two-component ATP-dependent protease, transcriptional pleiotropic repressor | –172c | 7.87 |
| yfkO | a | Similar to NAD(P)H-flavin oxidoreductase | –176c | 7.35 |
| ygaH-ygxA | a | Unknown | –194c | 8.82 |
| yhcWX | a | Unknown | –186 | 8.82 |
| yhdYZ | a | Unknown | –306c | 8.82 |
| yheM | a | Similar to D-alanine aminotransferase | –151 | 9.93 |
| yjlA | a | Unknown | –84c | 7.43 |
| ykuL | a | Unknown | –71c | 9.93 |
| yugGH | a | Similar to transcriptional regulator (Lrp/AsnC family) | –52c | 7.43 |
| ywbI-thiKC | a | Unknown | –356c | 8.82 |
| alsSD | b | Alpha-acetolactate synthase, alpha-acetolactate decarboxylase | –313c | 7.35 |
| dnaA | b | Initiation of chromosome replication | –141 | 9.93 |
| dnaBI-2635002-ytxC | b | Initiation of chromosome replication/membrane attachment protein, primosome component | –217 | 7.43 |
| ykuJ | b | Unknown | –241c | 7.87 |
| ymfC | b | Unknown; similar to transcriptional regulator (GntR family) | –63c | 9.93 |
| yodC | b | Unknown | –313c | 9.93 |
| ypoP | b | Unknown; similar to transcriptional regulator (MarR family) | –195c | 7.43 |
| yqhM | b | Unknown | –114c | 9.93 |
| yrkHIJ | b | Unknown | –398 | 7.87 |
| ysfE | b | Unknown | –28 | 8.82 |
| yusM | b | Unknown | –142 | 9.93 |
| yutLM | b | Unknown | –269c | 7.43 |
| ywiC | b | Unknown | –210c | 9.93 |
| addBA*-sbcD | c | ATP-dependent deoxyribonuclease (subunit B, A), exonuclease SbcD homolog | –45c | 7.43 |
| appD*F* | c | Oligopeptide ABC transporter | –25c | 7.87 |
| comFA*FBFC-yvyF | c | Late competence gene | –369c | 7.87 |
| ecsAB*C | c | ABC transporter | –265c, –162c | 7.87, 7.87 |
| fliK*-ylxG*-flgE* | c | Flagellar hook proteins | –253 | 7.43 |
| ftsE*X | c | Cell-division ATP binding protein, cell-division protein | –66 | 9.93 |
| gbsAB* | c | Glycine betaine aldehyde dehydrogenase, alcohol dehydrogenase | –342c | 7.43 |
| gerCACB*CC | c | Heptaprenyl diphosphate synthase | –270c | 7.35 |
| gspA* | c | General stress protein | –243 | 7.43 |
| hom*-thrCB | c | Homoserine dehydrogenase, threonine synthase, homoserine kinase | –105 | 7.87 |
| iolDEFG*H* | c | Myo-inositol catabolism | –79 | 9.93 |
| kinA*† | c | Two-component sensor histidine kinase involved in the initiation of sporulation | –37 | 8.82 |
| med*-yjzA | c | Positive regulator of comK, | –115c, –42 | 9.93, 7.87 |
| NarQ*†A* | c | Required for formate dehydrogenase activity | –55c | 9.93 |
| nasB*C | c | Assimilatory nitrate reductase | –13c | 7.43 |
| rbsR*K*D*A*C*B* | c | Transcriptional repressor of the ribose operon, ribokinase, ribose ABC transporters | –146 | 7.87 |
| sacV* | c | Transcriptional regulator of the levansucrase gene | –309 | 7.35 |
| sinI*†R | c | Antagonist of SinR, and SinR is transcriptional regulator of post-exponential-phase responses genes | –163c | 8.82 |
| spoIIAA*†-spoIIAB*-sigF* | c | Anti-anti-sigma factor, anti-sigma factor/serine kinase, RNA polymerase sporulation forespore-specific (early) sigma factor | –319 | 7.43 |
| spoIIB* | c | Spatial and temporal regulation of the dissolution of septal peptidoglycan during engulfment | –120 | 7.43 |
| spoVAA-VAB-VAC-VAD-VAE*-VAF | c | Mutants lead to the production of immature spores | –310c | 7.87 |
| spoVFA*-VFB | c | Dipicolinate synthase subunit B and A | –191c | 7.35 |
| xylA* | c | Xylose isomerase | –263c | 7.87 |
| xylR* | c | Transcriptional repressor of the xylose operon | –79 | 7.87 |
| ybcO*P*QST*-ybdA*BD* | c | Unknown | –76c | 9.93 |
| yceC*DE*F | c | Unknown | –130c | 7.43 |
| yczJ* | c | Unknown | –343 | 7.43 |
| ydcPQ*R* | c | Unknown | –325 | 7.43 |
| ydfL* | c | Unknown; similar to multidrug-efflux transporter regulator | –216c | 7.87 |
| ydhB* | c | Unknown | –68c | 7.43 |
| yerI* | c | Unknown | –256 | 8.82 |
| yfhK* | c | Unknown; similar to cell-division inhibitor | –27 | 7.87 |
| yfmH*G* | c | Unknown | –309 | 9.93 |
| yfmT*S* | c | Unknown; similar to benzaldehyde dehydrogenase, similar to methyl-accepting chemotaxis protein | –184 | 9.93 |
| ygaN* | c | Unknown | –126 | 7.87 |
| ygaO* | c | Unknown | –325c, –310 | 7.43, 9.93 |
| yhdX* | c | Unknown | –50c | 8.82 |
| yjcP*Q | c | Unknown | –64c | 9.93 |
| yjfC* | c | Unknown | –13c | 7.87 |
| ykaA*†B* | c | Unknown | –56c | 9.93 |
| yknW*X*Y*Z* | c | Unknown | –357 | 7.43 |
| ykuA* | c | Unknown | –302c | 7.87 |
| ykzF* | c | Unknown | –110 | 8.82 |
| ylqB* | c | Unknown | –93 | 7.87 |
| ylxM*-ffh | c | Unknown | –82c | 7.87 |
| yncM* | c | Unknown | –89 | 7.43 |
| yolA*B* | c | Unknown | –399 | 7.87 |
| yopT*, yopU | c | Unknown | –365c | 8.82 |
| yosB*CD*EFGHI*JK | c | Unknown | –70c | 8.82 |
| ypjA*B | c | Unknown | –134 | 7.87 |
| yppDE* | c | Unknown | –132 | 9.93 |
| yppF* | c | Unknown | –100 | 7.87 |
| ypvA* | c | Unknown; similar to methyl-accepting chemotaxis protein | –27 | 8.82 |
| yqaRST-yqbABCDEFG*HIJ | c | Unknown; similar to phage related protein | –62c | 9.93 |
| yqgTU*V | c | Unknown | –119c | 7.43 |
| yqzD*†C | c | Unknown | –247, –89c | 8.82, 7.35 |
| yraIJ* | c | Unknown | –80 | 9.93 |
| ythP*Q | c | Unknown | –380c | 7.43 |
| ytpAB* | c | Unknown | –369c | 7.43 |
| yusN* | c | Unknown | –209c | 9.93 |
| yuxH*† | c | Unknown | –54c | 7.43 |
| yvcE* | c | Unknown; similar to cell wall binding protein | –216 | 9.93 |
| yvfB*CDE | c | Unknown | –396 | 7.87 |
| yvfI* | c | Unknown; similar to transcriptional regulator (GntR family) | –7, –278c | 9.93, 7.87 |
| yvqI*H | c | Unknown | –264 | 9.93 |
| ywjG* | c | Unknown | –379c, –135c | 7.43, 7.43 |
| ywmB-murA* | c | Unknown | –68 | 7.43 |
| ywsC*-ywtABC | c | Unknown; similar to capsular polyglutamate biosynthesis | –12 | 8.82 |
| yydA* | c | Unknown | –364 | 9.93 |
Genes whose expression is 3-fold dependent on spo0A are labeled with a star, and genes from the combined training set are labeled with a dagger. Types of evidence for the predicted TUs are: a, conserved between B.subtilis and B.halodurans; b, conserved between B.subtilis and B.anthracis; c, transcript level at least 3-fold dependent on spo0A from microarray analysis. Locations of sites are relative to the translation start of the first downstream gene. In the ‘Position’ column, c indicates complementary strand. Score unit: nat. Functions of specific genes are obtained from the SubtiList Web Server (http://genolist.pasteur.fr/SubtiList/).
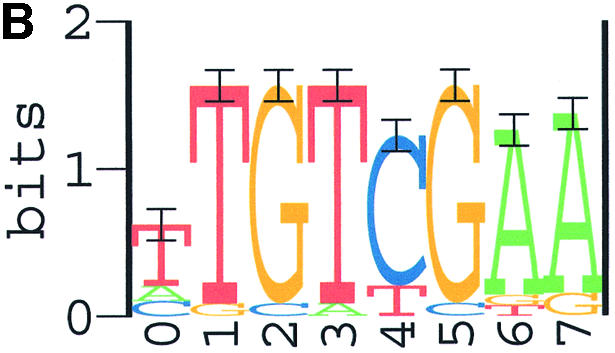
Figure 5.
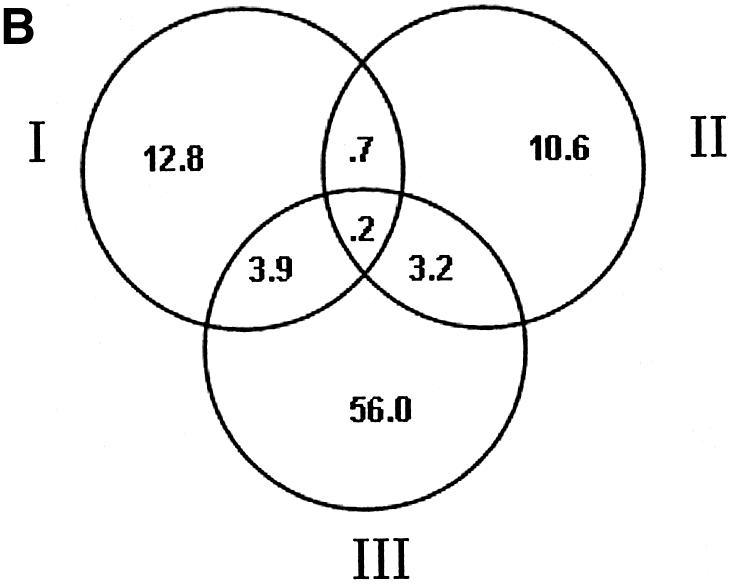
Venn diagrams showing observed and expected numbers of TUs in B.subtilis supported by different types of evidence. (A) The observed numbers of TUs. (B) The expected numbers of TUs. I, number of TUs conserved between B.subtilis and B.halodurans and having putative Spo0A-phosphate binding sites; II, number of TUs conserved between B.subtilis and B.anthracis and having putative Spo0A-phosphate binding sites; III, number of TUs in B.subtilis whose transcript levels are at least 3-fold dependent on spo0A and have putative Spo0A-phosphate binding sites.
DISCUSSION
We have carefully constructed a weight matrix model for the Spo0A-phosphate DNA binding sites. Since activation of Spo0A requires its phosphorylation (10) and most footprinting experiments were performed with unphosphorylated Spo0A (11,13,14,55–58), we did not use footprint results to obtain the binding motif of Spo0A-phosphate. Instead, two completely independent training sets were used in this study. The consistency of Spo0A-phosphate binding motifs obtained from these two training sets ensures that the motif identified here is reliable. Interestingly, this newly identified motif turns out to be very similar to that obtained based on footprinting experiments using unphosphorylated Spo0A (12,14). This tells us that phosphorylation of Spo0A does not really change its binding pattern although the phosphorylation process is required for the activity of Spo0A. At this moment we do not know how phosphorylation of Spo0A affects its activity.
It should be pointed out that in the co-crystal structure two molecules of Spo0AC were found to form a tandem dimer upon binding to a synthetic DNA template bearing two binding sites separated by 10 bases. This suggested that dimerization or formation of oligomers of phosphorylated Spo0A may be essential for the activation of spo0A-dependent genes (52). We calculated the number of Spo0A-phosphate binding sites in each of the 10 training set I sequences in B.subtilis. Only two regulatory genes, abrB and spo0A, had more than one binding site with a score >5.46 (2 SD below the average score of the combined set). The distance between adjacent binding sites in arbB was 10 nt, and that between adjacent binding sites in spo0A was 17, 24 and 88 bases, respectively. Therefore, we think that dimerization may be required for the activity of Spo0A, but binding of Spo0A-phosphate to promoters may not require more than one site. Formation of dimers or oligomers in the upstream regions of certain promoters that have two or more binding sites may affect the promoter strength.
We have predicted 288 members (organized into 121 TUs) of the Spo0A-phosphate regulon in B.subtilis by combining site prediction and comparative genomics with expression profile analysis. The 121 TUs include 12 of 16 from a combined training set of known Spo0A-phosphate regulated genes, indicating that the predicted set is still not the complete regulon. There are several reasons why a regulated gene might be missed by our procedure. The score of the predicted binding site may be below the cut-off, as with two of the training set genes. It is well known that the scores obtained from a small sample of binding sites are only approximate predictors of binding affinity, and we chose a cut-off that is a compromise between getting all of the known sites and predicting too many false positives. Regulated genes may not show up on the list of 3-fold dependent genes because those measurements are intrinsically noisy, especially for genes expressed at a low level or for which cross hybridization with other genes is a problem. Genes may not show up as being regulated in other species because regulons are not completely conserved through evolution. In fact, one additional gene missed from the combined training set, dltA, does not have recognizable orthologs in either B.anthracis or B.halodurans so that we cannot find it by that criterion. Other genes may be present but organization in TUs and their regulation may change during evolution (34,61).
The specificity of the predictions varies depending on the number of types of corroborating evidence. We expect that those TUs that are conserved in both additional species and show 3-fold dependence on Spo0A-phosphate are true predictions, several of which are novel. Those with two lines of corroborating evidence are probably mostly correct, but may contain some false predictions. Many of those with only one line of evidence may be false predictions but warrant further investigation. Among the genes predicted with only one line of evidence, those predicted from the conservation between species are probably the more reliable because the majority of the cross-species matches are supported by another line of evidence. The genes predicted only by the 3-fold expression dependence are probably less reliable because the majority of the genes so identified are not supported by additional lines of evidence. This is not too surprising because Spo0A-phosphate regulates several other transcription factors, and so has an indirect effect on the expression of many genes.
Although several groups have developed computational methods to predict bacterial TUs (62), it remains a difficult problem and further improvement would be useful. In this study, we adopted a simple approach by only considering the intergenic distance between two genes (<80 nt) in the same direction (20). Such a naïve approach seems to work well compared with other more complicated methods, but can lead to genes being inappropriately included or excluded from true TUs.
Although the most conspicuous phenotype of the spo0A null mutation is defective sporulation, many other aspects of post-exponential behavior are affected, including genetic competence, motility, antibiotic synthesis and the production of degradative enzymes (63), suggesting that the regulatory network controlling different development pathways is partially coordinated by Spo0A-phosphate. In the Spo0A- phosphate regulon, several genes are known to encode transcription factors including AbrB, SinR, two alternative sigma factors σE and σF, which direct the transcription of genes functioning in mother and daughter cells, as well as those newly identified putative members in this study. Further characterization of these regulators would provide the foundation for understanding the transcriptional regulatory network controlling cellular differentiation and development in B.subtilis. Very recently, the σE and the CodY regulons were characterized by two groups with different approaches (20,22). The σE regulon was characterized by a combined approach of microarray profiling and computational methods (20). The CodY regulon was analyzed by chromatin immunoprecipitation coupled with microarray profiling (22). Besides these regulon-by-regulon approaches to deciphering the entire network, one can start systematically modeling the entire regulatory network controlling cellular differentiation and development processes in B.subtilis by clustering integrated expression profiles in B.subtilis, incorporated with other computational approaches.
Although spore formation occurs in many other bacteria including Gram-positive bacteria Streptomyces, Clostridium and Gram-negative bacteria Myxococcus (64,65), B.subtilis Spo0A orthologs can only be identified in the members of the Gram-positive endospore-forming Bacillus/Clostridium group (66). The genus Clostridia are a diverse group of Gram-positive, anaerobic, spore-forming bacteria having considerable clinical and biotechnological importance. Mutation of the spo0A allele in C.acetobutylicum resulted in the loss of the sporulation phenotype associated with blockage of solvent biosynthesis, indicating that the B.subtilis spo0A ortholog plays an essential role in cellular sporulation and biosynthesis of solvents in C.acetobutylicum (66,67). We initially expected to identify candidates of the Spo0A-phosphate regulon in C.acetobutylicum by comparative genomics. Alignment of the DNA binding domain of Spo0A from C.acetobutylicum and other Bacillus species indicated that the amino acids for base-specific recognition are identical, suggesting that C.acetobutylicum Spo0A bind the same DNA motif as B.subtilis Spo0A. However, over half of the known spo0A-dependent genes in C.acetobutylicum do not have detectable strong Spo0A binding sites (scores more than the cut-off of 7.35), indicating that the regulons have changed significantly between the two species or that the weight matrix of B.subtilis Spo0A-phosphate is inapplicable to define C.acetobutylicm Spo0A binding sites, although they may share similar consensus sequences. In B.subtilis, Spo0A is activated by phosphorylation through a phosphorelay signal transduction pathway. However, the phosphorelay system in B.subtilis was lost in C.acetobutylicum (38). Whether and how the phosphorylation of Spo0A occurs in C.acetobutylicum remains to be clarified. In addition, many of the sporulation genes identified in B.subtilis are missing in C.acetobutylicum (38). Until these conflicting results can be explained, computational characterization of the Spo0A regulon in C.acetobutylicum remains a difficult task.
Acknowledgments
ACKNOWLEDGEMENTS
We wish to thank Ting Wang for assistance with the use of PhyloCon in the motif length determination. This work was supported by grants from HG00249 and GM28755 from NIH.
REFERENCES
- 1.Dubnau D. (1991) Genetic competence in Bacillus subtilis. Microbiol. Rev., 55, 395–424. [DOI] [PMC free article] [PubMed] [Google Scholar]
- 2.Bischoff D.S. and Ordal,G.W. (1992) Bacillus subtilis chemotaxis: a deviation from the Escherichia coli paradigm. Mol. Microbiol., 6, 23–28. [DOI] [PubMed] [Google Scholar]
- 3.Marahiel M.A., Nakano,M.M. and Zuber,P. (1993) Regulation of peptide antibiotic production in Bacillus.Mol. Microbiol., 7, 631–636. [DOI] [PubMed] [Google Scholar]
- 4.Kunst F., Msadek,T., Bignon,J. and Rapoport,G. (1994) The DegS/DegU and ComP/ComA two-component systems are part of a network controlling degradative enzyme synthesis and competence in Bacillus subtilis. Res. Microbiol., 145, 393–402. [DOI] [PubMed] [Google Scholar]
- 5.Stragier P. and Losick,R. (1996) Molecular genetics of sporulation in Bacillus subtilis. Annu. Rev. Genet., 30, 297–241. [DOI] [PubMed] [Google Scholar]
- 6.Grossman A.D. (1995) Genetic networks controlling the initiation of sporulation and the development of genetic competence in Bacillus subtilis. Annu. Rev. Genet., 29, 477–508. [DOI] [PubMed] [Google Scholar]
- 7.Msadek T. (1999) When the going gets tough: survival strategies and environmental signaling networks in Bacillus subtilis. Trends Microbiol., 7, 201–207. [DOI] [PubMed] [Google Scholar]
- 8.Liu J. and Zuber,P. (1998) A molecular switch controlling competence and motility: competence regulatory factors ComS, MecA and ComK control sigmaD-dependent gene expression in Bacillus subtilis. J. Bacteriol., 180, 4243–4251. [DOI] [PMC free article] [PubMed] [Google Scholar]
- 9.Bernhardt J., Weibezahn,J., Scharf,C. and Hecker,M. (2003) Bacillus subtilis during feast and famine: visualization of the overall regulation of protein synthesis during glucose starvation by proteome analysis. Genome Res., 13, 224–237. [DOI] [PMC free article] [PubMed] [Google Scholar]
- 10.Hoch J.A. (1993) Regulation of the phosphorelay and the initiation of sporulation in Bacillus subtilis. Annu. Rev. Microbiol., 47, 441–465. [DOI] [PubMed] [Google Scholar]
- 11.York K., Kenney,T.J., Satola,S., Moran,C.P.,Jr, Poth,H. and Youngman,P. (1992) Spo0A controls the sigma A-dependent activation of Bacillus subtilis sporulation-specific transcription unit spoIIE. J. Bacteriol., 174, 2648–2658. [DOI] [PMC free article] [PubMed] [Google Scholar]
- 12.Baldus J.M., Green,B.D., Youngman,P. and Moran,C.P.,Jr (1994) Phosphorylation of Bacillus subtilis transcription factor Spo0A stimulates transcription from the spoIIG promoter by enhancing binding to weak 0A boxes. J. Bacteriol., 176, 296–306. [DOI] [PMC free article] [PubMed] [Google Scholar]
- 13.Shafikhani S.H., Mandic-Mulec,I., Strauch,M.A., Smith,I. and Leighton,T. (2002) Postexponential regulation of sin operon expression in Bacillus subtilis. J. Bacteriol., 184, 564–571. [DOI] [PMC free article] [PubMed] [Google Scholar]
- 14.Strauch M., Webb,V., Spiegelman,G. and Hoch,J.A. (1990) The SpoOA protein of Bacillus subtilis is a repressor of the abrB gene. Proc. Natl Acad. Sci. USA, 87, 1801–1805. [DOI] [PMC free article] [PubMed] [Google Scholar]
- 15.Fawcett P., Eichenberger,P., Losick,R. and Youngman,P. (2000) The transcriptional profile of early to middle sporulation in Bacillus subtilis. Proc. Natl Acad. Sci. USA, 97, 8063–8068. [DOI] [PMC free article] [PubMed] [Google Scholar]
- 16.Ishii T., Yoshida,K., Terai,G., Fujita,Y. and Nakai,K. (2001) DBTBS: a database of Bacillus subtilis promoters and transcription factors. Nucleic Acids Res., 29, 278–280. [DOI] [PMC free article] [PubMed] [Google Scholar]
- 17.Ogura M., Yamaguchi,H., Kobayashi,K., Ogasawara,N., Fujita,Y. and Tanaka,T. (2002) Whole-genome analysis of genes regulated by the Bacillus subtilis competence transcription factor ComK. J. Bacteriol., 184, 2344–2351. [DOI] [PMC free article] [PubMed] [Google Scholar]
- 18.Berka R.M., Hahn,J., Albano,M., Draskovic,I., Persuh,M., Cui,X., Sloma,A., Widner,W. and Dubnau,D. (2002) Microarray analysis of the Bacillus subtilis K-state: genome-wide expression changes dependent on ComK. Mol. Microbiol., 43, 1331–1345. [DOI] [PubMed] [Google Scholar]
- 19.Price C.W., Fawcett,P., Ceremonie,H., Su,N., Murphy,C.K. and Youngman,P. (2001) Genome-wide analysis of the general stress response in Bacillus subtilis. Mol. Microbiol., 41, 757–774. [DOI] [PubMed] [Google Scholar]
- 20.Eichenberger P., Jensen,S.T., Conlon,E.M., van Ooij,C., Silvaggi,J., Gonzalez-Pastor,J.E., Fujita,M., Ben-Yehuda,S., Stragier,P., Liu,J.S. and Losick,R. (2003) The sigma(E) regulon and the identification of additional sporulation genes in Bacillus subtilis. J. Mol. Biol., 327, 945–972. [DOI] [PubMed] [Google Scholar]
- 21.Britton R.A., Eichenberger,P., Gonzalez-Pastor,J.E., Fawcett,P., Monson,R., Losick,R. and Grossman,A.D. (2002) Genome-wide analysis of the stationary-phase sigma factor (sigma-H) regulon of Bacillus subtilis. J. Bacteriol., 184, 4881–4890. [DOI] [PMC free article] [PubMed] [Google Scholar]
- 22.Molle V., Nakaura,Y., Shivers,R.P., Yamaguchi,H., Losick,R., Fujita,Y., Sonenshein,A.L. (2003) Additional targets of the Bacillus subtilis global regulator CodY identified by chromatin immunoprecipitation and genome-wide transcript analysis. J. Bacteriol., 185, 1911–1922. [DOI] [PMC free article] [PubMed] [Google Scholar]
- 23.Kobayashi K., Ogura,M., Yamaguchi,H., Yoshida,K., Ogasawara,N., Tanaka,T. and Fujita,Y. (2001) Comprehensive DNA microarray analysis of Bacillus subtilis two-component regulatory systems. J. Bacteriol., 183, 7365–7370. [DOI] [PMC free article] [PubMed] [Google Scholar]
- 24.Ogura M., Yamaguchi,H., Yoshida,K., Fujita,Y. and Tanaka,T. (2001) DNA microarray analysis of Bacillus subtilis DegU, ComA and PhoP regulons: an approach to comprehensive analysis of B.subtilis two-component regulatory systems. Nucleic Acids Res., 29, 3804–3813. [DOI] [PMC free article] [PubMed] [Google Scholar]
- 25.Eisen M.B., Spellman,P.T., Brown,P.O. and Botstein,D. (1998) Cluster analysis and display of genome-wide expression patterns. Proc. Natl Acad. Sci. USA, 95, 14863–14868. [DOI] [PMC free article] [PubMed] [Google Scholar]
- 26.Tavazoie S., Hughes,J.D., Campbell,M.J., Cho,R.J. and Church,G.M. (1999) Systematic determination of genetic network architecture. Nature Genet., 22, 281–285. [DOI] [PubMed] [Google Scholar]
- 27.Blanchette M. and Tompa,M. (2002) Discovery of regulatory elements by a computational method for phylogenetic footprinting. Genome Res., 12, 739–748. [DOI] [PMC free article] [PubMed] [Google Scholar]
- 28.Futcher B. (2002) Transcriptional regulatory networks and the yeast cell cycle. Curr. Opin. Cell Biol., 14, 676–683. [DOI] [PubMed] [Google Scholar]
- 29.Cliften P.F., Hillier,L.W., Fulton,L., Graves,T., Miner,T., Gish,W.R., Waterston,R.H. and Johnston,M.(2001) Surveying Saccharomyces genomes to identify functional elements by comparative DNA sequence analysis. Genome Res., 11, 1175–1186. [DOI] [PubMed] [Google Scholar]
- 30.Cliften P., Sudarsunam,P., Desikan,A., Fulton,J., Fulton,B., Majors,J., Waterston,R., Cohen,B.A. and Johnston,M. (2003) Finding functional features in Saccharomyces genomes by phylogenetic footprinting. Science, 301, 71–76. [DOI] [PubMed] [Google Scholar]
- 31.Mironov A.A., Koonin,E.V., Roytberg,M.A. and Gelfand,M.S. (1999) Computer analysis of transcription regulatory patterns in completely sequenced bacterial genomes. Nucleic Acids Res., 27, 2981–2989. [DOI] [PMC free article] [PubMed] [Google Scholar]
- 32.Gelfand M.S., Koonin,E.V. and Mironov,A.A. (2000) Prediction of transcription regulatory sites in Archaea by a comparative genomic approach. Nucleic Acids Res., 28, 695–705. [DOI] [PMC free article] [PubMed] [Google Scholar]
- 33.Panina E.M., Mironov,A.A. and Gelfand,M.S. (2001) Comparative analysis of FUR regulons in gamma-proteobacteria. Nucleic Acids Res., 29, 5195–5206. [DOI] [PMC free article] [PubMed] [Google Scholar]
- 34.Tan K., Moreno-Hagelsieb,G., Collado-Vides,J. and Stormo,G.D. (2001) A comparative genomics approach to prediction of new members of regulons. Genome Res., 11, 566–584. [DOI] [PMC free article] [PubMed] [Google Scholar]
- 35.Kunst F., Ogasawara,N., Moszer,I., Albertini,A.M., Alloni,G., Azevedo,V., Bertero,M.G., Bessieres,P., Bolotin,A., Borchert,S. et al. (1997) The complete genome sequence of the Gram-positive bacterium Bacillus subtilis.Nature, 390, 249–256. [DOI] [PubMed] [Google Scholar]
- 36.Takami H., Nakasone,K., Takaki,Y., Maeno,G., Sasaki,R., Masui,N., Fuji,F., Hirama,C., Nakamura,Y., Ogasawara,N., Kuhara,S. and Horikoshi,K. (2000) Complete genome sequence of the alkaliphilic bacterium Bacillus halodurans and genomic sequence comparison with Bacillus subtilis. Nucleic Acids Res., 28, 4317–4331. [DOI] [PMC free article] [PubMed] [Google Scholar]
- 37.Read T.D., Peterson,S.N., Tourasse,N., Baillie,L.W., Paulsen,I.T., Nelson,K.E., Tettelin,H., Fouts,D.E., Eisen,J.A., Gill,S.R. et al. (2003) The genome sequence of Bacillus anthracis Ames and comparison to closely related bacteria. Nature, 423, 81–86. [DOI] [PubMed] [Google Scholar]
- 38.Nolling J., Breton,G., Omelchenko,M.V., Makarova,K.S., Zeng,Q., Gibson,R., Lee,H.M., Dubois,J., Qiu,D., Hitti,J. et al. (2001) Genome sequence and comparative analysis of the solvent-producing bacterium Clostridium acetobutylicum. J. Bacteriol., 183, 4823–4838. [DOI] [PMC free article] [PubMed] [Google Scholar]
- 39.Benson D.A., Karsch-Mizrachi,I., Lipman,D.J., Ostell,J., Rapp,B.A. and Wheeler,D.L. (2002) GenBank. Nucleic Acids Res., 30, 17–20. [DOI] [PMC free article] [PubMed] [Google Scholar]
- 40.Hertz G.Z. and Stormo,G.D. (1999) Identifying DNA and protein patterns with statistically significant alignments of multiple sequences. Bioinformatics, 15, 563–577. [DOI] [PubMed] [Google Scholar]
- 41.Workman C.T. and Stormo,G.D. (2000) ANN-Spec: a method for discovering transcription factor binding sites with improved specificity. Pac. Symp. Biocomput., 467–478. [DOI] [PubMed] [Google Scholar]
- 42.Stormo G.D. (2000) DNA binding sites: representation and discovery. Bioinformatics, 16, 16–23. [DOI] [PubMed] [Google Scholar]
- 43.Fitch W.M. (1970) Distinguishing homologous from analogous proteins. Syst. Zool., 19, 99–100. [PubMed] [Google Scholar]
- 44.Altschul S.F., Madden,T.L., Schaffer,A.A., Zhang,J., Zhang,Z., Miller,W. and Lipman,D.J.(1997) Gapped BLAST and PSI-BLAST: a new generation of protein database search programs. Nucleic Acids Res., 25, 3389–3402. [DOI] [PMC free article] [PubMed] [Google Scholar]
- 45.Huynen M.A. and Bork,P. (1998) Measuring genome evolution. Proc. Natl Acad. Sci. USA, 95, 5849–5856. [DOI] [PMC free article] [PubMed] [Google Scholar]
- 46.Schneider T.D. and Stephens,R.M. (1990) Sequence logos: a new way to display consensus sequences. Nucleic Acids Res., 18, 6097–6100. [DOI] [PMC free article] [PubMed] [Google Scholar]
- 47.Thompson J.D., Gibson,T.J., Plewniak,F., Jeanmougin,F. and Higgins,D.G. (1997) The CLUSTAL_X windows interface: flexible strategies for multiple sequence alignment aided by quality analysis tool. Nucleic Acids Res., 25, 4876–4882. [DOI] [PMC free article] [PubMed] [Google Scholar]
- 48.Wall L., Christiansen,T. and Schwartz,R.L. (1996) Programming PERL. O’Rilley and Associates, Sebastopol, CA. [Google Scholar]
- 49.Lewis R.J., Muchova,K., Brannigan,J.A., Barak,I., Leonard,G. and Wilkinson,A.J. (2000) Domain swapping in the sporulation response regulator Spo0A. J. Mol. Biol., 297, 757–770. [DOI] [PubMed] [Google Scholar]
- 50.Lewis R.J., Brannigan,J.A., Muchova,K., Barak,I. and Wilkinson,A.J. (1999) Phosphorylated aspartate in the structure of a response regulator protein. J. Mol. Biol., 294, 9–15. [DOI] [PubMed] [Google Scholar]
- 51.Lewis R.J., Krzywda,S., Brannigan,J.A., Turkenburg,J.P., Muchova,K., Dodson,E.J., Barak,I. and Wilkinson,A.J. (2000) The trans-activation domain of the sporulation response regulator Spo0A revealed by X-ray crystallography. Mol. Microbiol., 38, 198–212. [DOI] [PubMed] [Google Scholar]
- 52.Zhao H., Msadek,T., Zapf,J., Madhusudan, Hoch,J.A. and Varughese,K.I. (2002) DNA complexed structure of the key transcription factor initiating development in sporulating bacteria. Structure (Camb.), 10, 1041–1050. [DOI] [PubMed] [Google Scholar]
- 53.Lawrence C.E., Altschul,S.F., Boguski,M.S., Liu,J.S., Neuwald,A.F., Wootton,J.C. (1993) Detecting subtle sequence signals: a Gibbs sampling strategy for multiple alignment. Science, 262, 208–214. [DOI] [PubMed] [Google Scholar]
- 54.Bailey T.L. and Elkan,C. (1995) The value of prior knowledge in discovering motifs with MEME. Proc. Int. Conf. Intell. Syst. Mol. Biol., 3, 21–29. [PubMed] [Google Scholar]
- 55.Kobayashi K., Shoji,K., Shimizu,T., Nakano,K., Sato,T. and Kobayashi,Y. (1995) Analysis of a suppressor mutation ssb (kinC) of sur0B20 (spo0A) mutation in Bacillus subtilis reveals that kinC encodes a histidine protein kinase. J. Bacteriol., 177, 176–182. [DOI] [PMC free article] [PubMed] [Google Scholar]
- 56.Strauch M.A., Trach,K.A., Day,J. and Hoch,J.A. (1992) Spo0A activates and represses its own synthesis by binding at its dual promoters. Biochimie, 74, 619–626. [DOI] [PubMed] [Google Scholar]
- 57.Strauch M.A., Wu,J.J., Jonas,R.H. and Hoch,J.A. (1993) A positive feedback loop controls transcription of the spoOF gene, a component of the sporulation phosphorelay in Bacillus subtilis. Mol. Microbiol., 7, 967–974. [DOI] [PubMed] [Google Scholar]
- 58.Perego M., Glaser,P., Minutello,A., Strauch,M.A., Leopold,K. and Fischer,W. (1995) Incorporation of d-alanine into lipoteichoic acid and wall teichoic acid in Bacillus subtilis. Identification of genes and regulation. J. Biol. Chem., 270, 15598–15606. [DOI] [PubMed] [Google Scholar]
- 59.Hertz G.Z., Hartzell,G.W.,III and Stormo,G.D. (1990) Identification of consensus patterns in unaligned DNA sequences known to be functionally related. Comput. Appl. Biosci., 6, 81–92. [DOI] [PubMed] [Google Scholar]
- 60.Wang T. and Stormo,G.D. (2003) Comining phylogenetic data with co-regulated genes to identify regulatory motif. Bioinformatics, in press. [DOI] [PubMed] [Google Scholar]
- 61.Gelfand M.S. (1999) Recognition of regulatory sites by genomic comparison. Res. Microbiol., 150, 755–771. [DOI] [PubMed] [Google Scholar]
- 62.Stormo G.D. and Tan,K. (2002) Mining genome databases to identify and understand new gene regulatory systems. Curr. Opin. Microbiol., 5, 149–153. [DOI] [PubMed] [Google Scholar]
- 63.Hoch J.A. (2000) Two-component and phosphorelay signal transduction. Curr. Opin. Microbiol., 3, 165–170. [DOI] [PubMed] [Google Scholar]
- 64.Sauer U., Santangelo,J.D., Treuner,A., Buchholz,M. and Durre,P. (1995) Sigma factor and sporulation genes in Clostridium. FEMS Microbiol. Rev., 17, 331–340. [DOI] [PubMed] [Google Scholar]
- 65.Strauch M.A. and Hoch,J.A. (1992) Sporulation in prokaryotes and lower eukaryotes. Curr. Opin. Genet. Dev., 2, 799–804. [DOI] [PubMed] [Google Scholar]
- 66.Brown D.P., Ganova-Raeva,L., Green,B.D., Wilkinson,S.R., Young,M. and Youngman,P. (1994) Characterization of spo0A homologues in diverse Bacillus and Clostridium species identifies a probable DNA-binding domain. Mol. Microbiol., 14, 411–426. [DOI] [PubMed] [Google Scholar]
- 67.Harris L.M., Welker,N.E. and Papoutsakis,E.T. (2002) Northern, morphological and fermentation analysis of spo0A inactivation and overexpression in Clostridium acetobutylicum ATCC 824. J. Bacteriol., 184, 3586–3597. [DOI] [PMC free article] [PubMed] [Google Scholar]