Abstract
Endoproteolytic processing is carried out by subtilase-like pro-protein convertases in mammalian cells. In order to understand the distinct roles of a member of this family (SPC2), gene silencing in cultured cells is an ideal approach. Previous studies showed limited success in either the degree of inhibition obtained or the stability of the cell lines. Here we demonstrate the high potential of δ ribozyme as a post-transcriptional gene silencing tool in cultured cells. We used an expression vector based on the RNA polymerase III promoter to establish βTC-3 stable cell lines expressing the chimeric tRNAVal-δ ribozyme transcript targeting SPC2 mRNA. Northern and Western blot hybridizations showed a specific reduction of SPC2 mRNA and protein. Validation of processing effects was tested by measuring the levels of dynorphin A-(1–8), which are present in βTC-3 cells as a result of the unique cleavage of dynorphin A-(1–17) by SPC2. Moreover, a differential proteomic analysis confirmed these results and allowed identification of secretogranin II as a potential substrate of SPC2. The development of efficient, specific, and durable silencing tools, such as described in the present work, will be of great importance in elucidating the functions of the subtilase-like pro-protein convertases in regard to peptide processing and derived cellular events.
Subtilase-like pro-protein convertases (SPCs)1 are enzymes that carry out proteolytic processing in mammalian species (for a review see Ref. 1). This post-translational modification permits the diversification and regulation of gene products. Seven distinct enzymes are included in the SPC family (2) as follows: SPC1 (furin or PACE), SPC2 (PC2), SPC3 (PC1 or PC3), SPC4 (PACE4), SPC5 (PC4), SPC6 (PC5 or PC6), and SPC7 (LPC, PC7, or PC8). SPCs are highly specific proteases that cleave pro-protein precursors at positively charged amino acids (i.e. Arg-Arg, Lys-Arg, Arg-Lys, Lys-Lys, or even single Arg residues). Furthermore, distribution studies indicated that instead of expressing one SPC at a time, the various cell types expressed distinct combinations of the SPCs (3, 4). The similarities in the cleavage recognition motif, combined with cellular co-localization, suggested the possibility of overlapping processing functions within SPC family members. This hypothesis was supported by studies on SPC2- and SPC3-null mice where the processing of pro-insulin was severely impaired but not completely blocked (5, 6). However, not all SPCs are amenable to null mouse models, because both SPC1- and SPC4-null mice are not viable (7).
A good method for determining the functional specificity of each SPC resides in developing cultured cell lines in which the expression of a single member of the enzyme family is specifically inhibited, as this permits a fine control of the extracellular environment. To date, few endogenous inhibitors (e.g. 7B2 C-terminal peptide and pro-SAAS-derived peptides) or protein-based bio-engineered inhibitors (such as α1-antitrypsin Portland) have been described (for a review see Ref. 8). Most of these inhibitory agents exhibited great potency against their target, but their specificity among the other SPCs remains to be studied/improved. Thus, their use may lead to some erroneous interpretations of the substrate specificity function of a discrete SPC when used in cell lines that contain other enzymes of the SPC family. Another way of inhibiting the function of SPCs in cultured cells is by targeting their mRNAs. The introduction of antisense oligonucleotide or small interfering RNA in cells may lead to a down-regulation of the targeted mRNA by the host molecular machinery. However, problems of potency-, specificity-, and/or cell type-dependent responses illustrate a lack of understanding of intracellular mechanisms involved (9, 10). In an entirely different approach, we have investigated the use of δ ribozyme (δRz) as a molecular tool to specifically target a single SPC. The ability of ribozymes to specifically recognize and subsequently catalyze the cleavage of an RNA molecule makes them attractive in mRNA gene silencing approaches (for a review see Ref. 11). The δRz, which derives from the hepatitis δ virus, possesses several unique features all related to the fact that it is the only naturally occurring catalytic RNA discovered in humans (for reviews see Refs. 12 and 13). The use of δRz for specific cleavage in trans of natural mRNA in vitro as well as in vivo has been demonstrated but not well characterized (14 –16). In this study, we applied δRz design strategy with the goal of the complete inhibition of SPC2 activity in βTC-3 cells that endogenously express the pro-dynorphin (pro-Dyn) substrate (4). By demonstrating unambiguously the potency and the specificity of the δRz, we showed the potential utility of this molecular tool for SPC substrate specificity characterization studies.
EXPERIMENTAL PROCEDURES
Bioinformatic Analysis of the SPC2 mRNA
Selection of the targeting sites was performed as described previously (14). Briefly, eight SPC cDNA sequences (GenBank™ data base accession numbers: X54056 (mouse SPC1), M55669 (mouse SPC2), M58589 (mouse SPC3), AF008222 (partial mouse SPC4), L31894 (rat SPC4), D01093 (mouse SPC5), D12619 (mouse SPC6), and U48830 (mouse SPC7)) were aligned using the ClustalW package (17). This sequence alignment was used to confirm the cleavage specificity with regard to the other SPCs. We used the full-length SPC2 mRNA sequence (Fig. 1A) to evaluate the most stable secondary structures. These values, expressed in terms of the variation of free energy (ΔG), were obtained using the program RNA Structure 3.5 (18). The resulting file was then analyzed for the probability of binding to complementary 7 nucleotide (nt) oligonucleotides using the OligoWalk software (19).
Fig. 1. Representation of SPC2 mRNA and δRz.
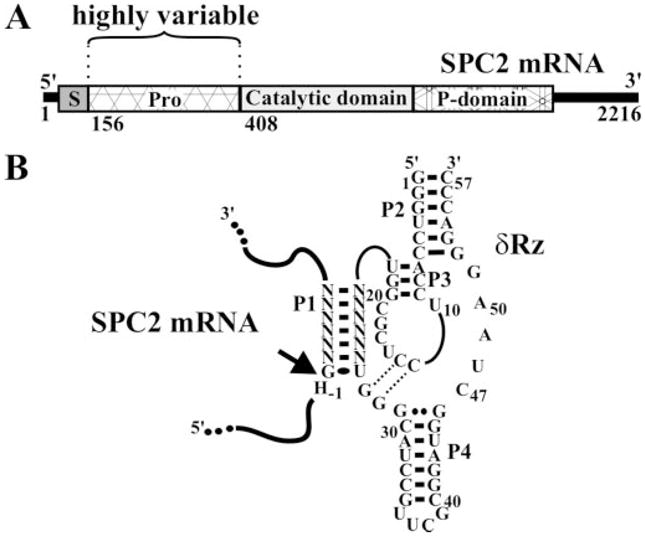
A, the organization of SPC2 includes the signal peptide (S), the prodomain (Pro), the catalytic domain, and the P-domain. B, secondary structure and nucleotide sequence of the δRz hybridized to the SPC2 mRNA. The pseudoknot P1.1 is illustrated by the dotted lines. The homopurine bp at the top of the P4 stem is represented by two large dots (G●●G) whereas the wobble bp is represented by a single large dot (G●U). Only nucleotides essential for cleavage are shown: H indicates A, C, or U, and N indicates A, C, G, or U. The arrow indicates the cleavage site.
SPC2 and δRz DNA Constructs
The fragment from nucleotides 70 to 661 of the SPC2 mRNA was amplified by PCR from βTC-3 cell total cDNA using sense (5′-CACTCCCAAAGAAGGATGGAG-3′) and anti-sense (5′-GGTCATTGCTGCTGAAGTCAT-3′) primers. The resulting PCR product was cloned into the vector pCRII-topo (Invitrogen), forming the plasmid pCRII/mSPC2-(70 –661). The construction of δRz mini-genes for in vitro transcription was performed as described previously (14). Plasmids harboring δRz are referred to pδRz-SPC2-X, where X corresponds to the position of its potential cleavage site within SPC2 mRNA. Finally, the tRNAVal-δRz chimeric genes were generated as follows. A pair of complementary and overlapping oligodeoxynucleotides (ODN) corresponding to the δRz region was annealed and ligated to KpnI/EcoRV co-digested pPUR-KE vector (kindly provided by K. Taira; Ref. 15). The resulting plasmid, pPUR-KE-δRz, was co-digested with EcoRI and BamHI in order to liberate the tRNAVal-δRz cloning cassette, which was then subcloned into pcDNA3.1/hygro (Invitrogen) digested with MfeI and BamHI. This produced a plasmid harboring a tRNAVal-δRz chimeric template referred as ptRNAVal-δRz-SPC2-X. All constructions were confirmed by DNA sequencing.
RNA Synthesis
Partial SPC2 and δRz were transcribed in vitro using SmaI and HindIII linearized pCRII/mSPC2-(70 –661) and pδRz-SPC2-X, respectively, as templates. Run-off transcriptions were performed in the presence of purified T7 RNA polymerase (10 μg), RNA-guard (24 units, Amersham Biosciences), pyrophosphatase (0.01 unit, Roche Diagnostics), linearized plasmid DNA (5 μg) and either with or without 50 μCi of [α-32P]GTP (PerkinElmer Life Sciences) as described previously (14). After DNase digestion, phenol/chloroform extraction, and nucleic acid precipitation, both SPC2 mRNA and δRz were fractionated by denaturing 5–7.5% PAGE in buffer containing 45 mM Tris borate, pH 7.5, 7 M urea, and 1 mM EDTA. The reaction products were visualized by either UV shadowing or autoradiography. The bands corresponding to the correct sizes were cut out, and the transcripts were eluted overnight at room temperature in 0.5 M ammonium acetate and 0.1% SDS solution. The transcripts were desalted on Sephadex G-25 (Amersham Biosciences) spun columns and were then precipitated by the addition of 0.1 volume of 3 M sodium acetate, pH 5.2, and 2.5 volumes of ethanol, washed, dried, resuspended in ultrapure water, and quantified by either absorbance at 260 nm or 32P counting.
RNase H Hydrolysis and δRz Cleavage Assays
RNase H reactions were performed using internally 32P-labeled SPC2 mRNA. Briefly, SPC2 RNA (~0.1 μM, ~20,000 cpm) and ODN (7 nt, 5 μM) were preincubated for 10 min at 25 °C in a final volume of 8 μl containing 20 mM Tris-HCl, pH 7.5, 20 mM KCl, 10 mM MgCl2, 0.1 mM EDTA, and 0.1 mM dithiothreitol. RNase H (0.5 unit, U. S. Biochemical Corp.) was then added (2 μl), and the samples were incubated at 37 °C for 30 min. The reactions were quenched by adding loading buffer (97% formamide, 1 mM EDTA (pH 8.0), 0.025% xylene cyanol, and 0.025% bromphenol blue) and fractionated through denaturing 5% PAGE gels, which were analyzed with a PhosphorImager (Amersham Biosciences).
For δRz cleavage reactions, internally 32P-labeled SPC2 mRNA (50 nM) was mixed with δRz (1 μM) in a 10-μl mixture containing 50 mM Tris-HCl, pH 7.5, and 10 mM MgCl2 and then incubated at 37 °C for 3 h. The reactions were stopped by the addition of loading buffer, electrophoresed on denaturing 5% PAGE gels, and analyzed with a radioanalytic scanner.
Cell Culture and DNA Transfections
βTC-3 cells (insulinoma, mouse) were grown in Dulbecco’s modified Eagle’s medium with low glucose concentration supplemented with 10% fetal bovine serum (Invitrogen) and 40 mg/liter garamycin (Schering Canada Inc., Pointe-Claire, Québec, Canada) at 37 °C in 5% CO2. The cells were transfected using LipofectAMINE, as per the manufacturer’s instructions (Invitrogen), and were then selected for resistance to hygromycin B (Invitrogen) at a final concentration of 175 μg/ml.
Primer Extension of tRNAVal-δRz and U6 RNA
Total RNA from βTC-3 was extracted with TriReagent (BioShop Canada Inc., Burlington, Ontario, Canada). The primers, corresponding to the 3′ complementary sequence of δRz and U6 RNA (5′-GGGTCCCTTAGCCATGC-GCGAACG-3′ and 5′-GGCCATGCTAATCTTCTCTG-3′, respectively), have been 32P-labeled by the usual procedure and annealed to 10 μg of total RNA in a 50 mM Tris-HCl, pH 8.3, 80 mM KCl, and 10 mM MgCl2 by a 2-min incubation at 65 °C and immediately chilled on ice. The reaction was initiated with the addition of 0.8 mM of dNTPs, 3.3 mM dithiothreitol, and Superscript™ Reverse Transcriptase (100 units; Invitrogen) in a final volume of 12 μl. The samples were incubated at 45 °C for 30 min, stopped by adding loading buffer, and fractionated on 10% denaturing PAGE and visualized with a PhosphorImager.
Northern Blot Hybridizations
Northern blot analyses of total RNA (5 μg) extracted from βTC-3 cells, using guanidinium isothiocyanate followed by lithium chloride precipitation, were performed as described previously (4). The cDNAs cloned for the pro-hormone convertase probes are as follows: a 1231-bp rat SPC1 (4), a 350-bp mouse SPC2 (20), a 500-bp mouse SPC3 (20), and a 650-bp rat SPC7 (21). The cDNAs cloned for the carboxypeptidase E (CPE; kindly provided by L. D. Fricker, Albert Einstein College of Medicine, Bronx, NY), the prodynorphin (pro-Dyn), and for the 18 S rRNA probes were a 400-bp rat CPE (22), a 733-bp rat pro-Dyn (4), and a 600-bp bovine 18 S (3), respectively. Complementary RNA probes were transcribed from linearized plasmids with T3, T7, or SP6 RNA polymerases in the presence of [α-32P]UTP. All hybridizations were carried out for 16 –18 h at 65 °C. The membranes were then exposed to x-ray films for 2–72 h. The densitometry analysis was carried out on digitized film using the image analysis software Scion Image 1.62c (Scion Corp., Frederick, MD).
Electron Microscopy
Cell pellets were fixed for 20 min with 5% glutaraldehyde in 0.1 M sodium cacodylate buffer, pH 7.4, followed by another 30-min fixation in 2.5% glutaraldehyde in 0.1 M sodium cacodylate buffer, pH 7.4. After a wash with 0.2 M sodium cacodylate buffer, cells were treated for 1 h with 1% osmium tetroxide in 0.1 M sodium cacodylate buffer. Samples were washed and incubated for 45 min in 0.25% uranyl acetate in 2.5% sodium acetate buffer, pH 6.3, dehydrated in acetone, and embedded in epoxy resin. Thin sections were counter-stained with a solution of 1% uranyl acetate and 6% lead citrate, pH 10.
Western Blot Hybridizations
Cells were lysed in 50 mM Tris-HCl, pH 7.4, 2.5 mM EDTA, 150 mM NaCl, 0.02% sodium azide, and protease inhibitors (Complete Mini; Roche Diagnostics). Protein concentrations were determined using the Bradford protein assay. Total protein extracts (15 μg) were fractionated on a 7.5% SDS-PAGE and transferred to Hybond-P membrane (Amersham Biosciences). The antibody against mouse SPC2 was C-terminally directed (23), and the antibody against CPE was kindly provided by Dr. L. D. Fricker. Proteins were revealed using the ECL Plus detection system (Amersham Biosciences) and exposed to x-ray films.
Reverse Phase-HPLC (RP-HPLC) Analysis and Radioimmunoassay (RIA)
βTC-3 cells (Four 80% confluent 100 × 20-mm dishes) were washed with phosphate-buffered saline and harvested. The cell pellets were extracted with 300 μl of 50% methanol, 0.05 N HCl solution. After centrifugation at 15,000 × g for 30 min at 4 °C, the supernatants (≈1.5 mg of proteins) were diluted in 10 ml of 0.1% trifluoroacetic acid and loaded on Sep-Pak C18 cartridges (Waters Corp., Milford, MA) initially primed with 10 ml of 100% acetonitrile (ACN), 0.1% trifluoroacetic acid and then with 10 ml of 0.1% trifluoroacetic acid. Elution from the cartridge was achieved by the injection of 40% ACN, 0.1% trifluoroacetic acid (4 ml). All fractions were lyophilized and resuspended in 15% ACN, 0.1% trifluoroacetic acid before injection onto a 5-μm C18 column (25 × 0.46 cm; Vydac, Hesperia, CA). Samples were loaded at 15% ACN, 0.1% trifluoroacetic acid and separated using a 15–30% ACN, 0.1% trifluoroacetic acid linear gradient in 30 min at a flow rate of 1 ml/min. The standard peptide Dyn A-(1–8) (porcine; Peninsula Laboratories Inc., Belmont, CA) was used to determine the elution time.
The RIA against Dyn A-(1–8) has been extensively characterized (4, 24). Briefly, the Dyn A-(1–8) antibody is C-terminally targeted and does not cross-react with Dyn A-(1–17) or larger forms of pro-Dyn-derived peptides.
Mass Spectrometry
For consecutive analyses with mass spectrometry new samples were prepared. The extraction procedures for the cell lines, and the HPLC separations were performed as described above except for the following modifications. All of the HPLC steps were performed on a Beckman Gold HPLC system equipped with a Beckman 168 photodiode array detector. Column effluent was monitored by UV absorption at 220 and 280 nm. The HPLC was performed with either an Ultrasphere C18 column or a Macherey Nagel (4.6 mm × 25 cm) column. Elution was performed with a linear gradient of 0 –60% ACN in acidified water (0.05% trifluoroacetic acid) over 60 min at a flow rate of 0.5 ml/min. Fractions corresponding to absorbance peaks were collected, dried, reconstituted in water, and tested in dot immunobinding assays (DIA) with anti-Dyn antibodies. For the DIA, the HPLC-eluted fractions were freeze-dried before resuspending in 100 μl of water. One μl was spotted onto a nitrocellulose membrane and incubated with Dyn antisera (1:1000). Bound antibodies were detected by ECL Plus detection system (Amersham Biosciences). For mass spectrometry, the samples were analyzed using α-cyano-4-hydroxycinnamic acid (HCCA) as matrix. A two-layer preparation was chosen for the MALDI experiments. Briefly, 1 μl of HCCA in acetone (15 mg/ml) was applied to the MALDI target. After evaporation and preparation of a ultrathin layer of matrix, 1 μl of protein sample was applied on the first layer, immediately followed by 1 μl of classical HCCA solution (10 mg in trifluoroacetic acid 0.1%, ACN 3:7, v/v) prior to drying at room temperature. Analyses were carried out on a Voyager STR (Perspective Biosystems, Framingham, MA) MALDI-time of flight mass spectrometer equipped with a N2 laser (2-ns pulse duration and 3-Hz repetition rate). Mass spectra were recorded in the positive linear mode using delayed extraction. Laser flux was set at a value just above the threshold for ion production. Calibration was realized with four external calibrants covering the mass range of interest (Substance P, ACTH(18 –39), ACTH(7–38), and bovine insulin) prepared in the same way as the samples.
RESULTS
Identification of Potential Target Sites
The selection of the RNA cleavage site is the initial step in designing a specific δRz. Due to unfavorable competition with intramolecular base pairing, target sequences located in single-stranded regions of an mRNA are potentially more accessible for δRz binding than those in double-stranded regions. In order to identify cleavage sites with the greatest potential for targeting, we adopted a procedure that combined both bioinformatic tools and biochemical assays (14). The first step was the prediction of the mRNA secondary structure using the RNA folding algorithm in the RNA Structure 3.5 software. Five virtually identical structures were obtained for the full-length SPC2 mRNA (data not shown). These structures were analyzed using the OligoWalk software, which provided the degree of accessibility of each 7-nt potential site (19). The results were obtained for the full-length SPC2 mRNA; however, only the sites between positions 70 and 661, which is the highly variable sequence relative to the other SPCs (Fig. 1A), were considered. In this region, 94 sites appeared to be relatively accessible for the binding of RNA oligo-nucleotides. Subsequently, this collection of potential sites was analyzed for criteria known to be essential for efficient cleavage by a trans-acting antigenomic δRz (Fig. 1B). These criteria were based on the fact that the first pairing of the P1 stem must be a GU wobble bp and that the presence of a guanosine at the cleavage site (position −1) results in an uncleavable substrate (25). Finally, analysis of the sequences indicated that no other cleavages could occur within the SPC gene family. Therefore, the eight chosen sequences were specific to SPC2 mRNA.
In order to validate the bioinformatic predictions, biochemical assays were carried out in vitro on SPC2 partial mRNA corresponding to the targeted region (i.e. from residues 70 to 661). RNase H hydrolysis assays using 7-nt ODNs corresponding to the recognition domain of the δRz were performed. RNase H specifically cleaves the RNA of an RNA-DNA duplex. Hence, the enzyme can be used to verify whether or not the binding of an ODN did indeed take place (14). Randomly labeled partial SPC2 mRNA was pre-incubated with unlabeled ODNs, digested by RNase H, and analyzed on a PAGE gel (Fig. 2A). Cleavage was observed with all ODNs, although at different levels. Moreover, nonspecific cleavage was also observed with some ODNs (e.g. ODN-394). Subsequently, the eight δRz with appropriate recognition sequences were synthesized, and their ability to cleave the labeled SPC2 mRNA fragment was studied under single-turnover conditions ([Rz] > [S]) and analyzed on PAGE gel (Fig. 2B). Four δRz cleaved the target (i.e. δRz-134, -154, -232 and -394; where the numbers indicate the position cleaved on SPC2 mRNA), although with varying efficiencies. Moreover, this experiment revealed the superior specificity of δRz as compared with RNase H, because no minor products were observed. Among the δRz cleaving SPC2 partial mRNA, only the most efficient were retained for the subsequent cultured cells studies (i.e. δRz-154 and -394).
Fig. 2. Autoradiograms of 5% PAGE gels of both the RNase H and δRz cleavage assays.
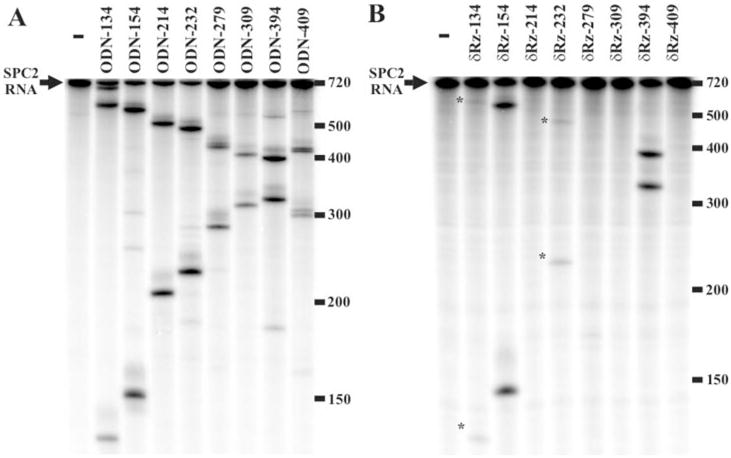
A and B, typical results of RNase H and δRz assays, respectively. The 1st lanes are the negative controls without either ODN or δRz. The other 8 lanes are the assays performed with either the various ODNs or δRz. The number after the ODN and δRz indicates the cleavage site position on SPC2 mRNA. The asterisks indicate the lower intensity cleavage bands. The molecular sizes (nt) are indicated on the right.
Expression of tRNAVal-δRz Chimeric Constructions
A vector including a modified tRNAVal promoter was used for the cell culture expression studies (15). Briefly, the tRNAVal cassette from pPUR-KE vector was subcloned in a pcDNA3.1/hygro vector producing ptRNAVal-δRz-SPC2-X (Fig. 3A). In order to avoid double transcript production in cells (i.e. by the CMV and tRNAVal promoters simultaneously), the CMV promoter in this plasmid was removed. The use of the tRNAVal promoter permitted the production of a large amount of the chimeric RNA by the host RNA pol III. In addition, it is well known that the tRNAVal motif directs the expressed δRz to the cytoplasm (15), where it will hybridize to the targeted mRNA (Fig. 3B). Thus, the δRz-154 and -394 were placed under the control of the tRNAVal promoter in the expression vectors ptRNAVal-δRz-SPC2–154 and -394 and in their catalytically inactive equivalents ptRNAVal-δRzC47A-SPC2–154 and -394. The δRzC47A mutants are inactive versions in which the cytosine in position 47 was mutated for an adenosine (16). These δRz exhibited the same binding but are completely deprived of cleavage activity; therefore, they are ideal controls for antisense effect. An expression vector lacking the δRz-coding sequence (ptRNAVal-KE) was also used as a control. βTC-3 cells were then transfected with these five expression vectors. This mouse pancreatic tumoral cell line was chosen for several reasons including the fact that it is well characterized for expression of SPCs (including SPC2), and it is easy to grow and transfect (4). Stable cell lines for each construction were established by the selection of clones resistant to hygromycin B. Both primer extension (Fig. 3C) and Northern blot analyses (data not shown) were used to evaluate the expression levels of the chimeric tRNAVal-δRz transcripts in 15 established cell lines for each construction. Expression levels in cell lines 154-2 and 394-1 were among the highest, whereas other cell lines (154-1 and 394-9) showed a weaker expression. The further analyses were performed on extracts from these five selected cell lines.
Fig. 3. Expression of tRNAVal-δRz chimeric constructions.
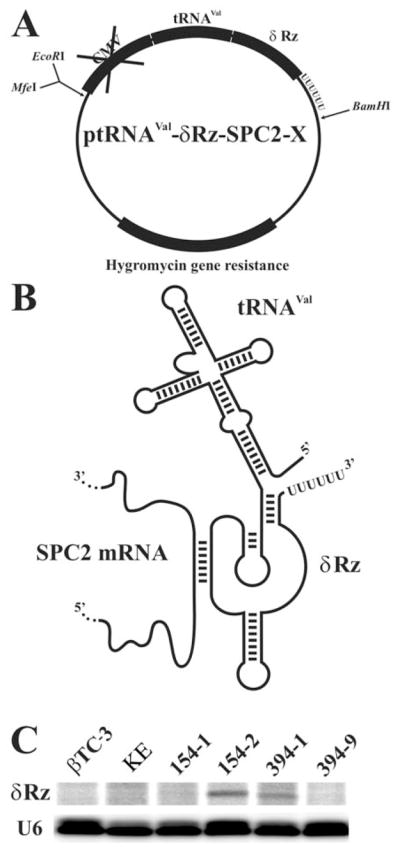
A, vector used for cultured cells studies. We attenuated the CMV promoter of pcDNA3.1/hygro by the cleavage of MfeI before the promoter sequence. MfeI and EcoRI are two compatible sites that have been used for the cloning. The δRz has been first cloned in the pPUR-KE vector. Then the tRNAVal-δRz cassette has been subcloned from pPUR-KE to pcDNA3.1/hygro without CMV promoter to obtain ptRNAVal-δRz-SPC2-X (where X indicates the position of the cleavage site). The hygromycin gene resistance allowed selection of positive clones upon transfection. B, drawing of the chimeric tRNAVal-δRz RNA produced from the ptRNAVal-δRz-SPC2 hybridized with the SPC2 mRNA substrate. The tRNAVal portion drives the δRz to the cytoplasm, and the poly(U) ensures the transcription termination. C, analysis of the expression levels of the chimeric tRNAVal-δRz and U6 RNA. Primer extension of the chimeric constructions tRNAVal-δRz (δRz line) on total RNA of four cell lines established with either ptRNAVal-δRz-SPC2–154 (154-1 and 154-2) or -394 (394-1 and 394-9). Untransfected βTC-3 and cell line established with the vector ptRNAVal-KE (βTC-3 and KE, respectively) served as controls. Primer extension of the endogenous U6 RNA (U6 line) served as internal control.
Initially, total RNA extracts were subjected to Northern blot analysis of SPC2 mRNA (Fig. 4A). The levels of SPC2 mRNA in cell line 154 were drastically reduced in comparison to the two control cell lines KE and 154C47A. However, the level of SPC2 mRNA in cell line 394 was virtually similar to the ones found in the KE and 394C47A cell lines. Because all chimeric transcripts were detected in the cell lines tested, these results suggest that the cleavage site at position 394 may not be as accessible in vivo as it was in the in vitro assays on partial mRNA transcripts. The ratio obtained was transformed in relative SPC2 mRNA levels using the values from the KE cell line as a reference (i.e. 100%; Fig. 4A). This indicated that cell line 154 had no detectable SPC2 mRNA (≪1%), whereas the levels of SPC2 mRNA in the other cell lines were approximately of the same order. More generally, we observed that the concentration of δRz-154 expressed in a cell and the level of SPC2 mRNA cleavage detected increased proportionately.
Fig. 4. Autoradiograms of Northern blot hybridizations.
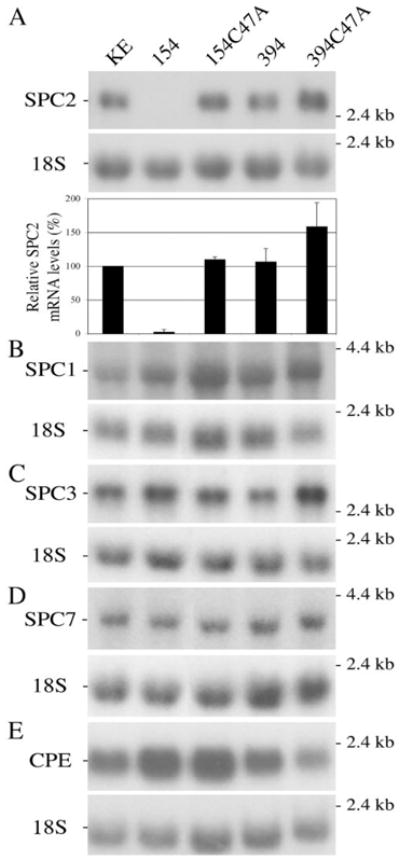
A, analysis of SPC2 mRNA is presented in the upper panel. The levels of SPC2 mRNA were analyzed in the five established cell lines. The lower panel illustrates the relative expression of SPC2 mRNA by densitometric analysis (using the KE cell line as a reference; n = 3). Each band was normalized with the corresponding 18 S ribosomal RNA band. B–E, analysis of SPC1, SPC3, SPC7, and CPE mRNAs levels, respectively. The size markers are shown on the right.
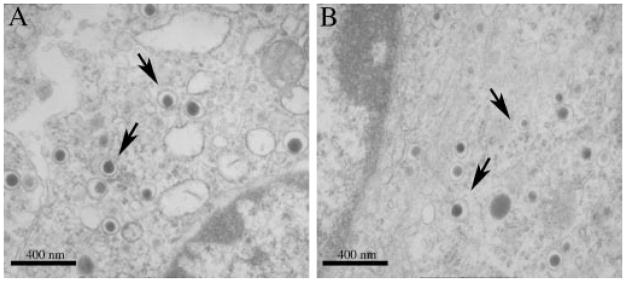
The specificity of cleavage of the δRz was examined by monitoring the mRNA levels of the three other SPCs expressed in βTC-3 cells (i.e. SPC1, SPC3, and SPC7) and the CPE mRNA (Fig. 4, B–E). The CPE enzyme is implicated in the trimming of the basic residue(s) located C-terminally of the newly processed proteins within the regulated secretory pathway (26). Small variations were observed among all cell lines. However, these changes could not be linked to the catalytic activity of δRz because they were not uniquely associated with cell lines 154 or 394; thus, they are probably due to transfection-induced stress. Despite these changes, these results confirmed that the cleavage activity observed on SPC2 mRNA was both strong and specific because the effect observed on SPC2 mRNA was not repeated on the other mRNAs tested. Moreover, electron microscopy confirmed that the endocrine phenotype was not altered in cells lacking SPC2 as secretory granules could be observed in both βTC-3 and 154 cell lines (Fig. 5, A and B, respectively).
Fig. 5. Electron microscopy of βTC-3 and 154 cell lines (A and B, respectively).
Secretory granules are indicated by arrows (×25,000).
Effect of the δRz at the Protein Level
Western blot hybridizations were performed in order to verify whether or not δRz action on the SPC2 mRNA was reflected at the protein level (Fig. 6). The βTC-3, KE, 154C47A, 394, and 394C47A cell lines showed comparable SPC2 protein levels. In these four cell lines, two major bands could be observed as follows: a 75- and 66-kDa band that corresponded to the catalytically inactive (pro-SPC2) and the mature active SPC2, respectively (27). Neither of the last two bands was detected in protein extracts from the cell line 154, even upon overexposure of the film (data not shown), confirming that the strong effect observed on the SPC2 mRNA levels resulted in a nearly complete silencing of SPC2 expression. The major bands (50 –56 kDa) corresponding to CPE isoforms (26) are also shown in the lower panel of Fig. 6 and confirmed the specificity of the action despite variations in protein levels from one cell line to an other because the effect of the δRz on the target is much stronger.
Fig. 6. Western blot hybridizations.
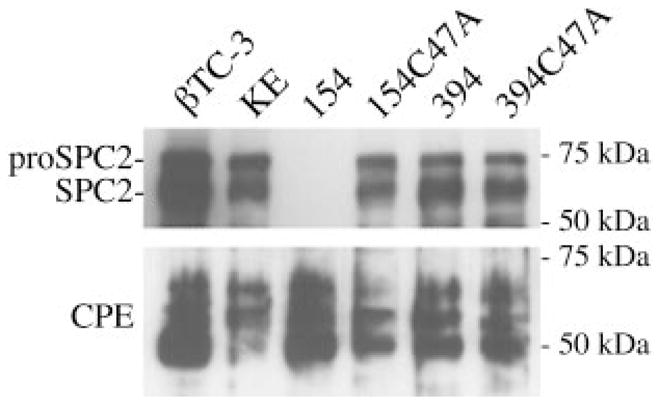
Upper panel, proteins corresponding to the pro- and mature SPC2 enzymes (75 and 68 kDa, respectively) are shown. Lower panel, major bands (50 –56 kDa) corresponding to CPE are represented. Lanes are as follows: βTC3 cells, untransfected control cell line; KE, transfected with vector without the ribozyme minigene; 154, transfected with SPC2-ribozyme; 154C47A, transfected with SPC2-ribozyme with a point mutation; 394, transfected with SPC2-ribozyme (inaccessible cleavage site); 394C47A, transfected with same ribozyme as 394 with a point mutation.
Pro-Dyn is the precursor of opioid peptides (28) with leucine-enkephalin extended sequences such as Dyn A-(1–17), Dyn A-(1–8), Dyn B-(1–13), and α-neo-endorphin (αNE; Fig. 7A). The formation of Dyn A-(1–8) is specifically due to the cleavage of its precursor Dyn A-(1–17) by SPC2 (24). The production of the Dyn A-(1–8) is an exclusive character of the βTC-3 cells (4), and as a consequence, inhibition of the enzyme can be monitored by analysis of this peptide in crude protein extracts by RIA. Dyn A-(1–8) was detected in untransfected βTC-3 cells as well as in cell line 394 (714 ± 40 and 555 ± 10 fmol/mg, respectively) but not in the cell line 154. This result indicates a serious reduction in the SPC2 protein levels. Moreover, Dyn A-(1–8) immunoreactivity (IR) was fractionated by RP-HPLC (Fig. 7). The βTC-3 and 394 cell lines showed a Dyn A-(1–8) IR peak that eluted with a retention time identical to the corresponding synthetic peptide (Fig. 7, B and C). No Dyn A-(1–8) IR was observed in cell line 154, even when 10 times more protein was loaded on the column than in the other cell lines analyzed (0.5 mg for cell line 154 and 50 μg for cell lines βTC-3 and 394; Fig. 7D). Because the sensitivity of this assay is very high (femtomoles), these results confirm the absence of any active SPC2 in cell line 154. This is in agreement with SPC2-null mice study (29), confirming that the presence of Dyn A-(1–8) is specifically due to SPC2 cleavage activity on its precursor Dyn A-(1–17).
Fig. 7. RP-HPLC analysis of cellular extracts for their Dyn A-(1–8) IR content.
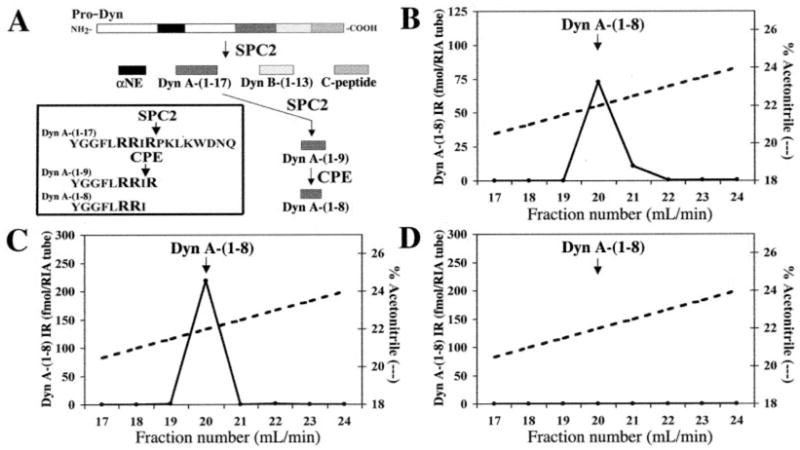
A, schematic representation of pro-Dyn processing by SPC2, SPC3, and CPE producing either α-neo-endorphin, Dyn A-(1–17), Dyn B-(1–13), C-peptide, Dyn A-(1–9), or Dyn A-(1–8). In the inset, basic amino acids found at the cleavage sites of Dyn A-(1–17) as shown. Total protein extracts from untransfected βTC-3, 394, and 154 cell lines were submitted to RP-HPLC (B–D, respectively). 50 μg of total proteins was injected for βTC-3 and 394-1 and 0.5 mg for cell line 154. The values are expressed on the ordinate as femtomoles per RIA tube. The gradient used for the RP-HPLC analysis is indicated (dashed lines) as percentage of ACN (ordinate axis on the right). The arrows indicate the elution position of a standard peptide (14 min, 22% ACN).
Biochemical Assessment of SPC2 Inactivation by Mass Spectrometry
Finally, pro-Dyn-derived peptides in both the 154 and control cell lines were examined. Cellular peptide extracts were pre-purified by Sep-Pak and HPLC separation on a C18 column. The resulting fractions were subjected to an analysis that included two steps, i.e. DIA tests with pro-Dyn antibodies and MALDI analysis of the positive fractions. Typical mass spectra of two fractions are illustrated in Fig. 8. In the control cell line, the ionic species at m/z 3982.1 and m/z 1227.5 correspond to the M+H+ ion of Dyn AB and the αNE peptides, respectively (Fig. 8, A and B). These peptides were expected because they are produced by the action of the SPC2. Conversely, these peaks were not detected in any fractions analyzed from the extract of the SPC2-inactivate cells (cell line 154; raw data not shown). Moreover, five pro-Dyn C-terminally derived peptides covering αNE to the C-terminal peptide were detected in other fraction analyses from the control βTC-3 cells, whereas none of these processed forms could be detected in the 154 cell line (data not shown). Thus, these results confirmed the efficient action of the δRz targeting the SPC2 mRNA. More important, it demonstrated that the 154 cells coupled to the proteomic approach constitute a unique tool for the study of the molecular mechanism of SPC2 and more specifically the identification of other natural substrate(s). This hypothesis received physical support from the analyses of other HPLC fractions allowing the detection of two peptides at m/z 4724.43 and m/z 1785.89 solely in the control cell line but not in the 154 cells (data not shown). These peptides corresponded to the fragments from positions 527–568 and 598 –612 of the secretogranin II, indeed suggesting that this is a substrate of SPC2.
Fig. 8. Typical MALDI-time of flight mass spectra.
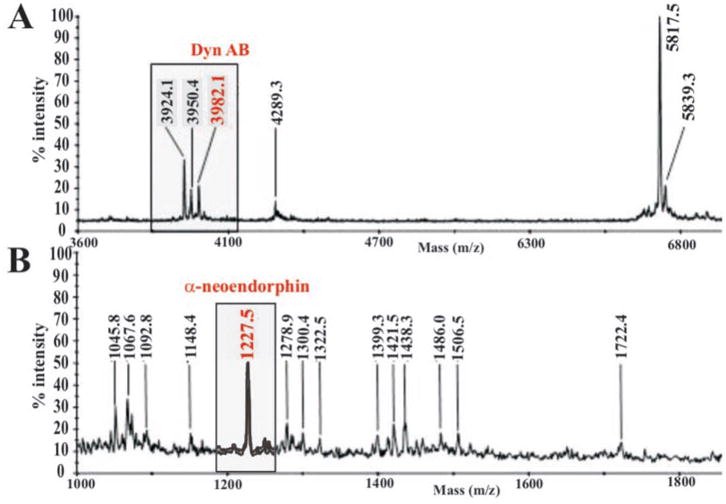
These spectra were recorded in the positive linear delayed extraction mode of HPLC collected fractions eluted at 35 and 31% (A and B, respectively) of control cell line. Peaks absent for the 154 cell line fraction analysis are illustrated in red.
DISCUSSION
We present the original and unambiguous demonstration that δRz is an efficient gene silencing tool. No detectable levels of Dyn A-(1–8) in the 154 cell line were observed, whereas pro-Dyn mRNA expression was maintained. We believe that Dyn A-(1–8) production was completely halted in that cell line, as the RIA is highly sensitive, and we loaded 10 times more protein than in the control in the HPLC experiment, confirming the absence of the highly expressed SPC2 (4). Moreover, we accumulated data suggesting that the δRz action was durable, because the gene silencing effect could be observed even after more than 15 passages without any phenotypical changes. Furthermore, electron microscopy confirmed that secretory granules, related to the endocrine phenotype, were not disturbed (Fig. 5). Overall, these data confirmed the effectiveness and the maintained effect of the δRz approach for gene silencing in cultured cells.
We used an expression vector based on the tRNAVal as promoter for the RNA pol III to establish βTC-3 stable cell lines, because it allows efficient transcription as well as proper localization of the δRz in the cytoplasm (15). Thus, this promoter was very attractive for our study because it ensured that the δRz is co-localized with its target. As a screening method, we used a primer extension approach in order to select cell lines that expressed the tRNAVal-δRz transcript, because levels varied among clones (Fig. 3C). This selection was essential because the expression level of the targeted mRNA was conversely proportional to the level of tRNAVal-δRz. Thus, of the 15 established cell lines, 5 exhibited a high level of ribozyme expression. Additionally, it was observed that the mRNA expression levels in transfected βTC-3 extracts varied. This suggests that the RNA pol III promoter influenced (positively or negatively) expression levels of either targeted or not mRNAs (Fig. 4), because it plays significant roles in the transcription of essential and small RNAs (e.g. tRNA and small nuclear RNA). Thus, the transfection may have altered normal cell functioning. However, variations in the abundance of the non-targeted SPC mRNAs may also be the result of compensatory actions of other SPCs. Further experiments are underway to explain these observations and to design alternative expression vectors based on other promoters.
Despite these variations, it is evident that the addition of a catalytically active δRz resulted in a significant block in the expression of the target. Some potential limits, such as the possible cleavages on other mRNAs, still need to be examined. These cleavages can occur because the δRz discriminates its target from other mRNAs with its 7-nt-long P1 stem. However, δRz does not derive its specificity solely from the length of the P1 stem (13). The sequence upstream of the cleavage site (i.e. positions −4 to −1) was also shown to contribute significantly to the cleavage ability of a substrate (25). This increases the substrate specificity to 11 consecutive nucleotides. Moreover, the probability of finding other mRNAs with δRz-accessible complementary sequences is very low. This is well illustrated with the δRz-394 that cleaved in vitro the partial SPC2 mRNA but not the full-length in vivo. According to the primer extension assays and Northern blot hybridizations performed for these two ribozymes, neither their level of expression nor their stability accounted for their variable cleavage activity. The ribozymes harboring the mutation C47A (i.e. a single point mutation) exhibited no effect at all; as a consequence, reduced levels of SPC2 mRNA must be the result of an action of the ribozyme. Furthermore, both ribozymes will be retrieved in the cytoplasm because they are both into a chimeric RNA molecule with the tRNAVal that is responsible for their cellular localization (15). Therefore, the only possibility for a difference between the δRz-154 and -394 is the accessibility of the targeting site (because Fig. 3C showed its expression). This is most likely due to a secondary structure of the mRNA at or near the cleavage site that was not present in the partial mRNA used for in vitro tests. However, this does not excluded the possibility that in vivo proteins bind the mRNA differentially at the two sites. New design strategies are actually developed to ensure a better accessibility of the targeted site in vivo. Thus, considering the natural adaptability of δRz to the human cell, which was recently shown by its outstanding stability in mammalian cells (30), this ribozyme appears to be an interesting molecular tool.
Mass spectrometry allowed both the detection and identification of the dynorphin fragments in control cells, whereas it is absent in the inactivated 154 cells. The preliminary analysis of HPLC fractions confirmed that the secretogranin II was a natural substrate of SPC2, as proposed previously in a study using a stable cell line expressing exogenous SPC2 (31). Thus, our approach leads to the identification of a natural substrate specific for SPC2, because other convertases (including the endocrine-related SPC3) were still present. These results led us to confirm the notion that the SPC2 is specialized in the processing of the small peptides. This study also exposes the high potential of this endocrine cellular model for the discovery of new SPC2 natural substrates by mass spectrometry analysis. Moreover, the 154 cells could be used to understand the implication of SPC2 in cellular biology studies (e.g. protein trafficking, stress response) or in processing studies of potential exogenous substrates. More generally, this work may constitute a breakthrough for the field because it offers a novel, specific, and lasting approach amenable for any protease of pharmacological interest.
Acknowledgments
We thank Xue Wen Yuan and Carine Losito for their technical assistance. The RNA group is supported by grants from the Canadian Institutes of Health Research. We also thank the Geno-pole of Lille and the Proteomic platform of the University of Lille I.
Footnotes
The abbreviations used are: SPC, subtilase-like pro-protein convertase; CPE, carboxypeptidase E; DIA, dot immunobinding assay; Dyn, dynorphin; HCCA, α-cyano-4-hydroxycinnamic acid; IR, immunoreactivity; MALDI, matrix-assisted laser desorption/ionization; αNE, α-neo-endorphin; nt, nucleotide; ODN, oligodeoxynucleotide; pro-Dyn, pro-dynorphin; RIA, radioimmunoassay; RNA pol III, RNA polymerase III; RP-HPLC, reverse phase-high pressure liquid chromatography; δRz, δ ribozyme; CMV, cytomegalovirus; ACN, acetonitrile.
This work was supported in part by grants from the Canadian Institutes of Health Research (to J.-P. P. and R. D.), Health Canada (to J.-P. P.), the CNRS (to I. F. and M. S.), the Ministere de l’Éducation Nationale, de la Recherche et des Technologies (to I. F. and M. S.), and the Fondation pour la Recherche Médicale (to I. F.).
References
- 1.Bergeron F, Leduc R, Day R. J Mol Endocrinol. 2000;24:1–22. doi: 10.1677/jme.0.0240001. [DOI] [PubMed] [Google Scholar]
- 2.Chan SJ, Oliva AA, Jr, LaMendola J, Grens A, Bode H, Steiner DF. Proc Natl Acad Sci U S A. 1992;89:6678 –6682. doi: 10.1073/pnas.89.15.6678. [DOI] [PMC free article] [PubMed] [Google Scholar]
- 3.Day R, Schafer MK, Watson SJ, Chretien M, Seidah NG. Mol Endocrinol. 1992;6:485–497. doi: 10.1210/mend.6.3.1316544. [DOI] [PubMed] [Google Scholar]
- 4.Vieau D, Seidah NG, Day R. Endocrinology. 1995;136:1187–1196. doi: 10.1210/endo.136.3.7867572. [DOI] [PubMed] [Google Scholar]
- 5.Furuta M, Carroll R, Martin S, Swift HH, Ravazzola M, Orci L, Steiner DF. J Biol Chem. 1998;273:3431–3437. doi: 10.1074/jbc.273.6.3431. [DOI] [PubMed] [Google Scholar]
- 6.Zhu X, Orci L, Carroll R, Norrbom C, Ravazzola M, Steiner DF. Proc Natl Acad Sci U S A. 2002;16:10299–10304. doi: 10.1073/pnas.162352799. [DOI] [PMC free article] [PubMed] [Google Scholar]
- 7.Taylor NA, Van de Ven WJM, Creemers JWM. FASEB J. 2003;17:1215–1227. doi: 10.1096/fj.02-0831rev. [DOI] [PubMed] [Google Scholar]
- 8.Fugere M, Day R. Curr Pharm Des. 2002;8:549 –562. doi: 10.2174/1381612023395736. [DOI] [PubMed] [Google Scholar]
- 9.Hannon GJ. Nature. 2002;418:244 –251. doi: 10.1038/418244a. [DOI] [PubMed] [Google Scholar]
- 10.Lebedeva I, Stein CA. Annu Rev Pharmacol Toxicol. 2001;41:403–419. doi: 10.1146/annurev.pharmtox.41.1.403. [DOI] [PubMed] [Google Scholar]
- 11.Ananvoranich S, Perreault JP. J Biol Chem. 1998;273:13182–13188. doi: 10.1074/jbc.273.21.13182. [DOI] [PMC free article] [PubMed] [Google Scholar]
- 12.Shih IH, Been MD. Annu Rev Biochem. 2002;71:887–917. doi: 10.1146/annurev.biochem.71.110601.135349. [DOI] [PubMed] [Google Scholar]
- 13.Bergeron LJ, Ouellet J, Perreault JP. Curr Med Chem. 2003;10:2589 –2597. doi: 10.2174/0929867033456486. [DOI] [PMC free article] [PubMed] [Google Scholar]
- 14.Bergeron LJ, Perreault JP. Nucleic Acids Res. 2002;30:4682–4691. doi: 10.1093/nar/gkf598. [DOI] [PMC free article] [PubMed] [Google Scholar]
- 15.Kato Y, Kuwabara T, Warashina M, Toda H, Taira K. J Biol Chem. 2001;276:15378 –15385. doi: 10.1074/jbc.M010570200. [DOI] [PubMed] [Google Scholar]
- 16.Al-Anouti F, Ananvoranich S. Antisense Nucleic Acid Drug Dev. 2002;12:275–281. doi: 10.1089/108729002320351593. [DOI] [PubMed] [Google Scholar]
- 17.Thompson JD, Higgins DG, Gibson TJ. Nucleic Acids Res. 1994;22:4673–4680. doi: 10.1093/nar/22.22.4673. [DOI] [PMC free article] [PubMed] [Google Scholar]
- 18.Mathews DH, Sabina J, Zuker M, Turner DH. J Mol Biol. 1999;288:911–940. doi: 10.1006/jmbi.1999.2700. [DOI] [PubMed] [Google Scholar]
- 19.Mathews DH, Burkard ME, Freier SM, Wyatt JR, Turner DH. RNA (New York) 1999;5:1458 –1469. doi: 10.1017/s1355838299991148. [DOI] [PMC free article] [PubMed] [Google Scholar]
- 20.Joshi D, Miller MM, Seidah NG, Day R. Endocrinology. 1995;136:2721–2729. doi: 10.1210/endo.136.6.7750497. [DOI] [PubMed] [Google Scholar]
- 21.Seidah NG, Hamelin J, Mamarbachi M, Dong W, Tardos H, Mbikay M, Chretien M, Day R. Proc Natl Acad Sci U S A. 1996;93:3388 –3393. doi: 10.1073/pnas.93.8.3388. [DOI] [PMC free article] [PubMed] [Google Scholar]
- 22.Fricker LD, Adelman JP, Douglass J, Thompson RC, von Strandmann RP, Hutton J. Mol Endocrinol. 1989;3:666 –673. doi: 10.1210/mend-3-4-666. [DOI] [PubMed] [Google Scholar]
- 23.Benjannet S, Rondeau N, Paquet L, Boudreault A, Lazure C, Chretien M, Seidah NG. Biochem J. 1993;294:735–743. doi: 10.1042/bj2940735. [DOI] [PMC free article] [PubMed] [Google Scholar]
- 24.Day R, Lazure C, Basak A, Boudreault A, Limperis A, Dong W, Lindberg I. J Biol Chem. 1998;273:829 –836. doi: 10.1074/jbc.273.2.829. [DOI] [PubMed] [Google Scholar]
- 25.Deschênes P, Lafontaine DA, Charland S, Perreault JP. Antisense Nucleic Acid Drug Dev. 2000;10:53–61. doi: 10.1089/oli.1.2000.10.53. [DOI] [PubMed] [Google Scholar]
- 26.Fricker LD. Annu Rev Physiol. 1988;50:309 –321. doi: 10.1146/annurev.ph.50.030188.001521. [DOI] [PubMed] [Google Scholar]
- 27.Lamango NS, Zhu X, Lindberg I. Arch Biochem Biophys. 1996;330:238 –250. doi: 10.1006/abbi.1996.0249. [DOI] [PubMed] [Google Scholar]
- 28.Civelli O, Douglass J, Goldstein A, Herbert E. Proc Natl Acad Sci U S A. 1985;82:4291–4295. doi: 10.1073/pnas.82.12.4291. [DOI] [PMC free article] [PubMed] [Google Scholar]
- 29.Berman Y, Mzhavia N, Polonskaia A, Furuta M, Steiner DF, Pintar JE, Devi LA. J Neurochem. 2000;75:1763–1770. doi: 10.1046/j.1471-4159.2000.0751763.x. [DOI] [PubMed] [Google Scholar]
- 30.Levesque D, Choufani S, Perreault JP. RNA (New York) 2002;8:464 –477. doi: 10.1017/s1355838202020289. [DOI] [PMC free article] [PubMed] [Google Scholar]
- 31.Dittie AS, Tooze SA. Biochem J. 1995;310:777–787. doi: 10.1042/bj3100777. [DOI] [PMC free article] [PubMed] [Google Scholar]


