

Abstract
Background
Endoscopic surveillance of presumed-benign gastric ulcers may detect missed malignancy, but its impact on long-term outcomes is uncertain.
Objective
To estimate the clinical benefits and cost-effectiveness of follow-up surveillance.
Design
State-transition model.
Setting
To simulate the clinical course of presumed-benign gastric ulcers, we estimated prevalence and incidence of undetected gastric cancer, surveillance effectiveness, stage-specific disease mortality rates, and costs from clinical studies and databases.
Patients
60-year-old men diagnosed with presumed-benign gastric ulcers.
Intervention
Follow-up endoscopic surveillance.
Main outcome measurements
Lifetime gastric cancer risk, life expectancy, quality-adjusted life expectancy, lifetime costs, and incremental cost-effectiveness ratios.
Results
For a cohort of 60-year-old men with presumed-benign gastric ulcers and a 2.6% prevalence of undetected malignancy, the lifetime gastric cancer risk was 4.4%. Surveillance improved (undiscounted) life expectancy by 10.0 days, and increased discounted quality-adjusted life expectancy by 3.4 days at a cost of $146,700 per quality-adjusted life year (QALY). Surveillance cost less than $50,000 per QALY if undetected gastric cancer prevalence was 6.5%, and less than $100,000 per QALY if prevalence was greater than 3.5%, endoscopy costs were 40% lower, or the disutility associated with gastric cancer was 30% lower. Probabilistic sensitivity analysis suggested that at a willingness-to-pay threshold of $100,000 per QALY, the probability that surveillance was cost-effective was 25.2%.
Limitations
Data from multiple sources with varied study designs were used.
Conclusions
Endoscopic surveillance of presumed-benign gastric ulcers may improve overall survival. However, unless the prevalence of having undetected malignancy exceeds 6%, surveillance is unlikely to be cost-effective.
Keywords: Gastric cancer, gastric ulcer, surveillance, cost-effectiveness, survival
Introduction
Gastric cancer is the second leading cause of cancer-related deaths, responsible for an estimated 700,000 deaths worldwide each year.1 While the incidence has declined in the U.S. over the past several decades, the prognosis for the disease remains poor given its high case fatality rate and limited treatment options. Survival rates vary by stage at detection. The five-year survival rate for patients diagnosed with metastatic cancer is less than 5%. In contrast, more than 60% of patients with localized diseased are alive 5 years after diagnosis.2 Management strategies that can effectively detect gastric cancer at earlier stages can potentially improve overall survival.
Clinical studies suggest that endoscopically-diagnosed benign-appearing gastric ulcers may mask underlying malignancy.3-9 As gastric ulcer patients are also at elevated risk for developing gastric cancer,10 patients diagnosed with benign ulcers typically undergo routine follow-up endoscopic surveillance to detect potentially missed malignancy. While recommended, the long-term effect on overall survival is uncertain. A recent clinical study suggests that gastric cancers detected during follow-up gastric ulcer surveillance may be diagnosed at earlier stages compared to cancers detected clinically via symptoms.11 While none of the major U.S. professional gastroenterology societies specifically recommend surveillance of presumed benign gastric ulcers, an estimated 33% of patients undergo surveillance within 6 months of diagnosis.12 The long-term impact of surveillance on health and economic outcomes is unclear and accompanied by rising concerns of overutilization.
By synthesizing the best available biologic, epidemiologic and economic data in a decision analytic framework, we assessed the clinical benefits and cost-effectiveness of endoscopic surveillance of presumed benign gastric ulcers to improve survival.
Methods
Analytic Overview
We developed a decision-analytic model to compare the clinical benefits, costs and cost-effectiveness associated with esophagogastroduodenoscopy (EGD) surveillance after initial gastric ulcer diagnosis to improve survival (Fig 1). The model simulates the clinical events of patients diagnosed with presumed benign gastric ulcers based on appearance and negative biopsy results. Transition probabilities, cost estimates and health-related quality weights were based on the best available data after reviewing the published literature and databases (Table 1). 2-4, 7, 8, 10, 11, 13-24
Fig 1. Markov state diagram for a cohort diagnosed with a presumed benign gastric ulcer 3 months prior.
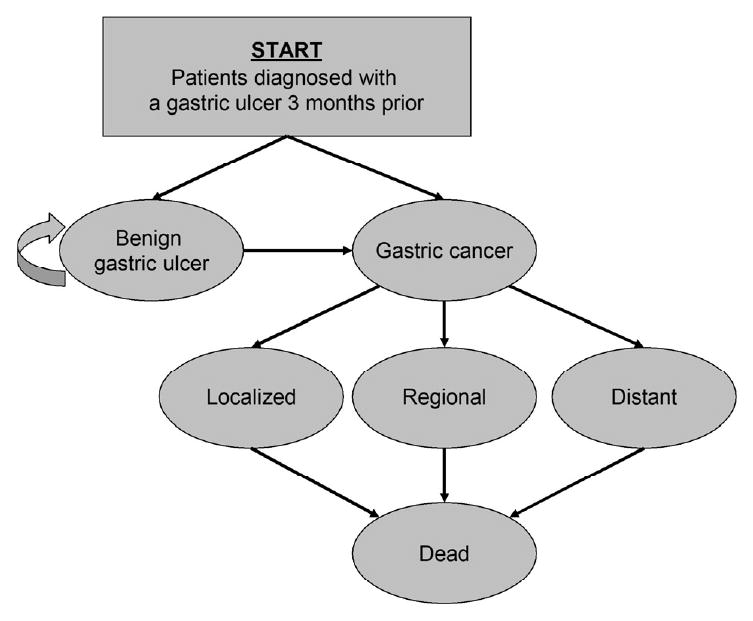
At the start of the simulation, a cohort enters the model and is distributed among the health states based on the prevalence of undetected gastric cancer. Each month, individuals transition among the health states based on age- and sex-specific probabilities. Once gastric cancer becomes clinically symptomatic, individuals face stage-specific disease mortality risks. All individuals face a risk of dying from all other causes.
Table 1.
Select model inputs: base case and plausible range
| Variables | Base Case | Range | Reference |
|---|---|---|---|
| Clinical | |||
| Prevalence of gastric cancer, % | 2.6 | 1.4-8.5 | 3, 4, 7, 8 |
| Monthly probability of developing gastric cancer | 0.0000-0.0001 | * | 2 |
| Relative risk among patients with gastric ulcers | 1.6-2.2† | 1.5-11.1 | 10 |
| Endoscopic test characteristics for gastric cancer | |||
| Sensitivity | 0.81 | 0.78-0.95 | 13, 14 |
| Specificity | 1.00 | 0.98-1.00 | 13, 14 |
| Endoscopy complications, % | |||
| Bleeding | 0.0011 | 0.0003-0.0012 | 15, 16 |
| Perforation | 0.0009 | 0.0003-0.0012 | 15, 16 |
| Proportion requiring surgery | 0.50 | 0.0-1.0 | ‡ |
| Stage distribution, § | |||
| No surveillance | 11 | ||
| Localized | 0.18 | --- | |
| Distant | 0.59 | --- | |
| EGD surveillance | 11 | ||
| Localized | 0.42 | ‖ | |
| Distant | 0.42 | ‖ | |
| Mortality | |||
| Five-year gastric cancer survival rate, % | 2 | ||
| Local | 59.4 | --- | |
| Regional | 22.0 | --- | |
| Distant | 3.3 | --- | |
| Surgical mortality risk, % | 6.2 | ‖ | 17 |
| Yearly all-cause mortality rate | 0.0001-0.0296 | * | 18 |
| Direct medical costs, U.S. $ (2007) | |||
| Endoscopy and biopsy evaluation | 871 | ¶ | 19 |
| Bleeding complications | 19,040 | ¶ | 19 |
| Perforation complications | 19,040 | ¶ | 19 |
| Gastrectomy | 28,770 | ¶ | |
| Gastric cancer treatment, per year** | 20 | ||
| Localized | 1,940-39,240 | ¶ | |
| Regional | 1,940-57,040 | ¶ | |
| Distant | 1,940-52,702 | ¶ | |
| Indirect costs, U.S. $ (2007) | |||
| Median hourly wage | 15.1 | 10.1-23.9 | 21 |
| Lost time, hours | |||
| Endoscopy | 8 | ‖ | ‡ |
| Surgery | 80 | ‖ | ‡ |
| Gastric cancer treatment, per year** | 351-512 | ‖ | 22 |
| Quality of life | |||
| Age-related quality weight, utility* | 0.782-0.928 | --- | 23 |
| Utility reductions | |||
| Endoscopy | -1 day | ‖ | ‡ |
| Gastrectomy | -2 weeks | ‖ | ‡ |
| Cancer-related quality weight, utility | |||
| Gastric cancer | 0.49 | ‖ | 24 |
EGD=esophagogastroduodenoscopy
Age- and sex-specific.
Sex-specific.
Based on expert opinion.
Proportion of regional lesions = proportionregional = 1 − proportionlocalized − proportiondistant.
Varied base case value ±25% in sensitivity analysis.
Varied base case value by 50% to 200% in sensitivity analysis.
Specific to initial, continuation or last phase of treatment.
Plausible ranges were established by selecting the highest and lowest values among all available studies or data sources. Outcomes included the lifetime gastric cancer risk, life expectancy, quality-adjusted life expectancy and lifetime costs. To assess the comparative performance of various strategies, we calculated incremental cost-effectiveness ratios (ICERs), defined as the additional cost of a specific strategy divided by its additional clinical benefit, compared with the next least expensive strategy. We adopted a societal perspective and discounted all costs and clinical consequences at a rate of 3% per year as recommended by the U.S. Panel of Cost-Effectiveness in Health and Medicine.25 Costs are expressed in 2007 dollars. To assess the impact of parameter uncertainty, we conducted deterministic and probabilistic sensitivity analyses.
Markov Model
We developed a Markov state-transition model to estimate the lifetime prognosis of patients originally diagnosed with a presumed benign gastric ulcer 3 month prior. At the start of the simulation, a representative cohort of men enters the model and is distributed among the health states based on the prevalence of undetected gastric cancer during initial endoscopy (the cohort does not include individuals for which cancer is clinically detected during initial EGD). For the base case, the cohort consists of 60-year olds, the approximate median age of a clinical study upon which we based the prevalence of undetected gastric cancers.3 Health states include no gastric cancer, clinically undetected gastric cancer, clinically detected gastric cancer at localized, regional and distant stages, and death. Each month, individuals transition among the health states based on probabilities that are age- and sex-specific. Individuals with no cancerous lesions face a risk of developing gastric cancer based on sex- and age-specific gastric cancer incidence from the Surveillance, Epidemiology and End Results (SEER) Program,2 adjusted to reflect the elevated risk among gastric ulcer patients.10 Once gastric cancer becomes clinically symptomatic, individuals face stage-specific disease mortality risks. All individuals face a risk of dying from all other causes based on U.S. life tables.18 The model is run separately for cohorts of men and women.
EGD Surveillance Strategy
Compared to no surveillance, we evaluated EGD surveillance which consisted of a single follow-up endoscopy, to detect gastric cancer previously missed or masked by a gastric ulcer. Three months after initial diagnosis, we assumed that all patients with presumed benign, non-bleeding gastric ulcers would undergo EGD, and in accordance with the updated Sydney classification system,26 five biopsies would be taken to evaluate the ulcer and other visible lesions for malignancy. We assumed that patients with bleeding ulcers would seek medical care for symptoms and would be ineligible for routine follow-up EGD surveillance. Using data from a clinical study on patients with presumed benign gastric ulcers (based on appearance and negative biopsy results) and who underwent at least one follow-up endoscopy, we estimated that compared to no surveillance, (1) the proportion of cancers diagnosed at stage I and II (TMN classification) was greater (41.7% combined vs. 17.9% combined) and (2) the proportions at stages III (16.6% vs. 23.0%) and IV (41.7% vs. 59.1%) were lower.11 These cancers were either missed or masked cancerous lesions at time of original diagnosis, or existing precancerous lesions, such as dysplasia, which then progressed to invasive cancer between original diagnosis and follow-up endoscopy. Upon detection of cancer, patients were referred to a gastrointestinal surgeon for treatment. We assumed that at the time of original diagnosis, all surveillance patients received acid-suppressive medication, were evaluated and successfully treated for Helicobacter pylori infection, and had ulcers that were not suspected to be precipitated by nonsteroidal anti-inflammatory drugs (NSAIDs). Since a proportion of patients will experience clinically relevant complications from endoscopy, such as bleeding or perforation,15, 16 we assumed that 50% of these patients would require surgery and face a risk of surgical mortality, and varied this assumption in sensitivity analysis.17
Other Clinical Data
Other clinical data, including prevalence of undetected gastric cancer, biopsy test sensitivity and specificity, and stage-specific disease mortality rates, were obtained from the published literature (Table 1). We used age-specific quality of life weights derived from population-based data23 and weights for symptomatic gastric cancer24 to estimate quality-adjusted life years (QALYs). For endoscopic and surgical procedures, we assumed a 50% reduction in quality of life for 1 day and 2 weeks, respectively.
Cost Data
Direct medical costs associated with surveillance and gastric cancer treatment were based on 2007 U.S. average Medicare reimbursement rates19 and the published literature. Costs included physician costs, pathologist costs (for biopsy evaluation), and facilities and/or hospitalization costs for endoscopic procedures, complications and surgery. Stage-specific cancer treatment costs were based on a published analysis of SEER patients.20 Indirect patient costs were based on estimates of time lost from work and the 2007 median hourly wage from the US Bureau of Labor Statistics.21 We assumed 1 day of time lost from work for endoscopic procedures and 2 weeks for surgery, and based stage-specific time lost from work for gastric cancer treatment on an analysis of SEER patients.22
Sensitivity Analysis
We performed sensitivity analyses to evaluate the impact of alternative assumptions and uncertainty on our results, including the elevated risk for gastric cancer among patients who remain H. pylori-positive despite antibiotic treatment at time of original ulcer diagnosis.27 For univariate sensitivity analysis, in which one parameter was varied while all other parameters were held constant, the plausible range for each parameter was based on upper and lower bound estimates identified in the published literature. We also conducted a two-way sensitivity analysis on cohort age and prevalence of undetected gastric cancer to provide insight on how results varied by subgroup. To more fully account for uncertainty in our findings, we conducted a probabilistic sensitivity analysis using 1000 second-order Monte Carlo simulations in which each model parameter was simultaneously varied. We assigned distributions based on the nature of the data informing parameter estimates (Table 2). 2, 3, 10, 11, 13, 15, 17, 20-22, 24 For probabilities, we used beta distributions based on the observed proportions of the event of interest (i.e. the number of successfully treated cases). For resource use, indirect costs and disutility weights, we used normal distributions. Because unit costs (e.g. cost of endoscopy) were based on Medicare reimbursement rates, we assumed these costs were deterministic and did not ascribe distributions.28
Table 2.
Distributions used in probabilistic sensitivity analysis
| Variable | Distribution | Mean | SD | Reference |
|---|---|---|---|---|
| Clinical | ||||
| Prevalence of gastric cancer, % | Beta | 2.6 | 1.5 | 3 |
| Relative risk among gastric ulcer patients | 10 | |||
| Men | Normal | 1.6 | 0.15 | |
| Women | Normal | 2.2 | 0.23 | |
| Endoscopy for dysplasia and gastric cancer | ||||
| Sensitivity | Beta | 0.81 | 0.014 | 13 |
| Specificity | Beta | 1.00 | 0.000 | |
| Endoscopic complications | ||||
| Bleeding | Beta | 0.001 | 0.000 | 15 |
| Perforation | Beta | 0.001 | 0.000 | |
| Stage distribution, %* | ||||
| No surveillance | 11 | |||
| Localized | Beta | 0.18 | 0.02 | |
| Distant | Beta | 0.59 | 0.03 | |
| EGD surveillance | 11 | |||
| Localized | Beta | 0.42 | 0.14 | |
| Distant | Beta | 0.42 | 0.14 | |
| Mortality | ||||
| 5-year gastric cancer mortality risk,% | 2 | |||
| Localized | Beta | 40.6 | 8.4 | |
| Regional | Beta | 78.0 | 5.9 | |
| Distant | Beta | 96.7 | 2.5 | |
| Surgical mortality risk. % | Beta | 6.2 | 3.7 | 17 |
| Direct medical costs, $ | ||||
| Gastric cancer treatment, per year | 20 | |||
| Initial year | ||||
| Localized | Normal | 3270 | 146 | |
| Regional | Normal | 4753 | 177 | |
| Distant | Normal | 4399 | 282 | |
| Continuing | Normal | 164 | 23 | |
| Last year | ||||
| Localized | Normal | 3775 | 144 | |
| Regional | Normal | 4347 | 119 | |
| Distant | Normal | 6536 | 167 | |
| Indirect medical costs | ||||
| Median hourly wage, $ | Normal | 15.1 | 7.20 | 21 |
| Lost time for gastric cancer treatment, hours | 22 | |||
| Initial | Normal | 29.3 | 1.0 | |
| Final | Normal | 42.7 | 1.0 | |
| Quality of life, % | ||||
| Utility reduction for procedures | Normal | 0.5 | 0.13 | † |
| Gastric cancer-related quality weight | Normal | 0.49 | 0.16 | 24 |
EGD=esophagogastroduodenoscopy
Proportion of regional lesions = proportionregional = 1 − proportionlocalized − proportiondistant.
We assumed a standard deviation of ± 0.13.
Results
Lifetime gastric cancer risk and mortality
For a cohort of 60-year old men previously diagnosed with presumed benign gastric ulcers and a 2.6% prevalence of undetected gastric cancer, the lifetime risk of gastric cancer was 4.4%. This risk is approximately 3.6-fold higher than the risk for like-aged individuals of the general population.2 Prevalent gastric cancer cases previously undetected (versus incident cases) accounted for majority of overall risk (58%). Follow-up EGD surveillance increased (undiscounted) life expectancy by 10.0 days (0.1%; see Table 3). For a similar cohort of 60-year of women, the lifetime risk was 4.1%.
Table 3.
Cost-effectiveness results
| Subgroup | Strategy | Undiscounted life expectancy, years | Incremental undiscounted life expectancy, days | Discounted QALE, years | Incremental discounted QALE, days | Discounted lifetime costs, $ | ICER, $ per QALY | Probability ICER less than 100,000 per QALY* |
|---|---|---|---|---|---|---|---|---|
| Base Case | ||||||||
| 60-year old men | No surveillance | 19.7845 | -- | 11.5434 | 3,430 | -- | ||
| EGD surveillance | 19.7572 | 10.0 | 11.5506 | 2.6 | 4,490 | $146,700 | 0.25 | |
| By cohort age | ||||||||
| 40-year old men | No surveillance | 36.0874 | -- | 18.0343 | -- | 3,120 | -- | |
| EGD surveillance | 36.1198 | 11.8 | 18.0431 | 3.2 | 4,190 | $121,400 | 0.31 | |
| 50-year old men | No surveillance | 27.5579 | -- | 14.9100 | -- | 3,300 | -- | |
| EGD surveillance | 27.5885 | 11.2 | 14.9182 | 3.0 | 4,370 | $129,900 | 0.29 | |
| 70-year old men | No surveillance | 13.0141 | -- | 8.1022 | -- | 3,350 | -- | |
| EGD surveillance | 13.0360 | 8.0 | 8.1078 | 2.0 | 4,400 | $186,500 | 0.17 | |
| 80-year old men | No surveillance | 7.6829 | -- | 5.1023 | -- | 2,990 | -- | |
| EGD surveillance | 7.6977 | 5.4 | 5.1059 | 1.3 | 4,020 | $288,200 | 0.09 | |
| Other cohorts | ||||||||
| 60-year old women | No surveillance | 22.8863 | 13.0646 | -- | 3,220 | -- | ||
| EGD surveillance | 22.8508 | 8.8 | 13.0741 | 3.5 | 4,290 | $113,100 | 0.35 | |
EGD=esophagogastroduodenoscopy; ICER = incremental cost-effectiveness ratio
Based on probabilistic sensitivity analysis using 1000 second-order Monte Carlo simulations.
Cost-effectiveness analysis
Compared to no surveillance, EGD surveillance increased discounted quality-adjusted life expectancy by 2.6 days at a cost of $146,700 per quality-adjusted life year (QALY) for a cohort of 60-year old men (see Table 3). Results varied by cohort age, with surveillance being more attractive for younger individuals (ICER=$121,400/QALY for 40-year old men). For women, the gain in quality-adjusted life days was marginally higher (3.5 days) and surveillance cost $113,100 per QALY.
Results were most sensitive to the prevalence of undetected gastric cancer, cost of endoscopy and biopsies, cohort age, proportion of localized cancers detected with endoscopy, and biopsy specificity (Figure 2). For example, with a biopsy specificity of 0.98, surveillance was less effective and more costly (e.g., dominated) than no surveillance, and resulted in a loss of quality-adjusted life expectancy due to the excess mortality risks and decrease in quality of life associated with endoscopic procedures among false positives. Results were insensitive to biopsy sensitivity, probability of endoscopic complications, proportion of complications requiring surgery, incident gastric cancer risk, and medical and patient costs. For example, if despite receiving antibiotic treatment at time of original diagnosis, patients remained H. pylori-positive and had a 34.5-fold greater risk of developing gastric cancer,27 the ICER for EGD surveillance declined less than 10% to $136,800 per QALY (base case=$146,700 per QALY). Similarly, if the risk of perforation, bleeding or both complications was negligible, or none of the endoscopic complications required surgery, EGD surveillance was still unattractive with ICERs exceeding $130,000 per QALY.
Fig 2. Tornado diagram on sensitivity analysis for select variables.
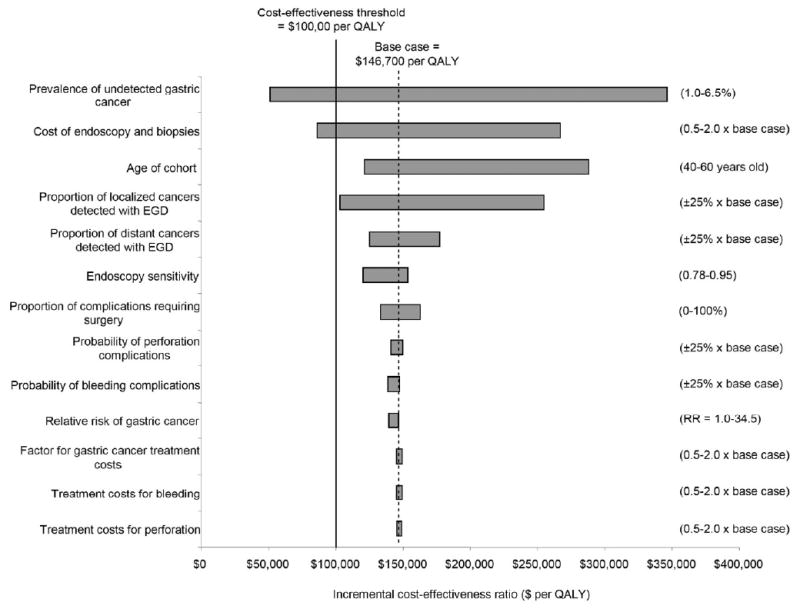
Graph depicts univariate sensitivity analyses for EGD surveillance 3 months after original gastric ulcer diagnosis. Values in parentheses indicate upper and lower bounds for each variable. The vertical dashed line indicates the incremental cost-effectiveness ratio for the base case. Bold line represents the commonly used $100,000 per QALY cost-effectiveness threshold.
We also conducted a series of scenario analyses to evaluate the impact of alternative assumptions on results. If only 5% of patients had biopsies taken which were then evaluated by a pathologist (assuming the rest had completely healed ulcers and did not require biopsies), the ICER remained unattractive at $123,800 per QALY. Similarly, if patients underwent two follow-up endoscopies, and we assumed that undetected gastric lesions did not progress to more advanced stages during the 3 month interval between procedures, the strategy was less attractive despite the greater biopsy sensitivity and specificity (ICER=$229,400). EGD surveillance cost less than $50,000 per QALY if the prevalence of undetected gastric cancer was 6.5%, and less than $100,000 per QALY if the prevalence of undetected gastric cancer was greater than 3.5%, endoscopy costs were 40% lower, or the disutility associated with gastric cancer was 30% lower.
Two-way sensitivity analyses suggest that for cohorts of men between the ages of 40 and 70, the ICER for EGD surveillance was less than $50,000 per QALY if the prevalence of undetected cancer was greater than 8.0% (Figure 3). For all age groups, if the prevalence of undetected cancer was greater than 6%, EGD surveillance had an ICER less than $100,000 per QALY; for younger cohorts, the threshold prevalence was lower at 3%. Figure 4 shows results for probabilistic sensitivity analysis. For a cohort of 60-year old men, probabilistic sensitivity analysis suggested that at a willingness-to-pay threshold of $50,000 per QALY, the probability that EGD surveillance was cost-effective was 6.6%. At a $100,000 per QALY threshold, the probability was 25.2% (Table 2). These results suggest that surveillance is unlikely to be cost-effective. Results were similar for women (data not shown).
Fig 3. Two-way sensitivity analysis on EGD surveillance by cohort age and prevalence of undetected gastric cancer for men.
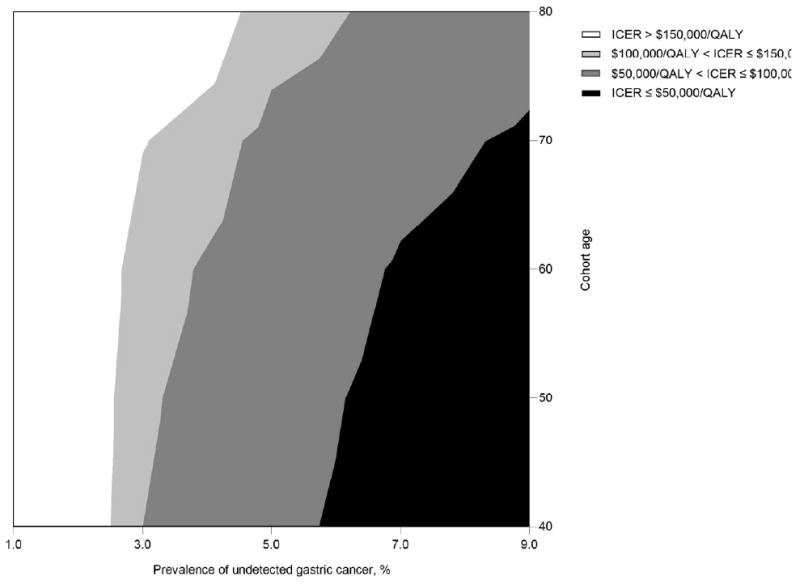
At a $50,000 per QALY threshold, endoscopic surveillance would be considered cost-effective for cohorts with a prevalence of undetected gastric cancer ranging between 5.5% for 40-year old men and 8.0% for 70-year old men. At a $100,000 per QALY threshold, the prevalence of undetected gastric cancer ranged between 3.0% for 40-year old men and 6.0% for 80-year old men.
Fig 4. Probabilistic sensitivity analysis using 1000 Monte Carlo simulations.
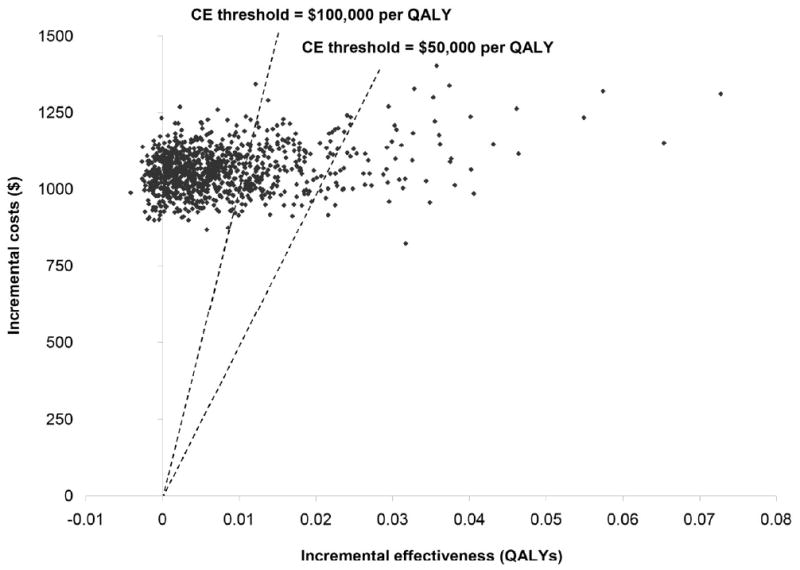
This analysis simultaneously varies parameters over the full range of possible values. Each point represents the ICER generated by one simulation. The dotted lines represent cost-effectiveness thresholds of $50,000 per QALY and $100,000 per QALY. Points below and to the right of the line represent trials that generated an ICER below the specific threshold.
Discussion
Endoscopic surveillance of presumed benign gastric ulcers has the potential to improve survival by detecting cancerous lesions at earlier stages with more favorable prognosis. Using a decision-analytic approach and synthesizing the best available clinical, epidemiologic and economic data, we estimate that surveillance can potentially improve life expectancy by approximately 1 to 2 weeks. The gain in life expectancy varies by age and depends on the risk of having undetected malignancy either missed or masked during initial endoscopy for gastric ulcer diagnosis.
Patients diagnosed with presumed benign gastric ulcers often undergo endoscopic surveillance to detect cancerous growths potentially missed during initial examination. In fact, over half of gastroenterologists surveyed report performing follow-up surveillance in nearly all of their gastric ulcer patients.29 Costs associated with surveillance are estimated to exceed levels at which surveillance would be considered cost-effective relative to its benefits on survival, indicating that at current rates of surveillance, resources spent on surveillance could potentially provide more value if allocated to other gastric cancer prevention or gastric ulcer management efforts. In fact, even with at the willingness-to-pay threshold of $500,000 per QALY, the probability that endoscopic surveillance is cost-effective is only 60-70%, which suggests that the benefits are so small as to potentially fail to overcome the potential harm from complications. Our results do suggest however, that if the risk of harboring undetected malignancy is 6% or higher, surveillance may be considered cost-effective compared to other interventions society has elected to adopt and considered to be good value for resources invested.30 Better characterization of these high risk patients is therefore an important research priority in order to improve short- and long-term patient outcomes.
While we focused on the effectiveness of a single follow-up endoscopy, many patients with presumed benign gastric cancers undergo multiple follow-up endoscopic procedures to rule out malignancy. The benefit of additional surveillance will depend on the progression rate to advanced disease among patients with false-negative biopsies for localized cancer between endoscopies. Because of the high sensitivity of endoscopic biopsies to detect cancer,6, 14, 31 the incremental benefit of multiple endoscopic procedures will likely be small on average, although it will vary among patients given the underlying heterogeneity in disease. More frequent surveillance may be an effective strategy to improve survival among patients with inconclusive biopsies or with large gastric ulcers likely to mask underlying malignancy. In contrast, patients successfully treated for Helicobacter pylori may be at lower risk of disease32, 33 and require only one follow-up endoscopy. Additionally, since gastric ulcer patients are at higher risk of developing incident gastric cancer,10 continued endoscopic surveillance may help to identify new cancers at more treatable stages. Despite the elevated risk however, the lifetime risk of gastric cancer is less than 2% for 60-year old men. The benefits of surveillance may therefore be overshadowed by complications and quality of life decrements associated with endoscopy. Identification of patient characteristics and risk factors associated with a greater likelihood of harboring undetected malignancy and/or a higher risk of future gastric cancer can help to identify higher-risk subgroups for which more intensive surveillance is needed. A better understanding of ways to improve the variability of viewing conditions among patients during initial diagnostic endoscopy can also help to identify subgroups of patients for which surveillance is especially warranted. If no additional follow-up is planned, ensuring the accurate characterization of potential malignancies associated with gastric ulcers through adequate biopsies and histologic interpretation is of paramount importance.
Our analysis has several limitations. We used data from multiple sources with varied study designs. We also based the stage-shift benefit of surveillance on data from a clinical study which reported outcomes using the TNM classification system.11 For comparability with stage-specific gastric cancer costs from SEER, we assumed that stage I and II tumors were equivalent to localized cancers, stage III tumors to regional cancers, and stage IV to distant cancers. We conducted a threshold analysis using stage distribution data from SEER,2 and estimated that for surveillance to be considered cost-effective for our base case cohort of 60-year old men, twice as many cancers would have to be diagnosed at the earlier localized stage (approximately 50% of all detected cancers). In addition, as quality of life associated with gastric cancer likely varies by stage of disease and treatment (i.e., surgery, chemotherapy, palliative), we may have underestimated the benefits of surveillance by assuming the decrement in quality of life was similar for all patients. We also focused solely on the benefits of surveillance on detecting gastric cancer and did not include other potential benefits, such as the detection of dysplasia or other precancerous lesions. In addition, our findings are based on data for U.S. or Western populations for which the risk of gastric cancer is low compared to other parts of the world. The cost-effectiveness of follow-up surveillance will vary by country depending on country-specific risk and costs associated with gastric cancer. Because of the higher risk of developing gastric cancer, surveillance is likely more attractive among older, H. pylori-positive individuals in high-risk countries, such as China or Japan, where lifetime gastric cancer risk is greater than 6%.1, 34 Although we reflected the impact of parameter uncertainty on our results using probabilistic sensitivity analysis, our estimates can be improved with better data on surveillance effectiveness, and our model can be updated as they become available.
In conclusion, our findings suggest that while routine surveillance in patients with presumed benign gastric ulcers exceeds commonly cited thresholds for cost-effectiveness, in those patients at particularly high-risk (e.g., exceeding 6%) it potentially provides good value for resources. Better characterization of high-risk patients can help to identify subgroups for which additional endoscopic surveillance may be effective and promising for secondary cancer prevention.
Acknowledgments
Dr. Yeh is funded by the National Cancer Institute (R25-CA057711).
Acronyms
- EGD
Esophagogastroduodenoscopy
- QALY
Quality-adjusted life year
- ICER
Incremental cost-effectiveness ratio
Footnotes
Disclosures: Authors have no potential conflicts to disclose.
Publisher's Disclaimer: This is a PDF file of an unedited manuscript that has been accepted for publication. As a service to our customers we are providing this early version of the manuscript. The manuscript will undergo copyediting, typesetting, and review of the resulting proof before it is published in its final citable form. Please note that during the production process errors may be discovered which could affect the content, and all legal disclaimers that apply to the journal pertain.
References
- 1.Ferlay J, Bray F, Pisani P, Parkin DM, GLOBOCAN . IARC Cancer Base No 5 Version 2.0. Lyon: IARCPress; 2002. 2004. Cancer Incidence, Mortality and Prevalence Worldwide. [Google Scholar]
- 2.Ries LAG, Eisner MP, Kosary CL, Hankey BF, Miller BA, Clegg L, et al. SEER Cancer Statistics Review, 1975-2000. [January 29, 2009];2007 Available at: http://seer.cancer.gov/csr/1975_2005/
- 3.Bustamante M, Devesa F, Borghol A, Ortuno J, Ferrando MJ. Accuracy of the initial endoscopic diagnosis in the discrimination of gastric ulcers: is endoscopic follow-up study always needed? J Clin Gastroenterol. 2002 Jul;35(1):25–8. doi: 10.1097/00004836-200207000-00007. [DOI] [PubMed] [Google Scholar]
- 4.Thomopoulos KC, Melachrinou MP, Mimidis KP, Katsakoulis EC, Margaritis VG, Vagianos CE, et al. Gastric ulcers and risk for cancer. Is follow-up necessary for all gastric ulcers? Int J Clin Pract. 2004 Jul;58(7):675–7. doi: 10.1111/j.1368-5031.2004.00021.x. [DOI] [PubMed] [Google Scholar]
- 5.Hosokawa O, Watanabe K, Hatorri M, Douden K, Hayashi H, Kaizaki Y. Detection of gastric cancer by repeat endoscopy within a short time after negative examination. Endoscopy. 2001 Apr;33(4):301–5. doi: 10.1055/s-2001-13685. [DOI] [PubMed] [Google Scholar]
- 6.Pruitt RE, Truss CD. Endoscopy, gastric ulcer, and gastric cancer. Follow-up endoscopy for all gastric ulcers? Dig Dis Sci. 1993 Feb;38(2):284–8. doi: 10.1007/BF01307545. [DOI] [PubMed] [Google Scholar]
- 7.Eckardt VF, Giessler W, Kanzler G, Bernhard G. Does endoscopic follow-up improve the outcome of patients with benign gastric ulcers and gastric cancer? Cancer. 1992 Jan 15;69(2):301–5. doi: 10.1002/1097-0142(19920115)69:2<301::aid-cncr2820690205>3.0.co;2-p. [DOI] [PubMed] [Google Scholar]
- 8.Podolsky I, Storms PR, Richardson CT, Peterson WL, Fordtran JS. Gastric adenocarcinoma masquerading endoscopically as benign gastric ulcer. A five-year experience. Dig Dis Sci. 1988 Sep;33(9):1057–63. doi: 10.1007/BF01535778. [DOI] [PubMed] [Google Scholar]
- 9.Yamagata S, Hisamichi S. Precancerous lesions of the stomach. World J Surg. 1979 Nov;3(6):671–3. doi: 10.1007/BF01654785. [DOI] [PubMed] [Google Scholar]
- 10.Hansson LE, Nyren O, Hsing AW, Bergstrom R, Josefsson S, Chow WH, et al. The risk of stomach cancer in patients with gastric or duodenal ulcer disease. N Engl J Med. 1996 Jul 25;335(4):242–9. doi: 10.1056/NEJM199607253350404. [DOI] [PubMed] [Google Scholar]
- 11.Hopper AN, Stephens MR, Lewis WG, Blackshaw GR, Morgan MA, Thompson I, et al. Relative value of repeat gastric ulcer surveillance gastroscopy in diagnosing gastric cancer. Gastric Cancer. 2006;9(3):217–22. doi: 10.1007/s10120-006-0385-4. [DOI] [PubMed] [Google Scholar]
- 12.Saini SD, Eisen G, Mattek N, Schoenfeld P. Utilization of upper endoscopy for surveillance of gastric ulcers in the United States. Am J Gastroenterol. 2008 Aug;103(8):1920–5. doi: 10.1111/j.1572-0241.2008.01945.x. [DOI] [PMC free article] [PubMed] [Google Scholar]
- 13.Hosokawa O, Tsuda S, Kidani E, Watanabe K, Tanigawa Y, Shirasaki S, et al. Diagnosis of gastric cancer up to three years after negative upper gastrointestinal endoscopy. Endoscopy. 1998 Oct;30(8):669–74. doi: 10.1055/s-2007-1001386. [DOI] [PubMed] [Google Scholar]
- 14.Guarner J, Herrera-Goepfert R, Mohar A, Smith C, Schofield A, Halperin D, et al. Diagnostic yield of gastric biopsy specimens when screening for preneoplastic lesions. Hum Pathol. 2003 Jan;34(1):28–31. doi: 10.1053/hupa.2003.3. [DOI] [PubMed] [Google Scholar]
- 15.Schauer PR, Schwesinger WH, Page CP, Stewart RM, Levine BA, Sirinek KR. Complications of surgical endoscopy. A decade of experience from a surgical residency training program. Surg Endosc. 1997 Jan;11(1):8–11. doi: 10.1007/s004649900284. [DOI] [PubMed] [Google Scholar]
- 16.Silvis SE, Nebel O, Rogers G, Sugawa C, Mandelstam P. Endoscopic complications. Results of the 1974 American Society for Gastrointestinal Endoscopy Survey. JAMA. 1976 Mar 1;235(9):928–30. doi: 10.1001/jama.235.9.928. [DOI] [PubMed] [Google Scholar]
- 17.Finlayson EV, Birkmeyer JD. Operative mortality with elective surgery in older adults. Eff Clin Pract. 2001 Jul-Aug;4(4):172–7. [PubMed] [Google Scholar]
- 18.Arias E. United States life tables, 2000. Natl Vital Stat Rep. 2002 Dec 19;51(3):1–38. [PubMed] [Google Scholar]
- 19.U.S. Department of Health and Human Services. Center for Medicare & Medicaid Services. Fee Schedule. 2007. [July 20, 2008]; Available at: http://www.cms.hhs.gov.
- 20.Yabroff KR, Lamont EB, Mariotto A, Warren JL, Topor M, Meekins A, et al. Cost of care for elderly cancer patients in the United States. J Natl Cancer Inst. 2008 May 7;100(9):630–41. doi: 10.1093/jnci/djn103. [DOI] [PubMed] [Google Scholar]
- 21.Bureau of Labor Statistics, U.S. Department of Labor. Occupational Employment and Wages. 2007. [August 18, 2008]; Available at: http:/stat.bls.gov/oes/home.htm.
- 22.Yabroff KR, Davis WW, Lamont EB, Fahey A, Topor M, Brown ML, et al. Patient time costs associated with cancer care. J Natl Cancer Inst. 2007 Jan 3;99(1):14–23. doi: 10.1093/jnci/djk001. [DOI] [PubMed] [Google Scholar]
- 23.Hanmer J, Lawrence WF, Anderson JP, Kaplan RM, Fryback DG. Report of nationally representative values for the noninstitutionalized US adult population for 7 health-related quality-of-life scores. Med Decis Making. 2006 Jul-Aug;26(4):391–400. doi: 10.1177/0272989X06290497. [DOI] [PubMed] [Google Scholar]
- 24.Gold MR, Franks P, McCoy KI, Fryback DG. Toward consistency in cost-utility analyses: using national measures to create condition-specific values. Med Care. 1998 Jun;36(6):778–92. doi: 10.1097/00005650-199806000-00002. [DOI] [PubMed] [Google Scholar]
- 25.Gold MR, Siegel JE, Russel LB, Weinstein MC, editors. Cost-Effectiveness in Health and Medicine. New York: Oxford University Press; 1996. [Google Scholar]
- 26.Dixon MF, Genta RM, Yardley JH, Correa P. Classification and grading of gastritis. The updated Sydney System. International Workshop on the Histopathology of Gastritis, Houston 1994. Am J Surg Pathol. 1996 Oct;20(10):1161–81. doi: 10.1097/00000478-199610000-00001. [DOI] [PubMed] [Google Scholar]
- 27.Uemura N, Okamoto S, Yamamoto S, Matsumura N, Yamaguchi S, Yamakido M, et al. Helicobacter pylori infection and the development of gastric cancer. N Engl J Med. 2001 Sep 13;345(11):784–9. doi: 10.1056/NEJMoa001999. [DOI] [PubMed] [Google Scholar]
- 28.Briggs AH, Goeree R, Blackhouse G, O'Brien BJ. Probabilistic analysis of cost-effectiveness models: choosing between treatment strategies for gastroesophageal reflux disease. Med Decis Making. 2002 Jul-Aug;22(4):290–308. doi: 10.1177/0272989X0202200408. [DOI] [PubMed] [Google Scholar]
- 29.Breslin NP, Sutherland LR. Survey of current practices among members of CAG in the follow-up of patients diagnosed with gastric ulcer. Can J Gastroenterol. 1999 Jul-Aug;13(6):489–93. doi: 10.1155/1999/738907. [DOI] [PubMed] [Google Scholar]
- 30.Neumann PJ, Sandberg EA, Bell CM, Stone PW, Chapman RH. Are pharmaceuticals cost-effective? A review of the evidence. Health Aff (Millwood) 2000 Mar-Apr;19(2):92–109. doi: 10.1377/hlthaff.19.2.92. [DOI] [PubMed] [Google Scholar]
- 31.Graham DY, Schwartz JT, Cain GD, Gyorkey F. Prospective evaluation of biopsy number in the diagnosis of esophageal and gastric carcinoma. Gastroenterology. 1982 Feb;82(2):228–31. [PubMed] [Google Scholar]
- 32.Wong BC, Lam SK, Wong WM, Chen JS, Zheng TT, Feng RE, et al. Helicobacter pylori eradication to prevent gastric cancer in a high-risk region of China: a randomized controlled trial. JAMA. 2004 Jan 14;291(2):187–94. doi: 10.1001/jama.291.2.187. [DOI] [PubMed] [Google Scholar]
- 33.Fukase K, Kato M, Kikuchi S, Inoue K, Uemura N, Okamoto S, et al. Effect of eradication of Helicobacter pylori on incidence of metachronous gastric carcinoma after endoscopic resection of early gastric cancer: an open-label, randomised controlled trial. Lancet. 2008 Aug 2;372(9636):392–7. doi: 10.1016/S0140-6736(08)61159-9. [DOI] [PubMed] [Google Scholar]
- 34.Parkin DM. The global health burden of infection-associated cancers in the year 2002. Int J Cancer. 2006 Jun 15;118(12):3030–44. doi: 10.1002/ijc.21731. [DOI] [PubMed] [Google Scholar]