Abstract
Our recent work on an A→G single nucleotide polymorphism (SNP) at the quasi-palindromic sequence d(TGGGG[A/G]CCCCA) of HS4 of the human β-globin locus control region in an Indian population showed a significant association between the G allele and the occurrence of β-thalassemia. Using UV-thermal denaturation, gel assay, circular dichroism (CD) and nuclease digestion experiments we have demonstrated that the undecamer quasi- palindromic sequence d(TGGGGACCCCA) (HPA11) and its reported polymorphic (SNP) version d(TGG GGGCCCCA) (HPG11) exist in hairpin–duplex equilibria. The biphasic nature of the melting profiles for both the oligonucleotides persisted at low as well as high salt concentrations. The HPG11 hairpin showed a higher Tm than HPA11. The presence of unimolecular and bimolecular species was also shown by non-denaturating gel electrophoresis experiments. The CD spectra of both oligonucleotides showed features of the A- as well as B-type conformations and, moreover, exhibited a concentration dependence. The disappearance of the 265 nm positive CD signal in an oligomer concentration-dependent manner is indicative of an A→B transition. The results give unprecedented insight into the in vitro structure of the quasi-palindromic sequence and provide the first report in which a hairpin–duplex equilibrium has been correlated with an A→B interconversion of DNA. The nuclease-dependent degradation suggests that HPG11 is more resistant to nuclease than HPA11. Multiple sequence alignment of the HS4 region of the β-globin gene cluster from different organisms revealed that this quasi-palindromic stretch is unique to Homo sapiens. We propose that quasi-palindromic sequences may form stable mini- hairpins or cruciforms in the HS4 region and might play a role in regulating β-globin gene expression by affecting the binding of transcription factors.
INTRODUCTION
DNA adopts various conformations, which are restricted to a small subset of nucleotide sequences (1,2). The human genome, like other mammalian genomes has a very high proportion of repetitive DNA sequences. A number of non- B-DNA conformations can be formed within these sequences, including cruciform, intramolecular triplex and slipped mispaired structures (3). Eukaryotic DNA, in contrast to that of prokaryotes, has many large palindromes. Often, inverted repeats, which occur near putative control regions of genes or at origins of DNA replication in the linear form, play important biological roles as binding sites (operator sequences) for dimeric proteins (repressors and activators) (4). Perhaps the most important aspect of DNA structural variations is likely to be found in the mechanics of molecular recognition and manipulation by proteins. Some proteins are required to manipulate the DNA structure to carry out their function (5). Palindromic and quasi-palindromic (imperfect palindrome) sequences have unique structural properties and often occur near regulatory sites in genomic DNA to serve as recognition sequences for restriction enzymes (6,7).
Early X-ray studies found that short palindromic oligonucleotides such as d(CGCGAATTCGCG) crystallize mainly as B-type duplexes (8) but later optical and NMR studies in solution showed that palindromic sequences are able to form alternative conformations under suitable conditions (9). These sequences often establish an equilibrium between duplex hairpin and random coil conformations with relative stabilities depending on the base sequence. Structural motifs such as hairpins might also play an important role in the structure and function of single-stranded DNA viral genomes. Earlier UV-thermal denaturation studies of short DNA hairpins (10) revealed that loop and stem sequences can significantly affect the melting or thermostability of short DNA hairpins. DNA hairpin structures with a T4 or T5 loop possess the most stable structure compared to other homonucleotide loops (10–12). In the case of double-stranded DNA molecules the dominance of the common double helix is of course overwhelming and, therefore, the abundance of structural elements like hairpins, bulges, etc. is expected to be very low in these molecules. Still, there is growing evidence that so-called cruciform structures (i.e. hairpins) occur in supercoiled DNA sequences with short inverted repeats (13–15). The role of hairpin formation in Fredreich’s ataxia triplet repeat expansion has recently been reported (16).
Recent studies (17–19) on the spectrum of β-thalassemia mutations and their association with allelic sequence polymorphism in the human β-globin gene cluster have revealed a single nucleotide polymorphism (SNP) at the quasi- palindromic sequence of hypersensitive site 4 (HS4) of the locus control region (LCR). Studies carried out on an Indian population showed an A→G polymorphism in the sequence d(TGGGG[A→G]CCCCA) (18,19). A significant association was observed between the G allele and the occurrence of β-thalassemia. It was concluded that it could be an evolutionarily new mutation. It has also been hypothesized that the quasi-palindromic stretch might exist in a hairpin form where the A might form a single residue loop with a 5 bp stem and, moreover, that the G in the loop destabilizes the hairpin structure. Since the exact mechanism of regulation of the β-globin gene is not yet clear, an understanding of all these phenomena at the molecular level requires a detailed knowledge of the secondary structural transitions in the LCR region during the process of transcription.
Structural transitions between various forms of DNA would have consequences in vivo, and a thorough understanding of their physical and structural properties is called for. The characterization of such polymorphic sites at inverted repeat/repeat sequences is of crucial importance in understanding the mechanism of gene expression. With these concepts in mind and an aim to work on the said hypothesis (18), we undertook biophysical studies of the 11 nt long inverted repeat sequences d(TGGGG[A/G]CCCCA) present in HS4 of the major regulatory LCR of the β-globin gene.
MATERIALS AND METHODS
The oligonucleotides, synthesized on the 1 µM scale by Bio Basic Inc., Canada, were received in the lyophilized powder form. The synthetic oligomers were supplied in purified form via 16% PAGE in 7 M urea, supplemented with an electrophoretogram exhibiting a single band and a stated purity of 99%. They were stored at –20°C and were used without further purification. The concentration of the oligonucleotides was determined spectrophotometrically by using the extinction coefficient (ε) calculated by the nearest neighbor method (20) and measuring the absorbance at 260 nm at elevated temperature (95°C), following the method described earlier (9). The ε values used for the 11mer oligonucleotide sequences d(TGG GGACCCCA) (HPA11) and d(TGGGGGCCCCA) (HPG11) were 104 200 and 100 900 M–1 cm–1, respectively, and for the 21mer oligonucleotides d(GCTCTTGGGGACCCCAGTACA) (HPA21) and d(GCTCTTGGGGGCCCCAGTACA) (HPG21) were 196 700 and 193 400 M–1 cm–1, respectively. Oligonucleotides d(GACCTGCAGGCATGCAAGCTTGGC) (OLIGO-2) and d(AAAGGGGGGAGGGGGAGGGGGTTTTTCCCCCTCCCCCTCCCCCCTTT) (HPNC, a designed hairpin) (ε = 438 510 M–1 cm–1) were used as controls in the nuclease digestion experiment, while d(TAAAAAT) (ε = 78 800 M–1 cm–1) was used as the labeled oligonucleotide size marker in gel assays. Stock solutions of the oligomers were prepared by directly dissolving the lyophilized powder in MilliQ water. All other chemicals were of analytical grade. The buffer solution consisted of 20 mM sodium cacodylate (pH 7.4), 0.1 mM EDTA adjusted to the desired ionic strength with NaCl.
UV-thermal denaturation
The thermal denaturation experiments were performed on a Varian CARY-100 spectrophotometer equipped with a Peltier thermoprogrammer and interfaced with a Pentium III computer for data collection and analysis. Stoppered quartz cuvettes of 10 mm optical path length and 1 ml volume were used for the measurements. The cell holder was thermostatted with circulating 80% water and 20% ethylene glycol. The oligonucleotide samples were prepared by taking the appropriate range of strand concentrations and heating the samples up to 98°C for 5 min, followed by slow cooling. The temperature dependence of the absorption value of the DNA was monitored at 260 nm. The temperature of the cell holder was increased from 17 to 95°C at a rate of 0.5°C/min. A Teflon-coated temperature probe, immersed directly in a control cuvette, measured the sample temperature. The sample solutions were overlaid with paraffin oil to prevent evaporation. The thermal melting temperature (Tm) was determined from the peak of the computer-generated first derivative of the absorbance verses temperature profile. In certain cases, due to technical difficulties, the upper plateau of the melting curves recorded could not be fully accessed. The curves were normalized with respect to the bottom plateau (Arel = A/Ai) and the Tm values were measured from the second derivative. The accuracy of the reported Tm values is ±1°C
Non-denaturating gel electrophoresis
To perform gel assays, oligonucleotides were 5′-end-labeled with [γ-32P]ATP (Bhabha Atomic Research Center, India) and T4 polynucleotide kinase (Bangalore Genei, India) using a standard procedure (21). A fixed concentration of labeled oligonucleotides of appropriate counts was mixed with unlabeled oligonucleotide of same sequence at the desired concentrations. The final volume of the sample in the buffer was 15 µl. The samples were heat treated at 95°C for 5 min and slowly cooled to room temperature over ∼10 h. The oligonucleotides were incubated at 4°C for 3 h before loading onto a 10% polyacrylamide gel pre-equilibrated at 4°C for 2 h. Both the gel and the running buffer (1X TBE) contained 20 mM sodium cacodylate, 50 mM NaCl and 0.1 mM EDTA. The gels were run at a constant 40 V in a cold room (4°C). After electrophoresis the gels were dried at 85°C for 60 min in vacuo and were visualized by autoradiography.
Circular dichroism (CD)
CD spectra were recorded on a JASCO-715 spectropolarimeter interfaced with an IBM PC compatible computer, calibrated with d-camphor sulfonic acid. Five scans of the spectrum were collected over the wavelength range 205– 350 nm at a scanning rate of 100 nm/min. The average of multiple scans was used for analysis. The scan of the buffer alone recorded at room temperature was substracted from the average scans for each DNA duplex. Data were collected in units of millidegrees versus wavelength and normalized to total DNA concentration.
S1 nuclease treatment
For S1 nuclease digestion 80 nmol (nucleotide equivalent) oligonucleotides were dissolved in 30 mM sodium acetate buffer (pH 4.6), 100 mM sodium chloride and 1 mM zinc sulfate. Then 10 U of S1 nuclease were added and the final volume adjusted to 1 ml. The degradation was followed by observing the change in UV absorbance at 260 nm at 25°C with a UV-VIS spectrophotometer (Varian CARY-100) equipped with a temperature controller.
Database searching and sequence alignment
The human genome sequence used to determine the distribution of the two quasi-palindromic sequences was obtained from the NCBI website (http://www.ncbi.nlm.nih.gov/genomes/; February 8, 2002 release). From the available data, information about gene locations and intron/exon positions was extracted chromosome wise using the program GENEINFOEXTRACT written in PERL. Another PERL program, MOTIFSEARCH, was written to determine the occurrences of the two quasi-palindromic sequences separately on all chromosomes and their occurrences inside and outside genes. Similarly, for motifs present in genes, their location in an intron or exon was determined using the same program.
Multiple sequence alignment of the HS4 region in the β-globin gene was done taking sequences from different organisms, namely human, rabbit, mouse, cow, galago and goat. The alignment was performed using ClustalX software (version 1.810) installed on an Irix platform.
RESULTS AND DISCUSSION
Database searching and sequence alignment
In order to find the prevalence of the two quasi-palindromic sequences under study, we searched the complete human genome database (February 2002 release). Both sequences were found to be quite abundant in the genome, with TGGGGACCCCA (2834 copies) occurring more often than TGGGGGCCCCA (2356 copies). Further, the density of both quasi-palindromic motifs was found to be higher in exons than intronic regions, as exemplified by a greater number of motifs per megabase in exons (0.017241) than introns (0.005376).
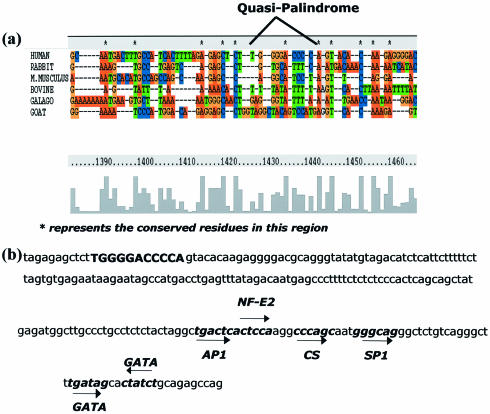
In another exercise, multiple sequence alignment of the HS4 region of the β-globin gene from different organisms (rabbit, mouse, cow, galago and goat) shows that this is not a highly conserved region. Interestingly, the presence of an intact quasi-palindromic sequence in HS4 was observed only in the case of human (Fig. 1a).
Figure 1.
(a) Multiple sequence alignment of the HS4 region in the β-globin gene from different organisms. (b) Transcription factor binding sites in the HS4 region.
UV-thermal melting studies
Considering the recently reported A→G SNP at the central position of the quasi-palindromic sequence under study, two oligonucleotides that differed by one base at the central position were synthesized. For information on the helix-forming properties of these imperfect palindromic strands, each was studied separately.
d(TGG GGA CCC CA) (HPA11)
d(TGG GGG CCC CA) (HPG11)
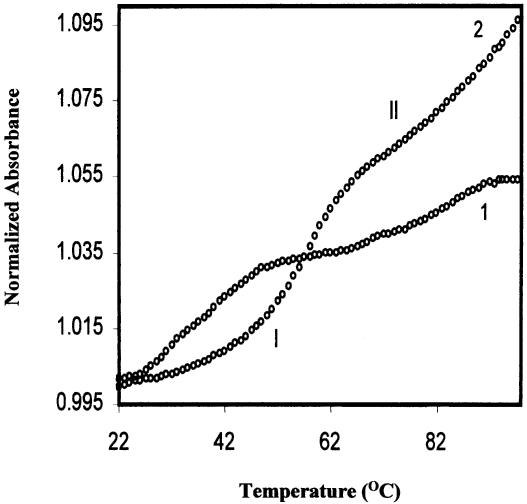
Figure 2 shows the absorbance versus temperature profiles for the 11mer quasi-palindromic sequences HPA11 and HPG11 (2 µM strand concentration each) in 20 mM sodium cacodylate buffer (pH 7.4) containing 100 mM NaCl and 0.1 mM EDTA. The melting profiles are biphasic, indicating melting of two species. The observed melting temperatures for the lower temperature transition (I) for HPA11 and HPG11 were 38 and 54°C, while for the higher temperature transition, the Tm values were found to be 82 and >90°C, respectively.
Figure 2.
Thermal denaturation profiles of HPA11 [d(TGGGGACCCCA), 1] and HPG11 [d(TGGGGGCCCCA), 2] at 2 µmol strand concentration of each in 20 mM sodium cacodylate buffer (pH 7.4), 100 mM NaCl and 0.1 mM EDTA.
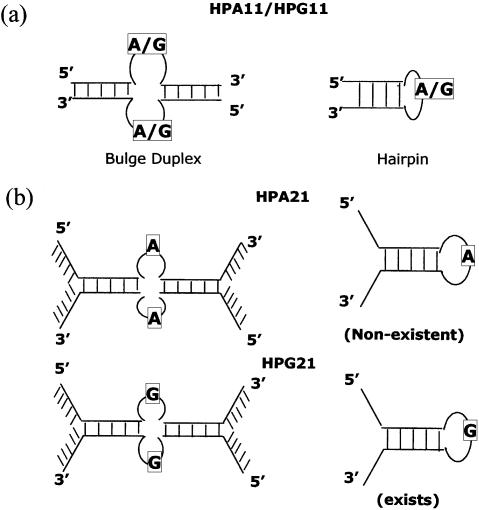
The status of the melting curves for both oligomers at varying salt concentrations, namely 5, 50, 100 and 500 mM NaCl, did not change as all the melting curves were biphasic (data not shown), again showing the presence of two ordered forms in equilibrium. However, a salt dependence of Tm was observed as an increase in melting temperature of both the species (Table 1). Since the sequence is not fully complementary, it can exist in hairpin and bulge duplex forms. For both oligomers HPA11 and HPG11, we attribute the lower temperature transition of the melting profile to a helix–coil or helix–hairpin transition of a bulge duplex and the higher temperature transition to melting of the hairpin form. Despite the comparable sequence and size, the bulge duplex formed by HPG11 (Tm = 54°C) was found to be more stable than that formed by HPA11 (Tm = 38°C) at 100 mM NaCl. This difference in thermal stability (16°C) might be due to G-G (mispair) base pairing at the center of the bulge duplex or continued stacking of guanines on the 5′-side, resulting in a linear duplex (Fig. 3a).
Table 1. Tm values for two transitions for both HPA11 and HPG11 oligonucleotides in 20 mM sodium cacodylate (pH 7.4) and 0.1 mM EDTA at different salt concentrations.
| NaCl (mM) | Tm (°C) | |||
|---|---|---|---|---|
| HPA11 | HPG11 | |||
| I | II | I | II | |
| 5 | 26 | 70 | 42 | 85 |
| 50 | 30 | 72 | 44 | 90 |
| 100 | 38 | 82 | 54 | >90 |
| 500 | 40 | 85 | 60 | >90 |
Figure 3.
Schematic representations of the possible structural forms adopted by (a) the quasi-palindrome d(TGGGG[G/A]CCCCA) and (b) its extended versions d(GCTCTTGGGG[G/A]CCCCAGTACA).
It is clear from Table 1 that the Tm of the hairpins (higher temperature transition II) formed by HPG11 as a function of salt concentration above 50 mM NaCl could not be detected from the melting profiles, as transition II did not reach a plateau. The salt concentration dependence of the Tm reflects the higher charge density of the low temperature ordered state (bimolecular) compared with the high temperature disordered state (monomolecular). The biphasic nature depicts the presence of two ordered forms in equilibrium. Again, the HPA11 oligonucleotide, with an identical size and palindromic sequence to HPG11, showed a lower Tm value for transition II. The difference in Tm values for the HPA11 and HPG11 sequences reflect the higher stability of the HPG11 hairpin than the HPA11 hairpin (Table 1).
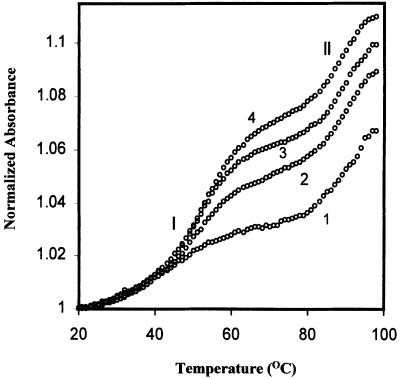
To obtain information on the molecularity of the two ordered states demonstrated by the biphasic melting profiles, a study of the dependence of Tm on oligomer concentration was carried out at 50 mM NaCl concentration. The melting profiles shown in Figure 4 are distinctly biphasic at various oligomer concentrations, again suggesting melting of two ordered forms. Since the lower and higher temperature transitions of the biphasic curves were sufficiently separated, it was possible to extract the Tm values for the two ordered forms. Due to technical difficulties the upper plateau of the melting curves could not be fully accessed so the curves were normalized with respect to the bottom plateau. The actual Tm values were determined from the second derivative (for sharper maxima) of the observed thermal transition.
Figure 4.
Thermal denaturation profiles of HPG11 sequence d(TGG GGGCCCCA) with 2 (1), 10 (2), 15 (3) and 20 µmol (4) strand concentrations in 20 mM sodium cacodylate buffer (pH 7.4), 50 mM NaCl, 0.1 mM EDTA.
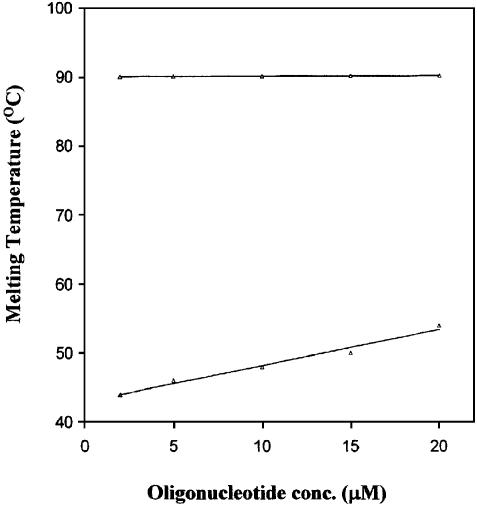
The biphasic curves (Fig. 4) obtained for HPG11 (2 µM) at 50 mM NaCl concentration correspond to transition I with Tm = 44°C and transition II with Tm = 90°C, whereas the 10-fold more concentrated solution of the oligomer exhibits melting temperatures at 54 and 90°C for transitions I and II, respectively. The first transition is highly dependent on oligomer and salt concentration whereas the second transition is relatively independent of oligomer concentration. Since our curves were normalized with respect to the pre-transition baseline only, there is an apparent difference in relative hyperchromicity of transition I at different concentrations. The concentration-dependent thermal denaturation profiles for oligomer HPA11 were similar to those of the HPG11 sequence, with the only difference being in the thermal stabilities of the two observed transitions (data not shown).
The most important result of this study is the persistence of the biphasic curves at lower (5 mM NaCl) as well as higher (500 mM NaCl) salt concentrations, for both oligonucleotides under study. With an increase in counterion concentration, the Tm of the hairpins increased at a faster rate than the Tm of the duplex and the two melting curves never overlapped. This is in agreement with reports on d(AAGCTTAAGCTT) (22).
In the plot of Tm versus oligomer concentration for HPG11 (Fig. 5), the independence of concentration of the Tm of transition II is consistent with our assumption that, under the condition of the Tm experiments, the strand exists primarily in a hairpin (unimolecular) state in equilibrium with a bimolecular bulge duplex form. We wish to stress that the melting behavior of both oligomers did not change at higher counterion concentration. The existence of a hairpin formed by d(AAGCTTAAGCTT), a repeat HindIII restriction site, has been reported even at 900 mM NaCl concentration (22). In contrast, the BglII site sequence d(AGATCTAGATCT) has been reported to exist in duplex form at ≥100 mM NaCl (23). Despite having the same base composition and palindromic nature, the difference in sequence makes the stability and nature of the HindIII hairpins markedly different from the BglII hairpins.
Figure 5.
Plot of oligonucleotide concentrations (µmol) versus melting temperatures (°C) for HPG11 in 20 mM sodium cacodylate buffer (pH 7.4), 50 mM NaCl, 0.1 mM EDTA.
Effect of flanking sequences
Thermal denaturation experiments were performed to study the effect of the flanking sequences on the hairpin–duplex equilibria exhibited by oligonucleotides HPA11 and HPG11 on the 5′- and 3′-extended versions of these oligonucleotides, namely HPA21 and HPG21, having the core quasi-palindromic sequence HPA11 or HPG11.
d(GCTCTTGGGG A CCCCAGTACA) (HPA21)
d(GCTCTTGGGG G CCCCAGTACA) (HPG21)
Melting of both HPA21 and HPG21 (2 µM strand each) was studied at 50, 100 and 500 mM salt concentration. While HPA21 showed monophasic curves at all three salt concentrations, HPG21 exhibited a biphasic profile at 100 mM NaCl. The reason for the non-existence of biphasic melting profiles in the case of HPA21 at any salt concentration can be attributed to the destabilizing effect of flanking non- complementary sequences, as a consequence of fraying (data not shown). Since G-hairpins are thermally more stable than A-hairpins (HPG11 versus HPA11), the flanking sequences seem to have less destabilizing effect on the stability of HPG21 than HPA21 (Fig. 3b).
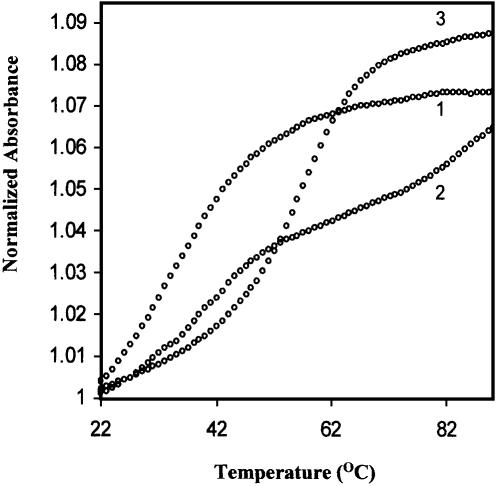
The cooperative thermal melting transitions of HPG21 were found to be monophasic at low and high salt concentrations but biphasic at intermediate ionic strength (100 mM NaCl), suggesting melting of two ordered forms. In the light of our gel data (Fig. 7) and studies by other groups (24–26), we interpreted the melting of HPG21 as follows. According to Kearns (26), the duplex–hairpin interconversion might proceed through a cruciform intermediate and raising the salt concentration might stabilize the intermediate cruciform state. This mechanism predicts an increase in hairpin formation rate with increasing salt concentration. The higher ionic strength requirement to stabilize the intermediate cruciform state can be attributed to greater phosphate–phosphate repulsion within cruciform structures. Similarly, Xodo reported (25) a duplex–hairpin interconversion through a cruciform intermediate in inverted repeat sequences. We assume that in our case, at low salt (50 mM NaCl, Fig. 6, curve 1) HPG21 is not completely hairpin but may be a duplex with an extended bulge that corresponds to a cruciform state. This cruciform structure would tally very well with our gel data (Fig. 7), since the highly retarded band is designated as bulge duplex. Cruciforms melt in a monophasic fashion (26), therefore curve 1 (Fig. 6) is not really a hairpin but a cruciform-like structure. The lower temperature sharp transition of the biphasic curve showed a Tm of 40°C while the higher temperature broad transition could not achieve a plateau resembling the melting of HPG11. Thus, the lower temperature transition of the intermediate curve (100 mM NaCl, Fig 6, curve 2) represents the cruciform extrusion process with an increase in temperature. It does not show a well-defined second transition of hairpin melting for the reason that cruciform extrusion leads not to the formation of a fully formed hairpin but an already half melted hairpin. The monophasic transition at high salt (500 mM NaCl, Fig 6, curve 3) may be attributed to the bulge duplex form, expected to be present at high salt concentrations.
Figure 7.
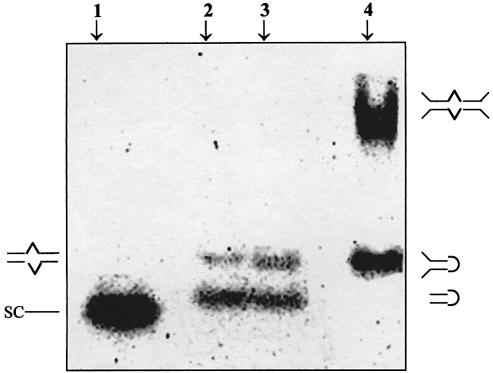
10% PAGE mobility pattern of the oligonucleotide sequences. Lane 1, single-stranded heptamer control oligo [SC, d(TAAAAAT)] migrating as a single strand; lanes 2 and 3, (lower band) HPA11 and HPG11 [d(TGGGGA/GCCCCA)] migrating as a hairpin as well as (upper band) a bulge duplex; lane 4, 21mer HPG21 [d(GCTCTTGGGGGCCCCAGTACA)] migrating as a hairpin with unpaired flanking ends and (upper band) a 21mer extended bulge duplex.
Figure 6.
Thermal denaturation profiles of HPG21 sequence d(GCT CTTGGGGGCCCCAGTACA) (2 µmol strand concentration) in 20 mM sodium cacodylate buffer (pH 7.4), 50 (1), 100 (2) or 500 mM (3) NaCl, 0.1mM EDTA.
The generic base sequences of oligonucleotides HPA11 and HPG11 predict that since they are not fully self-complementary, there exists a non-complementary residue (A or G) in the middle intervening in the (self-)complementary parts of the sequence. Of course, the complementary ends of the sequences can still interact and may form duplexes either intramolecularly (monomeric hairpin) or intermolecularly (bimolecular bulge duplex). The origin of the bulge duplex structure remains the quasi-palindromic nature of the oligonucleotide. Since the sequences on both sides of the central base (A or G) are self-complementary, the resulting hairpin can have a 1 nt loop and 5 bp stem (one AT and four GC).
Studies on a series of short DNA fragments reported the formation of an extraordinarily stable hairpin structure containing only two G-C pairs in the stem part and a trinucleotide (GAA) loop, whose melting temperature was as high as 76°C in 100 mM NaCl. The d(GCGAAGC) hairpin is much more stable than the corresponding r(GCGAAGC) hairpin (Tm = 27°C) under similar experimental conditions (27). The three-dimensional structure revealed by NMR studies showed that d(GCGAAGC) is folded back on itself between A4 and A5 and that all the sugars in the fragment adopt the C2′-endo conformation. This compact molecule is stabilized by regular extensive base stacking interactions within each B-form helical strand of G1C2G3A4 and A5G6C7 and by two G-C base pairs and the G3-A5 base pair. These extraordinarily stable hairpins also show high resistance to nucleases (28).
A recent report from Fermandjian’s group (29) on the formation of a DNA hairpin with a single residue loop (closed by a strongly distorted Watson–Crick G-C base pair) has supported our findings of the existence of a single residue loop in minihairpins. We predict a similar situation in our studies on hairpin formation by quasi-palindromic oligonucleotides HPA11 and HPG11. The oligonucleotide folds on either the 5′ or 3′ side of the central intervening residue or may be closed by a distorted Watson–Crick G-C base pair. For certain DNA hairpin loops a C-G closing base pair provides enhanced stability (30).
The higher stability of a -G- loop hairpin compared with an -A- loop hairpin may be ascribed to better stacking of G than A as the G is involved in the Watson–Crick base pairing with a C in the stem. The influence of the loop residue on the relative stabilities of DNA hairpin structures has been studied. Studies on the specific family of hairpin structures formed by 16mer sequence 5′-CGAACG(X)4CGTTCG, where X = A, G, T or C, concluded that the order of DNA hairpin stability was found to be T loop > C loop > G loop > A loop (10). This is consistent with our observation of higher stability of a hairpin containing a G in the loop than one containing an A.
GNA trinucleotide loop sequences have been shown to produce extraordinarily stable DNA minihairpins (31). The tri-loop region of the d(GCGAAGC) minihairpin was randomized and it was found that only four fragments, d(GCGNAGC), where N = A, G, C or T, were found to form unusually stable minihairpins, as shown by their Tm values, gel mobilities and nuclease resistances (32). It has been suggested that extraordinary stability is caused by the additional G-A pair formed between G3 and A5 of the sequence d(GCGAAGC) and the extensive base stacking interactions with G1C2G3N4 and A5G6A7. It was concluded that the sheared G-A base pair in the loop is required for formation of stable trinucleotide loop hairpins.
As a general trend we see that a loop moiety, as well as a stem region, potentiates hairpin formation and the loop sequence is important for prediction of the hairpin structure and its stability. A recent study (33) on melting of short DNA hairpins has elegantly shown the influence of the loop sequence adjoining the base pair identity on hairpin thermodynamic stability. The Tm values, regardless of the identity of the base pair that nucleates the 4 base loop, reveal that the order of stability of the sequence is TCCT > TTTT > CCCC > TGGT > TAAT > GGGG > AAAA. Most of the information we have today on DNA/RNA hairpin structures deduced from high resolution NMR studies (34) has validated the conclusions drawn from other biophysical studies. Hairpin conformations have been studied in a number of non-palindromic oligonucleotides where duplex formation is very difficult (35). It is clear that both base stacking and base pairing interactions are important for stable hairpin formation. The literature is rich in studies on the various palindromic/non-palindromic sequences forming hairpin structures and hairpin→duplex equilibria and these support our observations of UV-melting measurements on two quasi-palindromic sequences very well.
Non-denaturating gel electrophoresis
Further, non-denaturating gel electrophoresis was used to demonstrate the presence of unimolecular and bimolecular duplex structures. Samples were analyzed by electrophoresis on a 10% polyacrylamide gel (at 4°C) followed by autoradiography. The electrophoretogram of the two sequences under study is shown in Figure 7. HPA11 and HPG11 at 10 µM strand concentration (lanes 2 and 3) show two distinct bands. The lower species migrating at approximately the same rate as the single-stranded heptamer marker (lane 1) is the hairpin form, while the upper one corresponds to the 11mer intermolecular duplex. The intermolecular bulge duplexes of HPA11 and HPG11 exhibited a retarded electrophoretic mobility compared with the corresponding intramolecular folded hairpins.
Interestingly, HPG21 (lane 4) under identical solution conditions also exhibited two bands. The lower one, corresponding to the unimolecular (hairpin) form with unpaired flanking ends, moves like the 11mer duplex (lanes 2 and 3) while the upper band clearly depicts the presence of a 21mer in a bulge duplex conformation. It is worth mentioning that the band designated a bulge duplex species of HPG21 showed extensive retardation. It moved more slowly than expected of the duplex band, when compared to the hairpin–duplex bands of HPA11 and HPG11 (lanes 2 and 3). We suggest that this highly retarded band is the extended bulge form, identical to a cruciform structure. This agrees with a report (24) that four-way junctions are known to migrate much more slowly than linear duplexes of the same molecular weight.
The gels were also run at room temperature (data not shown). While the HPG11 oligomer showed two bands (identical to the gel run in a cold room at 4°C), HPA11 appeared as a single band corresponding to the hairpin conformer of HPG11. This result is expected, since the Tm of HPA11 under identical solution conditions is 30°C. During electrophoresis the gel temperature may increase and the HPA11 bulge duplex may be disrupted. Since the Tm of HPG11 under identical solution conditions is 44°C, we are able to see the two bands representing the hairpin and duplex forms.
At this point it is important to mention that prior to running the native PAGE, the sequences were electrophoresed in gels containing 8 M urea, in which each of the oligomers migrated as a single band. Thus the spectroscopic observations are substantiated by gel electrophoresis for differential mobilities of inter- and intramolecular species.
Circular dichroism studies
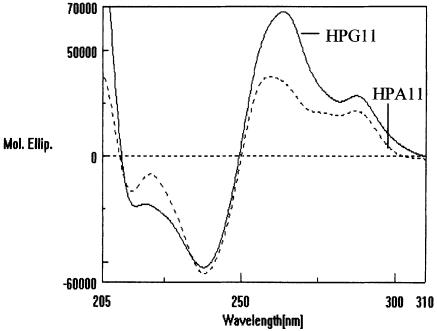
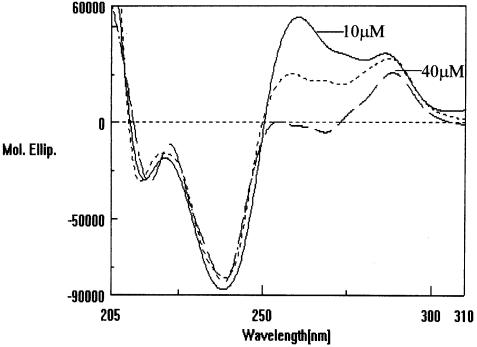
CD spectra of quasi-palindromic sequences were recorded to investigate the possible changes in DNA secondary structure during hairpin–duplex transitions under the same solution conditions as biphasic UV-melting curves were obtained. Figure 8 shows the CD spectra of d(TGGGGACCCCA) (HPA11) and d(TGGGGGCCCCA) (HPG11) at 6 µM strand concentration of each in 20 mM sodium cacodylate buffer (pH 7.4) containing 100 mM NaCl and 0.1 mM EDTA. The CD profiles for the two oligomers display a strong negative band at 240 nm and two strong overlapping positive peaks near 265 and 285 nm. The presence of two positive bands suggests an unusual structure with mixed conformations of the oligomers, as such CD spectra were not observed for any canonical forms of DNA (36). Also, the amplitude of the 265 nm peak in the case of HPG11 is much higher than the amplitude of the same peak in the case of HPA11. This observation signifies some difference in the structures adopted by the two sequences. A typical B-DNA form displays a negative CD peak at 255 nm followed by a positive peak of equal amplitude at 285 nm, while the A-form gives a negative peak at 240 nm and a positive peak at 265 nm. B-form CD bands are much weaker than A-form CD bands (37). A careful look at the spectra in Figure 8 further reveals that the structures formed by these two oligonucleoides have characteristics of both A- and B-type organization of bases in the helices.
Figure 8.
CD spectra of HPA11 and HPG11 (6 µmol strand concentration) in 20 mM sodium cacodylate buffer (pH 7.4), 100 mM NaCl, 0.1 mM EDTA.
The presence of biphasic UV-melting curves (Fig. 2) for both oligonucleotides has already given a clue to the existence of a hairpin→duplex equilibrium. Chen (38) has interpreted the CD spectra of the hairpin conformation of d(CGCG-TA-CGCG) and d(CGCG-TG-CGCG) sequences, which are characterized by a couplet with nearly equal positive and negative peaks at 285 and 255 nm, respectively, while a significantly smaller peak at 285 nm corresponds to the duplex form. Our observations differ from those of Chen, which might be due to selection of the oligomer sequence.
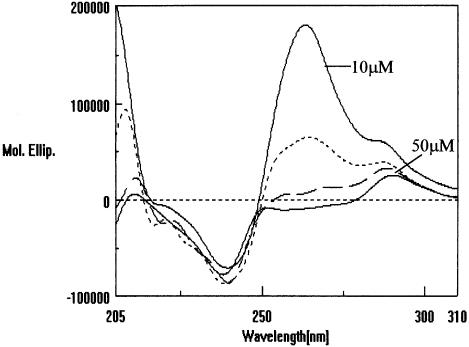
To investigate the possible effect of oligonucleotide concentration on the CD spectra, studies corresponding to the UV-melting studies were carried out on the HPA11 and HPG11 sequences under identical conditions. Quite interestingly, Figures 9 and 10 show CD profiles of oligonucleotides HPA11 and HPG11 at various strand concentrations (10–50 µM) in 20 mM sodium cacodylate (pH 7.4) containing 100 mM NaCl. Of the two well-defined positive peaks at 265 and 285 nm at 10 µM oligomer concentration, only the 285 nm positive peak appeared at 40 and 50 µM concentrations for HPA11 and HPG11, respectively. With a gradual increase in concentration, the 265 nm peak loses its intensity until it disappears at the highest concentrations used. This significant observation might be explained as a structural transition of the hairpin conformation to the bimolecular B-type duplex species, which typically shows a positive peak at 285 nm. The UV-melting studies discussed in the previous section demonstrated that the HPG11 hairpin species is relatively more stable than the corresponding A-type sequence. This can further be seen reflected in the CD studies, as we see that the amplitude of the 265 nm positive peak is significantly high in the case of HPG11 (Fig. 8). Since we have attributed the 265 nm peak to the presence of a hairpin (intramolecular) species, a greater intensity of this band corresponds to the presence of a stable conformation. The fact that the CD studies show changes in the spectra as a function of oligomer concentration deserves further comment. The change in the CD spectra occurs at ≥30 µM concentration, it seems that at these relatively higher concentrations bimolecular duplex formation is selectively favored over monomolecular hairpin formation. Single-stranded or random coil polynucleotides are not considered to have a unique structure in solution. Thus, on the basis of UV-melting and CD studies it cannot be excluded that the two quasi-palindromic oligonucleotides under study indeed exist as a mixture of different conformations in solution.
Figure 9.
CD spectra of HPA11 at varied strand concentrations, i.e. 10, 30 and 40 µmol in 20 mM sodium cacodylate buffer (pH 7.4), 100 mM NaCl, 0.1 mM EDTA.
Figure 10.
CD spectra of HPG11 at various strand concentrations, i.e. 10, 30, 40 and 50 µmol in 20 mM sodium cacodylate buffer (pH 7.4), 100 mM NaCl, 0.1 mM EDTA.
Our interpretation of the two distinct positive peaks in the CD spectra of the HPA11 and HPG11 sequences is further supported by a few recent elegant reports on the contribution of sequence to the CD profiles of A- and B-form DNA (39–44). Due to the A-philicity of GC-rich sequences, the B→A transition can be observed in so-called DNA G-tract stretches of four or more GC pairs. Interestingly, d(AGGGGCCCCT)2 contains an 8 bp G-tract and crystallizes in a global conformation resembling that of canonical A-form DNA (34).
An early report suggested the need for caution in the interpretation of CD data from G-clusters in DNA (45). The self-complementary oligonucleotides r(GCG), d(CGC) and d(CCCCGGGG), all of which form miniature double-helical structures, have been investigated by Raman spectroscopy and by single crystal X-ray diffraction analysis. In the case of poly(dG)·poly(dC), a 4% solution of the duplex is largely A-DNA but a 2% solution is predominantly B-DNA. The results indicate conformational similarities between GC sequences of fibrous poly(dG)·poly(dC) and those of the C4G4 crystal but reveal that the conformations of aqueous GC models are significantly influenced by the solvent and salt environment.
CD spectroscopy, NMR and unrestrained molecular dynamics have been used to study conformational properties of a DNA duplex formed by the self-complementary d(GGGGCCCC) (43). Its unusual CD spectrum contain features indicating A-like stacking of half of the bases, whereas the other half stack in a B-like fashion. The cytosine bases were stacked in the duplex as in structure B, while stacking of the guanine bases displayed features characterizing an A-type structure. In contrast, in an independent study, the octamer d(CCCCGGGG) and other d(CnGn) fragments of DNA provide CD spectra which suggest that the base pairs are stacked in an A-like fashion even in aqueous solution. NMR spectroscopy showed a B-type puckering of the deoxyribose sugar ring. Hence, a combination of the information provided by CD spectroscopy and NMR suggests an unprecedented double helix of DNA in which A-like base stacking is combined with B-type sugar puckering. The double helix contained well-stacked guanine bases but almost unstacked cytosine bases (39).
The effects of G-tract length and flanking sequences on the conformation in solution of DNA G-tracts have been elegantly studied using CD and FTIR spectroscopy (44). Five different G-tract-containing DNA duplexes were studied: d(CATGGCCATG)2, d(CATGGGCCCATG)2, d(CATGGGGCCCCATG)2, d(AGGGGCCCCT)2 and d(TGGGGCCCCA)2. Since CD spectra are extremely sensitive to the base stacking geometry of nucleic acids and FTIR spectra yield detailed, group-specific structural information, it was concluded that the structures of the G-tracts in solution are all in a dominant B-type conformation. However, certain spectral variations suggest a predisposition to an A-type conformation in sequences d(CATGGGCCCATG)2, d(AGGGGCCCCT)2 and d(TGGGGCCCCA)2, depending on the length of the G-tracts as well as the sequence context. Another careful study has predicted conserved guanine–guanine stacking in tetraplex and duplex DNA. Kypr et al. (42), using a series of suitably chosen oligonucleotides, have demonstrated that the DNA duplex of d(CCCCGGGG) provides an almost identical CD spectrum as the parallel-stranded tetraplex of d(GGGG). These results reveal that guanine–guanine stacking is a structural invariant conserved in various nucleic acid conformers.
The purpose of discussing the above reported studies lies in the close similarity of the DNA sequences used there with our sequences. Since the oligonucleotides HPA11 [d(TGGGGACCCCA)] and HPG11 [d(TGGGGGCCCCA)] share the same 5′- and 3′-terminal pentanucleotide 5′-TGGGG- and -CCCCA-3′ stretches with the sequences d(TGGGG-CCCCA) (44) and the -GGGG- and -CCCC- segments with d(GGGGCCCC) (43) and d(CCCCGGGG) (39,42), conformational similarities are anticipated. In all the reports discussed, DNA segments containing the -GGGG- or -CCCC- stretch have always been either d(GGGGCCCC) or d(CCCCGGGG) fully self-complementary in nature. They were shown to form a duplex with no signatures of a hairpin or multi-stranded structures. The fact that ours are quasi-palindromic sequences have one non-self-complementary residue in a central position, disturbing the dyad symmetry (two-fold symmetry), creates space for the origin of bulge duplex and hairpin forms.
Our CD spectra of d(TGGGGACCCCA) and d(TGGGGGCCCCA) resemble the CD spectrum of d(TGGGGCCCCA) (44) and also that of d(GGGGCCCC) (43). As stated earlier, the presence of a common DNA stretch in all the sequences may give rise to identical CD spectra. These sequences display two positive CD peaks at 265 and 285 nm, which is in contrast to the CD spectrum of d(CCCCGGGG), characterized by a 265 nm positive peak identical to the CD spectrum of the sequence d(GGGG) (39,41). Qualitatively the same spectra are generally displayed by DNA duplexes of d(CnGn) fragments. It is important to mention here that polyd(G)· polyd(C) or oligo(dG)·oligo(dC) also give the A-type DNA CD spectrum (46). Coming back to the solution state of our sequences and taking the above discussed reports into consideration, we interpret the CD profiles of the HPA11 and HPG11 sequences as follows.
A→B transition
Although the base sequences of the hairpin and bulge duplex forms are identical, their conformations exhibit two different CD profiles.
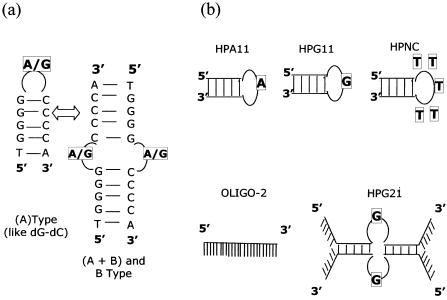
As shown in Figure 11a, the hairpin form may be considered as composed of purine–pyrimidine blocks involving Watson–Crick hydrogen bonding and seems to resemble oligo(dG)· oligo(dC) in the way that both the -GGGG- and -CCCC- stretches are anti-parallel to each other. In the bulged duplex form it resembles the d(GGGGCCCC)2 sequence, with the difference of a central G or A mispairing. Assuming this sequence homology, and the interpretation of the CD signals described in the literature, the 265 nm positive peak corresponding to A-type DNA might be due to the hairpin form of HPA11 and HPG11, while the 285 nm positive band corresponding to B-type DNA may have originated from the bulge duplex structure. This interpretation is supported by the fact that at the highest concentration of the oligonucleotide, the 265 nm peak disappears while the 285 nm band still exists. This will only be possible if at this concentration a structural transition between hairpin and bulged duplex takes place, as higher concentrations of oligomers favor intermolecular duplex forms (9). Interestingly, such a concentration dependence of CD was not observed with a perfect palindromic sequence, d(TGGGGCCCCA) (44). Coincidently, our sequences are partially complementary, which seemingly gives them a chance to exist in hairpin→duplex equilibrium.
Figure 11.
(a) The proposed model based on CD studies of the hairpin–duplex equilibrium, in terms of the A-type→B-type transition. (b) Schematic presentation of the oligonucleotide structures used in S1 nuclease digestion experiments.
When B-DNA converts into the A-form, the base pair becomes displaced and inclined relative to the helix axis. The sugar pucker shifts from S-type in B-DNA to N-type in A-DNA (47). A-form DNA is less flexible than B-DNA. This rigidity is proposed to be of biological significance, since replication can occur at higher fidelity due to the stiffness of the A-form structure (48). Since the hairpin form (intramolecular) of the duplex is considered to be more compact than the intermolecular duplex, we further propose that there might be the possibility of the existence of a hairpin in the A-type conformation and a bulge duplex in the B-type and interconversion of the A- to B-form in an oligomer concentration-dependent manner at the hairpin→duplex equilibrium. Fiber diffraction and solution studies have shown that G-tracts, or runs of four or more GC pairs, also have special structural properties; G-tracts favor the A-DNA helix conformation and, depending on the low water activity, can induce a B→A transition (49,50). Sequences with long G-tracts usually crystallize as A-DNA (51). Significantly, while the decamer d(CATGGCCATG) with a 4 bp G-tract (G4 to C7) has been shown to crystallize as B-DNA (52), the dodecamer d(CATGGGCCCATG) with a 6 bp G-tract (G4 to C9) has more of an A-DNA character (40). Ng et al. (40) was the first report of a DNA oligomer crystallizing as a conformational intermediate between A- and B-DNA. Further, the suggestion that an A↔B transition is readily accessible to certain DNA sequences reinforced our explanation of the oligomer concentration dependence of our G-tract sequences in CD studies. The relative intensities of the CD peaks of HPA11 and HPG11 at 285 and 265nm (Fig. 8) again confirm our perception that the 265 nm strong peak belongs to the A-form intramolecular hairpin species (37).
Non-existence of G- or C-quartets
The formation of multi-stranded structures is a well- documented phenomenon for short oligomeric sequences with guanine tracts (53–55). Following these reports, coupled with the presence of -GGGGG- and -CCCC- stretches in our quasi-palindromic sequences, led us to suspect that the 265 nm positive CD peak may be due to the presence of a parallel quadruplex, while the 285 nm peak corresponds to the presence of i-motif structures (C-quartets). Mergny (56) has shown that G-quartet formation can be followed by UV spectroscopy. To our surprise, the UV-melting of HPA11 and HPG11 under identical experimental conditions at 295 nm did not exhibit an inverse sigmoidal curve (data not shown), a feature that is a typical signature of G-quadruplexes and i-motifs. Thus the presence of G- or C-quadruplexes formed by the oligonucleotides was excluded. Further, the gel assays did not show any signatures of the presence of higher order structures other than the inter- and intramolecular duplex species (Fig. 7).
Nuclease resistance
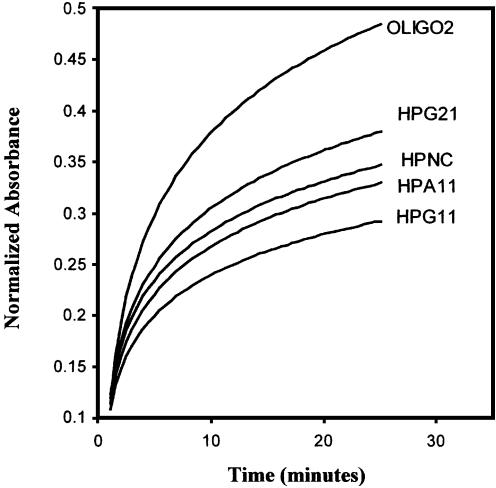
It is known that thermally stable DNA hairpins tend to be resistant to nucleases (28,57). The quasi-palindromic sequences HPA11 and HPG11, which are found to be thermally quite stable, were assessed for their stability against nucleases. The various oligonucleotides (schematically represented in Fig. 11b) were digested with nuclease S1. Figure 12 shows the time–course degradation of HPA11 and HPG11, their variant HPG21 and other control oligonucleotides (OLIGO-2 and HPNC) by S1 nuclease, monitored by an increase in absorbance at 260 nm. It is evident that both the thermostable minihairpins (HPA11 and HPG11) in equilibrium with the bulge duplex species are more resistant to S1 nuclease than their 21mer variant (HPG21), the designed hairpin HPNC (with a 21 bp stem and 5 T residue loop) and the non-self-complementary oligomer (OLIGO-2). The single-stranded oligomer of non-self-complementary nature exhibited maximum degradation, while oligonucleotide HPG21 showed the greatest degradation among the three HP sequences. As a rule the structure with the lowest number of unpaired bases and maximum compactness should show maximum resistance to cleaving nucleases. Thus, the HPG11 sequence has more thermostability than HPA11 and is least degraded with time. This finding explains the high stability of minihairpins to nucleases, with d(TGGGGGCCCCA) having fewer (one) unstacked and non-base paired nucleotides. Comparing the nuclease resistance of HPG11 and the designed hairpin HPNC, we find that the HPNC hairpin with 5 T residues in the loop is more sensitive to nuclease. It seems conceivable that in the case of HPA11 and HPG11, the base stacking arrangements within the double-helical stem region is transmitted into the loop (single G or A residue) and this governs the conformation and stability of the loop.
Figure 12.
Time course of degradation of HPG11, HPA11, HPNC, HPG21 and OLIGO2 caused by nuclease S1 as monitored by the increase in absorbance at 260 nm.
CONCLUSION
Based on optical melting, gel electophoresis, circular dichroism and nuclease digestion experiments, we conclude that the quasi-palindromic d(TGGGGACCCCA) (HPA11) and d(TGG GGGCCCCA) (HPG11) sequences exist in hairpin–duplex equilibria. The positive CD signal at 260–265 nm has recently been interpreted (41) as the signature of A-like guanine–guanine stacking in sequences containing tracts of guanine, while the positive peak at 285 nm is a typical feature of B-like DNA. We propose that the disappearance of the 265 nm positive CD signal in an oligomer concentration-dependent manner is an indication of a change from A- to B-form DNA (A→B transition). Since, most likely, the peak at 285 nm is due to an intermolecular duplex prevalent at high oligomer concentrations, the species generating the 265 nm peak is the intramolecular hairpin form. The LCR is a major genetic regulatory element, creating and maintaining active chromatin domains and regulating transcription of active genes located throughout the β-globin gene cluster, known to be a regulatory region for expression of the β-globin gene. These minihairpin sequences may contribute to the formation of stable hairpin or cruciform structures in the HS4 region of the LCR. This structural polymorphism may cause variations in the DNase hypersensitivity, as well as chromatin remodeling. Since such events are known to affect the binding of various transcription factors (Fig. 1b), this might have implications for regulation of expression of the gene. Moreover, as the palindromic sequences are widely interspersed in the whole genome, they are candidates for involvement in the regulatory processes due to the structural phenomena associated with them.
Acknowledgments
ACKNOWLEDGEMENTS
S.K. thanks Dr Daman Saluja (Delhi University) and Mr Adesh (IGIB) for their kind help in facilitating the PAGE experiment. Thanks are also due to Prof. Kunal B. Roy for helpful discussions during revision of the manuscript. The authors gratefully acknowledge the critical and valuable comments by the anonymous referee which allowed improvement of the manuscript.
REFERENCES
- 1.Sinden R.R. (1994) DNA Structure and Function. Academic Press, New York, NY. [Google Scholar]
- 2.Saenger W. (1984) Principles of Nucleic Acid Structure. Springer-Verlag, New York, NY. [Google Scholar]
- 3.Brahmachari S.K., Meera,G., Sarkar,P.S., Balagurumoorthy,P., Tripathi,J., Raghavan,S., Shaligram,U. and Pataskar,S. (1995) Simple repetitive sequences in the genome: structure and functional significance. Electrophoresis, 16, 1705–1714. [DOI] [PubMed] [Google Scholar]
- 4.Weber I.T., McKay,D.B. and Steitz,T.A. (1982) Two helix DNA binding motif of CAP found in lac repressor and gal repressor. Nucleic Acids Res., 10, 5085–5101. [DOI] [PMC free article] [PubMed] [Google Scholar]
- 5.Kim J.L., Nikolov,D.B. and Burley,S.K. (1993) Co-crystal structure of TBP recognizing the minor groove of TATA element. Nature, 365, 520–527. [DOI] [PubMed] [Google Scholar]
- 6.Varani G. (1995) Exceptionally stable nucleic acid hairpins. Annu. Rev. Biophys Biomol. Struct., 24, 379–404. [DOI] [PubMed] [Google Scholar]
- 7.Glucksmann-Kuis M.A., Dai,X., Markiewicz,P., Rothman-Denes,L.B. (1996) E. coli SSB activates N4 virion RNA polymerase promoters by stabilizing a DNA hairpin required for promoter recognition. Cell, 84, 147–154. [DOI] [PubMed] [Google Scholar]
- 8.Drew H.R., Wing,R.M., Takano,T., Broka,C., Tanaka,S., Itakura,K. and Dickerson,R.E. (1981) Structure of a B-DNA dodecamer: conformation and dynamics. Proc. Natl Acad. Sci. USA, 78, 2179–2183. [DOI] [PMC free article] [PubMed] [Google Scholar]
- 9.Marky L.A., Blumenfeld,K.S., Kozlowski,S. and Breslauer,K.J. (1983) Salt-dependent conformational transitions in the self-complementary deoxydodecanucleotide d(CGCGAATTCGCG): evidence for hairpin formation. Biopolymers, 22, 1247–1257. [DOI] [PubMed] [Google Scholar]
- 10.Senior M.M., Jones,R.A. and Breslauer,K.J. (1988) Influence of loop residues on the relative stabilities of DNA hairpin structures. Proc. Natl Acad. Sci. USA, 85, 6242–6246. [DOI] [PMC free article] [PubMed] [Google Scholar]
- 11.Hasnoot C.A.G., Hilbers,C.W., Vander Marel,G.A., Van Boom,J.H., Singh,U.C., Pattabiraman,N. and Kollman,P.A. (1986) On loopfolding in nucleic acid hairpin-type structures. J. Biomol. Struct. Dyn., 3, 843–857. [DOI] [PubMed] [Google Scholar]
- 12.Xodo L.E., Manzini,G., Quadrifoglio,F., Vander Marel,G. and Van Boom,J. (1991) DNA hairpin loops in solution. Correlation between primary structure, thermostability and reactivity with single-strand-specific nuclease from mung bean. Nucleic Acids Res., 19, 1505–1511. [DOI] [PMC free article] [PubMed] [Google Scholar]
- 13.Bagga R., Ramesh,N., Brahmachari,S.K. (1990) Supercoil-induced unusual DNA structures as transcriptional block. Nucleic Acids Res., 18, 3363–3369. [DOI] [PMC free article] [PubMed] [Google Scholar]
- 14.Dai X., Greizerstein,M.B., Madas-Chinni,K. and Rothman-Denes,L. (1997) Supercoil-induced extrusion of a regulatory DNA hairpin. Proc. Natl Acad. Sci. USA, 94, 2174–2179. [DOI] [PMC free article] [PubMed] [Google Scholar]
- 15.Chou S.-H., Tseng,Y.Y. and Chu,B.-Y. (1999) Stable formation of pyrimidine-rich loop hairpin in a cruciform promoter. J. Mol. Biol., 292, 309–320. [DOI] [PubMed] [Google Scholar]
- 16.Heidenfelder B.L., Makhov,A.M. and Topa,M.D. (2003) Hairpin formation in Friedreich’s ataxia triplet repeat expansion. J. Biol. Chem., 278, 2425–2431. [DOI] [PubMed] [Google Scholar]
- 17.Sriroongrueng W., Schleiemacher,E., Panich,V., Nopparatana,C., Saechan,V., Laosombat,V., Pornpatkul,M. and Fukumaki,Y. (1997) Analysis of β-thalassemia mutations and β-locus control region hypersensitive sites 2, 3 and 4 in southern Thailand. Asian J. Trop. Med. Public Health, 28, 120–127. [PubMed] [Google Scholar]
- 18.Kukreti R., B-Rao,C., Das,S.K., De,M., Talukder,G., Vaz,F., Verma,I.C. and Brahmachari,S.K. (2002a) Study of the single nucleotide polymorphism (SNP) at the palindromic sequence of hypersensitive site (HS)4 of the human β-globin locus control region (LCR) in Indian population. Am. J. Hematol., 69, 77–79. [DOI] [PubMed] [Google Scholar]
- 19.Kukreti R., Dash,D., Chakravarty,E.V.K., Das,S., De,M. and Talukder,G. (2002b) Spectrum of β-thalassemia mutations and their association with allelic sequence polymorphism at the β-globin gene cluster in an eastern Indian population. Am. J. Hematol., 70, 269–277. [DOI] [PubMed] [Google Scholar]
- 20.Cantor C.R., Warshaw,M.M. and Shapiro,H. (1970) Oligonucleotide interactions. 3. Circular dichroism studies of the conformation of deoxyoligonucleotides. Biopolymers, 9, 1059–1077. [DOI] [PubMed] [Google Scholar]
- 21.Sambrook J., Fritsch,E.F. and Maniatis,T. (1989) Molecular Cloning: A Laboratory Manual, 2nd Edn. Cold Spring Harbor Laboratory Press, Cold Spring Harbor, NY. [Google Scholar]
- 22.Roy K.B., Kukreti,S., Chauhan,V.S. and Rajeswari,M.R. (1994) Hairpin formation in d-AAGCTTAAGCTT under high salt conditions shows unusual properties. J. Biomol. Struct. Dyn., 11, 1041–1048. [DOI] [PubMed] [Google Scholar]
- 23.Roy K.B., Kukreti,S., Bose,H.S., Chauhan,V.S. and Rajeshwari,M.R. (1992) Hairpin and duplex forms of a self-complementary dodecamer, d-AGATCTAGATCT and interaction of the duplex form with the peptide KGWGK: can a pentapeptide destabilize DNA? Biochemistry, 31, 6241–6245. [DOI] [PubMed] [Google Scholar]
- 24.Kallenbach N.R., Ma,R.-I. and Seeman,N.C., (1983) An immobile nucleic acid junction constructed from oligonucleotides. Nature, 305, 829–831. [Google Scholar]
- 25.Xodo L.E., Manzini,G., Quadrifoglio,F., Yathindra,N. and Van der Marel,J.H., (1989) A facile duplex-hairpin interconversion through a cruciform intermediate in a linear DNA fragment. J. Mol. Biol., 205, 777–781. [DOI] [PubMed] [Google Scholar]
- 26.Avizonis D.Z. and Kearns,D.R., (1995) Kinetic and thermodynamic characterization of DNA duplex-hairpin interconversion for two DNA decamers: d(CAACGGGTTG) and d(CAACCCGTTG). Biopolymers, 35, 187–200. [DOI] [PubMed] [Google Scholar]
- 27.Hirao I., Nishimura,Y., Tagawa,Y., Watanabe,K. and Niura,K. (1992) Extraordinarily stable minihairpins: electrophoretical and thermal properties of the various sequence variants of d(GCGAAAGC) and their effect on DNA sequencing. Nucleic Acids Res., 20, 3891–3896. [DOI] [PMC free article] [PubMed] [Google Scholar]
- 28.Hirao I., Kawai,G., Yoshizawa,S., Nishimura,Y., Ishido,Y., Watanabe,K. and Miura,K. (1994) Most compact hairpin-turn structure exerted by a short DNA fragment, d(GCGAAGC) in solution: an extraordinarily stable structure resistant to nucleases and heat. Nucleic Acids Res., 22, 576–582. [DOI] [PMC free article] [PubMed] [Google Scholar]
- 29.El Amri C., Mauffert,O., Monnot,M., Tevanian,G., Lescot,E., Porumb,H. and Fermandjian,S. (1999) A DNA hairpin with a single residue loop closed by a strongly distorted Watson–Crick G.C base pair. J. Mol. Biol., 294, 427–442. [DOI] [PubMed] [Google Scholar]
- 30.Nakano M., Moody,E.M., Liang,J. and Bevilacqua,P.C. (2002) Selection for thermodynamically stable DNA tetraloops using temperature gradient gel electrophoresis reveals four motifs: d(cGNNAg), d(cGNABg), d(cCNNGg) and d(gCNNGc). Biochemistry, 41, 14281–14292. [DOI] [PubMed] [Google Scholar]
- 31.Yoshizawa S., Kawai,G., Watanabe,K., Miura,K. and Hirao,I. (1997) GNA trinucleotide loop sequence producing extraordinarily stable DNA minihairpins. Biochemistry, 36, 4761–4767. [DOI] [PubMed] [Google Scholar]
- 32.Yoshizawa S., Ueda,T., Ishido,Y., Miura,K., Watanabe,K. and Hirao,S. (1994) Nuclease resistance of an extraordinarily thermostable mini-hairpin DNA fragment, d(GCGAAGC) and its application to in vitro protein synthesis. Nucleic Acids Res., 22, 2217–2222. [DOI] [PMC free article] [PubMed] [Google Scholar]
- 33.Vallone P.M., Paner,T.M., Hilario,J., Lane,M.J., Faldasz,B.D. and Benight,A.S. (1999) Melting studies of short DNA hairpins: influence of loop sequence and adjoining base pair identity on hairpin thermodynamic stability. Biopolymers, 50, 425–442. [DOI] [PubMed] [Google Scholar]
- 34.Gao Y.G., Robinson,H. and Wang,A.H. (1999) High-resolution A-DNA crystal structures of d(AGGGGCCCCT). An A-DNA model of poly (dG).poly (dC). Eur. J. Biochem., 261, 413–420. [PubMed] [Google Scholar]
- 35.Hilbers C.W., Heus,H.A., Van Dongen,M.J.P. and Wijmenga,S.S. (1994) The hairpin elements of hairpin structure: DNAS and RNA folding. In Eckstein,F. and Lilly,D.M.J. (eds), Nucleic Acids and Molecular Biology. Springer Verlag, Berlin, Germany, pp. 56–104. [Google Scholar]
- 36.Ivanov V.I., Minchenkova,L.E., Schyolkina,A.K. and Poletayev,A.I. (1973) Different conformations of double stranded nucleic acids in solution as revealed by circular dichroism. Biopolymers, 12, 89–110. [DOI] [PubMed] [Google Scholar]
- 37.Johnson W.C. (1994) CD of nucleic acids. In Nakanishi,K., Berova,N. and Woody,R.W. (eds), Circular Dichroism: Principles and Applications. VCH, New York, NY, pp. 523–540. [Google Scholar]
- 38.Chen F.-M. (1989) Hairpin formation of d-(CGCG-TA-CGCG), d-(CGCG-TG-CGCG) and their cytosine methylated analogs. J. Biomol. Struct. Dyn., 6, 1239–1257. [DOI] [PubMed] [Google Scholar]
- 39.Trantirek L., Stefl,R., Vorlickova,M., Koca,J., Skelenar,V. and Kypr,J. (2000) An A-type double helix of DNA having B-type puckering of the deoxyribose rings. J. Mol. Biol., 297, 907–922. [DOI] [PubMed] [Google Scholar]
- 40.Ng H.-L., Kopka,M.L. and Dickerson,R.E. (2000) The structure of a stable intermediate in the A↔B DNA helix transition. Proc. Natl Acad. Sci. USA, 97, 2035–2039. [DOI] [PMC free article] [PubMed] [Google Scholar]
- 41.Kypr J. and Vorlickova,M. (2002) Circular dichroism spectroscopy reveals invariant conformation of guanine runs in DNA. Biopolymers, 67, 275–277. [DOI] [PubMed] [Google Scholar]
- 42.Kypr J., Fialova,M., Chladkova,J., Tumova,M. and Vorlickova,M. (2001) Conserved guanine-guanine stacking in tetraplex and duplex DNA. Eur. Biophys. J., 30, 555–558. [DOI] [PubMed] [Google Scholar]
- 43.Stefl R., Trantirek,L., Vorlickova,M., Koca,J., Skelenar,V. and Kypr,J. (2001) A-like guanine-guanine stacking in the aqueous DNA duplex of d(GGGGCCCC). J. Mol. Biol., 307, 513–524. [DOI] [PubMed] [Google Scholar]
- 44.Lindquist M. and Graslund,A. (2001) An FTIR and CD study of the structural effects of G-tract length and sequence context on DNA conformation in solution. J. Mol. Biol., 314, 423–432. [DOI] [PubMed] [Google Scholar]
- 45.Benevides J.M., Wang,A.H.-J., Rich,A., Kyogoku,Y., Vander Marel,G.A., Van Boom,J.H. and Thomas,G.J.,Jr (1986) Raman spectra of single crystals of r-(GCG), d-(CGC) and d-(CCCCGGGG) as models of a DNA, their structure transitions in aqueous solution and comparison with double-helical poly (dG).poly (dC). Biochemistry, 25, 41–50. [DOI] [PubMed] [Google Scholar]
- 46.Nishimura Y., Torigoe,C. and Tsuboi,M. (1985) An A-form poly(dG).poly(dC) in H2O solution. Biopolymers, 24, 1841–1844. [DOI] [PubMed] [Google Scholar]
- 47.Dickerson R.E. (1999). In Neidle,S. (ed.), Oxford Handbook of Nucleic Acid Structure. Oxford University Press, New York, NY, pp. 145–197. [Google Scholar]
- 48.Timisit Y. (1999) DNA structure and polymerase fidelity. J. Mol. Biol., 293, 835–853. [DOI] [PubMed] [Google Scholar]
- 49.Ivanov V.I., Minchenkova,L.E., Minyat,E.E., Frank-Kamenetskii,M.D. and Schyolkina,A.K. (1974) The B-to-A transition of DNA in solution. J. Mol. Biol., 87, 817–823. [DOI] [PubMed] [Google Scholar]
- 50.Arnott S. (1999). In Neidle,S. (ed.), Oxford Handbook of Nucleic Acids Structure. Oxford University Press, New York, NY, pp. 1–38. [Google Scholar]
- 51.Wahl M.C. and Sundralingam,M. (1999) In Neidle,S. (ed.), Oxford Handbook of Nucleic Acids Structure. Oxford University Press, New York, NY, pp. 117–144. [Google Scholar]
- 52.Goodsell D.S., Kopka,M.L., Cascio,D.C. and Dickerson,R.E. (1993) Crystal structure of CATGGCCATG and its implications for A-tract bending models. Proc. Natl Acad. Sci. USA, 90, 2930–2934. [DOI] [PMC free article] [PubMed] [Google Scholar]
- 53.Balagurumoorthy P., Brahmachari,S.K., Mohanty,D., Bansal,M. and Sasisekharan,V. (1992) Hairpin and parallel quartet structures for telomeric sequences. Nucleic Acids Res., 20, 4061–4067. [DOI] [PMC free article] [PubMed] [Google Scholar]
- 54.Balagurumoorthy P. and Brahmachari,S.K. (1994) Structure and stability of human telomeric sequence. J. Biol. Chem., 269, 21858–21869. [PubMed] [Google Scholar]
- 55.Lu M., Guo,Q. and Kallenbach,N.R. (1993) Thermodynamics of G-tetraplex formation by telomeric DNAs. Biochemistry, 32, 598–601. [DOI] [PubMed] [Google Scholar]
- 56.Mergny J.L. (1998) Following G-quartet formation by UV-spectroscopy. FEBS Lett., 435, 74–78. [DOI] [PubMed] [Google Scholar]
- 57.Hirao I., Nishimura,Y., Naraoka,T., Watanabe,K., Arata,Y. and Miura,K. (1989) Extraordinary stable structure of short single-stranded DNA fragments containing a specific base sequence: d-(GCGAAAGC). Nucleic Acids Res., 17, 2223–2231. [DOI] [PMC free article] [PubMed] [Google Scholar]


