

Abstract
Background & Aims:
The therapeutic mechanisms of ribavirin for hepatitis C are unclear. Microarray analyses have shown that ribavirin increases induction of interferon-stimulated genes (ISGs). We evaluated viral kinetics, serum cytokine expression, and viral mutagenesis during early stages of peginterferon therapy with and without ribavirin.
Methods:
Fifty patients with chronic hepatitis C virus (HCV) infection genotype 1 were randomly assigned to groups that were given peginterferon alfa-2a, with or without ribavirin, for 4 weeks; all patients then received an additional 44 weeks of combination therapy. First- and second-phase viral kinetics were evaluated. Serum levels of IP10, MIG, and MCP1 were quantified as measures of the ISG response. NS5A and NS5B were partially sequenced and mutation rates were calculated.
Results:
The first-phase decrease in HCV RNA was similar between groups. Patients that received ribavirin had a more rapid second-phase decrease, compared with patients that did not receive ribavirin—particularly those with an adequate first-phase decrease (0.61 vs. 0.35 log10 IU/mL/week, p=0.018). At 12 hrs, fold induction of serum IP10 was higher in patients given the combination therapy than those given only peginterferon (7.6- vs. 3.8-fold, p=0.01); however, the difference was greatest in patients with an adequate first-phase decrease in HCV RNA. IP10-induction correlated with first- and second-phase kinetics and with ribavirin serum concentrations on day 3. HCV mutation rates were similar between groups.
Conclusion:
Ribavirin improves the kinetics of the early response to therapy in patients with an adequate initial response to peginterferon. Induction of interferon-stimulated cytokines correlates with viral kinetics following ribavirin therapy, suggesting that ribavirin promotes interferon signaling.
Keywords: Ribavirin, interferon-stimulated genes (ISGs), IP10, viral kinetics, mechanism of action, hepatitis C, gene induction, mutagenesis, interferon
Introduction
Since the initial use of interferon monotherapy in 1986, great strides have been made in the treatment of chronic hepatitis C virus (HCV) infection. The addition of the guanosine analogue ribavirin improved on-treatment clearance of viremia, and perhaps more importantly, decreased relapse rates and improved rates of sustained virological response after a complete course of therapy. Even with the recent development of potent HCV protease and polymerase inhibitors, ribavirin appears to be necessary to maximize response rates1. Although landmark clinical trials demonstrated the beneficial effect of ribavirin more than 10 years ago, the mechanism by which it improves treatment responses remains poorly understood2-4.
Numerous mechanisms of action for ribavirin have been proposed including inosine monophosphate dehydrogenase (IMPDH) inhibition5, direct viral inhibition6, promotion of a Th1 immune response7, increased mutagenesis leading to error catastrophe8, 9 and more recently, up-regulation of genes involved in interferon-signaling10-12. Although there is experimental evidence for each of these mechanisms, none has been convincingly shown to be responsible for the beneficial outcomes seen with the addition of ribavirin13.
Important insights into the understanding of viral clearance during interferon therapy have come from studying early viral kinetics on treatment. By fitting mathematical models to match the observed decline in viremia during interferon monotherapy, Neumann and colleagues offered explanations for the observed biphasic decline in viral load14. They proposed that interferon acts initially by inhibiting production of new virions, leading to a rapid first-phase decline in viremia. This is followed by a second, more variable phase of decline, which results from clearance of virus-producing infected cells. Attempts to use viral kinetics to understand the mechanism of action of ribavirin have yielded less consistent results. Pawlotsky and colleagues found that ribavirin monotherapy led to an early, but only transient, decline in HCV RNA levels. When combined with standard interferon, ribavirin also reduced the rebound of viremia seen between doses, but it had minimal influence on second phase kinetics15. Using a modification of the original model to account for the effect of ribavirin on early interferon-related viral kinetics, Dixit and colleagues found that in patients with rapid first-phase kinetics ribavirin had no appreciable effect on viral decline; however in those with less pronounced responses to interferon, ribavirin had an important effect on subsequent second phase kinetics16. They suggested that these findings were consistent with the ‘mutagenesis error-catastrophe’ hypothesis as an explanation for the mechanism of action of ribavirin. In contrast, Hermann et al found that ribavirin had a minimal effect on second-phase kinetics when combined with peginterferon, but resulted in a late ‘third-phase’ viral decline in some patients, which they attributed to a ribavirin-induced restoration of the immune response17. Dahari and colleagues recently suggested that the ‘tri-phasic’ kinetics seen in some patients could also be explained by including hepatocyte proliferation into kinetic models18.
To further understand the effect of ribavirin on early viral kinetics during combination therapy, patients were randomized to begin therapy with peginterferon alfa 2a alone or in combination with standard doses of ribavirin for the first 4 weeks of therapy. The effect of ribavirin on viral kinetics was evaluated, and cytokine levels and mutation rates were determined to help clarify the mechanism behind the observed effects.
Methods
Treatment-naïve patients infected with HCV genotype 1 evaluated at the Clinical Center of the National Institutes of Health (NIH) were recruited for study participation. For study inclusion, patients had to be 18 years of age with chronic HCV infection and a liver biopsy within 2 years of study entry. Patients with hepatitis B (HBV) or human immunodeficiency virus (HIV) co-infection were excluded, as were those with other causes of chronic liver disease or co-morbidities precluding interferon therapy. The study protocol was registered (NCT00028093) and consent forms were reviewed and approved by the Institutional Review Board of the National Institute of Diabetes and Digestive and Kidney Diseases (NIDDK). All patients signed informed consent. Peginterferon alfa-2a (Pegays™) and ribavirin (Copegus™) were kindly provided by Roche (Nutley, NJ) under a Clinical Trial Agreement with the NIDDK and the study was conducted under an Investigation New Drug application (10168 Sponsor JHH).
Eligible patients were randomized by random number generator to either: Group A: peginterferon alfa 2a 180 μg sc once weekly and weight-based oral ribavirin (1000 mg daily for patients <75 kg and 1200 mg daily for patients ≥75 kg) for 48 weeks or Group B: peginterferon alfa 2a 180 μg sc once weekly for the first four weeks of therapy, after which peginterferon was continued at the same dose and weight-based oral ribavirin was added and continued for a further 44 weeks. Twenty-five patients were recruited to each treatment group. Compliance was monitored by patient diary.
Viral kinetics were evaluated during therapy. Quantitative HCV RNA was measured on 3 occasions before therapy, at time 0, 12, 24, 48, 72 hours and at day 7, 14, 21 and 28. Patients were then seen at weeks 6 and 8, monthly until week 24 and then every 2 months until the end of therapy. Patients who remained HCV RNA positive at week 24 were given the option of stopping treatment or continuing therapy for a full 48 weeks.
Standard definitions of response were used. Undetectable HCV RNA at week 4 was considered to represent a rapid virological response (RVR) and patients who were HCV RNA negative or had a 2-log10 IU/mL decline in HCV RNA by week 12 were categorized as having a complete or partial early virological response (EVR). End-of-treatment response was defined as absence of detectable serum HCV RNA at the end of 48 weeks of therapy. Patients who remained HCV RNA negative 6 months after stopping treatment were deemed to have a sustained virological response (SVR). Patients who were HCV RNA negative at the end of therapy but positive thereafter were defined as relapsers.
Laboratory Testing
Quantitative HCV RNA testing was done using Cobas Amplicor with a sensitivity of 600 IU/mL. Samples negative by the quantitative test were retested using a qualitative in-house polymerase chain reaction (PCR) assay with a sensitivity of 50 IU/mL. For the purpose of analysis, samples that were negative by the quantitative test but positive by PCR were assigned a value of 300 IU/mL. Patients negative by both assays were assigned a value of 10 IU/mL. HCV genotype was determined using the INNO-LiPA assay and confirmed by nucleotide sequencing of a region of NS5B.
Serum Cytokine Levels
Serum cytokine levels including interferon-gamma-inducible-protein-10 (IP10), interferon-gamma (IFNγ), interleukin-4 (IL4), interleukin-5 (IL5), interleukin-8 (IL8), monocyte chemoattractant protein 1 (MCP1) and monokine induced by interferon gamma (MIG) were measured using cytometric bead array (BD Biosciences, San Jose, CA). Cytokine levels were measured in samples taken at 0 and 12 hours, 3 and 7 days after the first dose of peginterferon.
Ribavirin Concentration
A novel LC-MS/MS method was developed to determine serum ribavirin content.
A solid phase extraction technique (bond elut-PBA cartridges, Varian) was used for sample preparation. Serum samples (200μL) were spiked with 5-methylcytidine (internal standard) and pretreated with 600μL ammonium acetate buffer (250mM ammonium acetate adjusted to pH 8.6 with ammonium hydroxide). The resulting extractant was evaporated at 40°C, reconstituted with 200μL deionized water, and samples (20μL) were injected into a Shimadzu LC system including a 150×4.6mm (5μ) ABZ+Plus Supelcosil (Supelco) column at 30° C, isocratic flow rate (200uL/min) of 0.1% formic acid in water and 0.1% formic acid in methanol (86.5/13.5%).. An ABI 3000 tandem mass spectrometer was used for analyte detection (245→113 and 258→126 m/z for ribavirin and IS, respectively) using multiple reaction mode (MRM). . The method was qualified for accuracy and precision over three days using 200μL of spiked control human serum. Concentrations ranged from 10 ng/mL to 10μg/mL. The calibration curve is linear with a lower limit of quantification (LLOQ) of 10ng/mL, a correlation coefficient r=0.9990 and intra- and inter-day precision and accuracy of less than 5.0% relative standard deviation.
Mutation Rate Determination
HCV RNA samples were sequenced from treatment days 0, 7 and 28 as described in supplementary methods.
Statistical and Viral Kinetic Analysis
Baseline characteristics were compared between groups using the Student's t test for continuous variables and the Fisher's Exact test for categorical variables. HCV RNA values were log-transformed for all analyses. The first phase decline was calculated as the absolute logarithmic decline in HCV RNA from time 0 to 48 hours of treatment. Epsilon, previously defined as the efficacy of clearing free virus14, was determined by 1-(10−first phase decline). Rebound was determined as the absolute change in HCV RNA from the nadir between 0 and 72 hours to the level at day 7. Second phase slope was calculated as the slope of the regression line of log HCV RNA level from day 7 to 28. Similarly, third phase decline evaluated the change in log HCV RNA level from day 28 to 84. For patients who became HCV RNA negative, slope calculations were determined for each interval until the time of negativity. As a sensitivity analysis, slope calculations were also performed to the time of unquantifiable but still PCR positive HCV RNA to ensure that arbitrary values assigned for low HCV RNA titers did not affect the results. All HCV RNA and slope comparisons between groups were performed using the non-parametric Mann-Whitney U test. An adequate first-phase decline was defined as ≥0.5 log10IU based on receiver operator characteristic (ROC) curve for the threshold associated with treatment non-response in this cohort as well as previous literature19-21. To ensure that results were robust, sensitivity analysis using various thresholds for an adequate first phase decline was performed. An adequate second-phase slope was defined as ≥0.35 log10IU/week, based on ROC curve analysis from this cohort and data showing that patients with second phase slopes below this threshold are unlikely to achieve SVR22. Logistic regression was performed to assess factors associated with SVR, EVR, first and second phase decline. Statistical analysis was performed using Prism version 4 and Stata version 9.2.
Results
Baseline characteristics were similar between the two groups (Table 1). Two patients, one from each group, were excluded from the analysis. One patient who was initially reported to have genotype 1 infection was found to have genotype 6 infection by sequencing of the NS5B region. The second patient suffered a cerebro-vascular accident during the second week of therapy and stopped treatment early, precluding viral kinetic calculations.
Table 1.
Baseline Characteristics of Patients
| Peginterferon + Ribavirin (Group A) N=25 |
Peginterferon Alone (Group B) N=25 |
P-Value | |
|---|---|---|---|
| Male | 14 (56%) | 10 (40%) | 0.26 |
|
| |||
| Age (range) [Years] | 49 (35-68) | 52 (28-67) | 0.23 |
|
| |||
| Race | |||
| Caucasian | 17 (68%) | 21 (84%) | 0.63 |
| African American | 4 (16%) | 2 (8%) | |
| Asian | 2 (8%) | 1 (4%) | |
| Hispanic | 2 (8%) | 1 (4%) | |
|
| |||
|
Duration of Infection [Years]* |
23 ± 9.0 | 23 ± 7.7 | 0.50 |
|
| |||
| Mode of Infection | |||
| Injection drug use | 10 (40%) | 8 (32%) | 0.95 |
| Blood Transfusion | 8 (32%) | 9 (36%) | |
| Other | 5 (20%) | 6 (24%) | |
| Unknown | 2 (8%) | 2 (8%) | |
|
| |||
| Weight [kg]* | 78.1 ± 17 | 76.8 ± 19 | 0.79 |
|
| |||
| BMI [kg/m2]* | 26.9 ± 4.9 | 27.0 ± 4.8 | 0.96 |
|
| |||
| ALT [U/L]* | 69 ± 61 | 96 ± 79 | 0.12 |
|
| |||
| Ishak Fibrosis | |||
| 0-2 | 15 (60) | 16 (64) | 0.77 |
| 3-6 | 10 (40) | 9 (36) | |
|
| |||
|
Histology Activity Index* |
8 (5-13) | 8 (3-15) | 0.98 |
|
| |||
|
HCV RNA Level [log10IU/mL]* |
6.2 ± 0.53 | 6.2 ± 0.58 | 0.78 |
|
| |||
| Genotype | |||
| 1 | 4 (16%) | 5 (20%) | 0.92 |
| 1a | 8 (32%) | 7 (28%) | |
| 1b | 13 (52%) | 13 (52%) | |
Abbreviations: BMI, body mass index; ALT, alanine aminotransferase.
Mean ± SD or median with range, P-values calculated by Student's T or Fisher's Exact Test
Viral Kinetics
Mean HCV RNA levels during the first 12 weeks of therapy by treatment group are shown in Figure 1. Levels of HCV RNA were similar in the two groups at the start of therapy and during the first three days after the initial injection of peginterferon (first phase: Figure 1a). Between day 7 and day 28, the slope of the decline in HCV RNA levels was steeper in the patients treated with combination therapy than in those on peginterferon alone (second phase: Figure 1b). The slope of decline in HCV RNA was similar in the two groups between days 28 and 84 (when both groups were receiving combination therapy) (third phase: Figure 1c).
Figure 1.
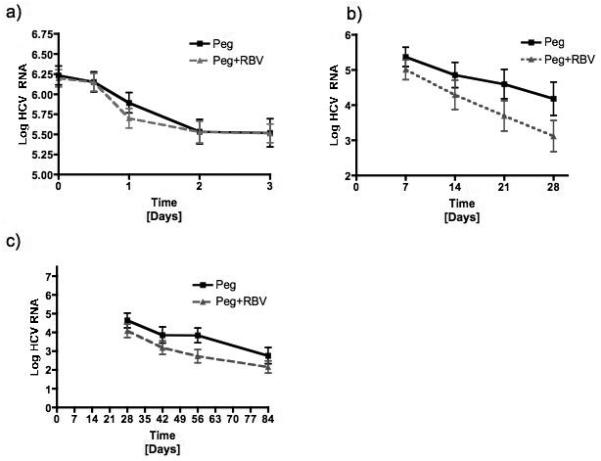
Mean serum log10IU/mL of HCV RNA from a) day 0 to day 3, b) day 7 to day 28 and c) day 28 to day 84 comparing patients receiving peginterferon alone (Peg) to those receiving both peginterferon and ribavirin (Peg+Rbv) during treatment.
The average calculated viral kinetic results are shown in Table 2 and compared by treatment group in Figure 2. First phase decline of HCV RNA and epsilon were similar between groups (Figure 2a). In contrast, patients receiving combination therapy had a trend toward a more rapid second phase decline than those receiving peginterferon alone (p=0.09) (Figure 2b).
Table 2.
Viral Kinetics
| Median (range) |
Peginterferon + Ribavirin (Group A) N=24 |
Peginterferon Alone (Group B) N=24 |
P- Value† |
|---|---|---|---|
| Phase 1 Decline [log10 IU/mL] | 0.50 (−0.40-2.30) | 0.70 (−0.10-1.70) | 0.54 |
|
| |||
| Epsilon (ε) | 0.68 (0-0.995) | 0.80 (0-0.98) | 0.57 |
|
| |||
| Rebound [log10IU/mL] | 0.01 (−2.51-0.68) | 0.25 (−0.8-1.6) | 0.091 |
| Rebound > 0.3 log10IU/mL | 5 (21%) | 12 (50%) | 0.035 |
|
| |||
| Phase 2 Slope (Day 7-28) [log10IU/mL/week) |
0.41 (0.02-1.0) | 0.21 (−0.06-1.0) | 0.093 |
|
| |||
| Phase 2 Slope [−log10IU/week] | |||
| Phase 1 decline>0.5 log10IU/mL | 0.49 (0.03-1.0) | 0.37 (−0.06-0.96) | 0.018 |
| Phase 1 decline<0.5 log10IU/mL | 0.14 (0.02-0.38) | 0.12 (−0.06-0.28) | 0.63 |
|
| |||
| Phase 3 Slope (Day 28-84) [−log10IU/mL] | 0.33 (0.03-1.59) | 0.26 (0.04-0.92) | 0.35 |
|
| |||
| Acceleration | |||
| Change in Slope Phase 2 to 3 | −0.05 (−0.49-1.15) | 0.09 (−0.66-0.44) | 0.14 |
| Acceleration >0.1 log10IU/week with slow 2nd Phase* | 4/12 (33%) | 10/14 (71%) | 0.11 |
Groups compared using Mann-Whitney U test
Denominator represents patients in each group with a poor second phase slope who were still on treatment and HCV RNA PCR positive at week 4.
Figure 2.
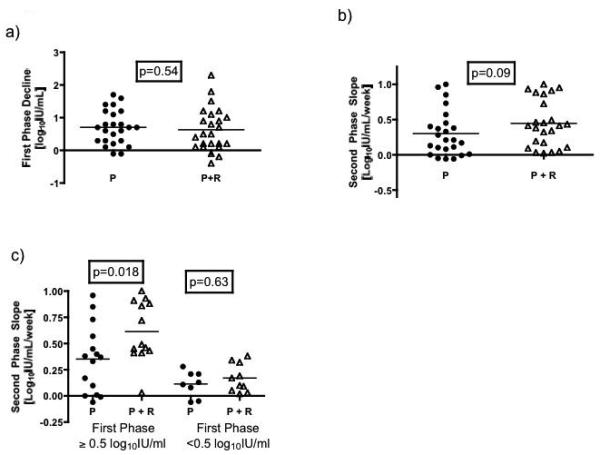
Comparison of individual values for early viral kinetics by treatment group. a) There was no difference between the two groups in first phase decline defined as the absolute reduction in HCV RNA concentration from 0 to 48 hours. b) Patients receiving both peginterferon and ribavirin had a more rapid second phase slope (regression line of HCV RNA from day 7 to 28) than those on peginterferon alone. However, c) the difference between the two groups was seen largely in individuals with an adequate first phase decline (≥0.5 log10IU/mL).
P = peginterferon alone; P + R = peginterferon and ribavirin.
To assess whether the first-phase decline influenced second-phase kinetics, the second-phase slopes were compared after stratification by first-phase decline. Eleven patients on combination therapy and 8 patients receiving peginterferon alone had a poor first phase decline (<0.5 log10IU/mL) (p=0.56). For these patients, second phase slope was similar between treatment groups. In contrast, in patients with an adequate first phase decline (≥0.5 log10 IU/mL), those receiving combination therapy had a faster second phase slope than those treated with peginterferon alone (p=0.018) (Table 2, Figure 2c). This difference remained significant if adequate first phase decline was defined as 0.6, 0.7 or 0.75 log10 IU/mL (Supplementary Table 2).
For patients receiving combination therapy, first phase decline was predictive of second phase decline. Thus, among those with an adequate first phase decline, 12 of 13 (92%) on combination therapy went on to have an adequate second phase slope compared to just 9 of 16 (56%) receiving peginterferon alone (p=0.04). Of patients with a poor first phase decline, only 2 of 11 (18%) on combination therapy and none of 8 on peginterferon alone went on to have an adequate second phase slope (p=0.49) (Figure 3).
Figure 3.
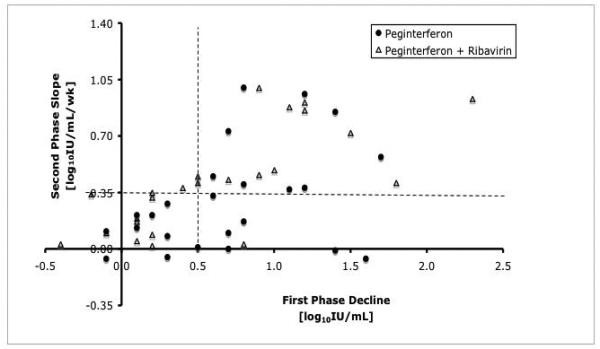
Correlation between first and second phase viral kinetic decline. Almost all patients (12 of 13) on combination therapy (open triangles) who had an adequate first phase response had an adequate second phase slope. In contrast, only 9 of 16 (56%) patients on peginterferon alone (closed circles) (p=0.04) with an adequate first phase response had an adequate second phase response. The horizontal dotted line indicates an adequate first phase decline (0.5 log10IU/mL) and the vertical dotted line indicates an adequate second phase slope (0.35 log10IU/week).
In addition to accelerating viral decline, ribavirin also appeared to reduce rebound of HCV RNA levels between the weekly doses of peginterferon. As a group, patients on combination therapy had somewhat less rebound that those on peginterferon alone (Table 2). Together these data suggest that ribavirin accelerates and maintains the interferon-induced decline in viral levels, improving second phase kinetics, but primarily in those with an initial response to peginterferon.
To evaluate the effect of ribavirin introduction at day 28, the slope from days 7 to 28 was compared with that from days 28 to 84. The groups had similar decline in HCV RNA beyond day 28 with median slopes of 0.33 vs. 0.26 log IU/mL/week (p=0.35). Given the difference between groups seen during phase 2, the equality of slopes during phase 3 suggests that the introduction of ribavirin at 4 weeks led to an acceleration in viral decline. The rate of decline in HCV RNA increased in patients newly started on ribavirin by a median of 0.09 log10 IU/mL/week (range −0.66-0.44). In contrast, patients on combination therapy from day 0 had almost no change in slope with continuing therapy past 28 days (median −0.05, range −0.49-1.15) (p=0.14).
Cytokine Levels
Cytokine levels were similar between groups at baseline. Induction of interferoninducible cytokines (IP10/MIG/MCP1)23, 24 was evaluated as measure of ISG induction by interferon and ribavirin. IP10 induction at 12 hours was significantly greater in patients receiving combination therapy (7.6±1.3) than in those on peginterferon alone (3.8±0.58, p=0.01) (Figure 4). Similar to its effects on the second phase slope, the effects of ribavirin on IP10 induction were most pronounced in patients with an adequate initial response to peginterferon. In patients with an adequate first phase decline, IP10 increased 11.1-fold in those receiving peginterferon and ribavirin but only 3.6-fold in patients on peginterferon alone (p=0.001). In patients with a poor initial response, IP10 induction was similar between groups (combination 3.8±0.66 vs. peginterferon alone 4.3±1.6, p=0.84). IP10 induction remained higher at day 3 and day 7 in ribavirin-treated patients in those with an adequate first phase decline (Figure 4b). Results were similar with other thresholds for adequacy of interferon responsiveness (Supplementary Table 3). By day 7, absolute levels were close to baseline in most patients. IP10 induction at 12 hours correlated with both first and second phase viral decline, but only in those with an adequate first phase (Figure 4c/d and Supplementary Figure 1). Results with MCP1 and MIG, two other interferon-inducible cytokines, were similar to those with IP10. Both were induced to a greater degree in ribavirin-treated patients and this difference was more notable in interferon-responders (Supplementary Figure 2). Levels of IFNγ, IL4 and IL5 were very low or undetectable in all patients and there were no differences between treatment groups. IL8 levels were near the level of detection in most patients and did not correlate with treatment group or early viral kinetics.
Figure 4.
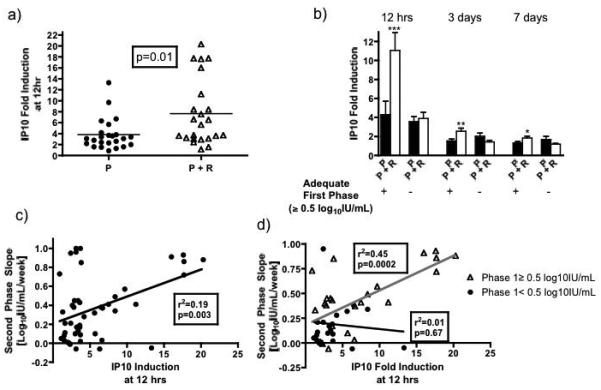
Fold-induction of serum IP10 levels at 12 hours after the initial injection of peginterferon in the two treatment groups. a) Patients receiving the combination of peginterferon and ribavirin had greater induction of IP10 at 12 hours than those on peginterferon alone. b) Similar to viral kinetics, the increase in IP10 fold-induction at 12 hours, 3 and 7 days with combination therapy was seen largely in patients with an initial adequate response to peginterferon (first phase decline ≥0.5 log10IU/mL). c) IP10 induction at 12 hours correlated with second phase slope, but d) only in those with an adequate first phase decline suggesting that ISG induction is driving viral decline. Only indicated comparisons between P and P+R with an adequate first phase decline at each time-point were statistically significant using the Mann Whitney U test (*** p=0.001, ** p=0.01, * p=0.03).
P − peginterferon, P+R − peginterferon + ribavirin.
Ribavirin Levels
Ribavirin concentration in serum ranged from 142 to 1320 ng/mL (mean 622±335 ng./mL) at day 3 and 355 to 2460 ng/mL (mean 1379±622 ng/mL) at day 28. Ribavirin concentration at day 3 did not correlate with first or second phase decline, with or without stratification by adequate first phase response. There was a non-significant trend between day 28-ribavirin concentration and second phase decline (Supplementary Figure 3a-c). Day 3 ribavirin levels were similar in patients with adequate and poor first phase decline (673±116 ng/mL vs. 566±75 ng/mL, p=0.66). Ribavirin concentration at day 3 correlated with IP10 induction at 12 hours, but only in patients with an adequate first phase decline (Supplementary Figure 3d).
Mutational Analysis
Consensus sequence data was available for 18 patients (11 combination and 7 peginterferon alone) at all three time-points (Day 0, 7 and 28) and for another 11 (6 combination and 5 peginterferon alone) at day 0 and 7. The error rate, ratio of non-synonymous to synonymous mutations and the Hamming distance were similar between treatment groups comparing all time-points (Day 0 vs. Day 7, Day 7 vs. Day 28 and Day 0 vs. Day 28) (Figure 5). There was no correlation between any measure of mutational frequency and early viral kinetics, EVR or SVR in either treatment group or the entire cohort.
Figure 5.
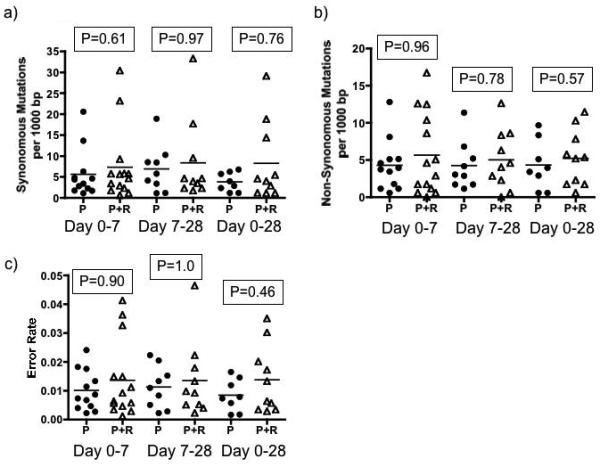
Mutation frequency with and without ribavirin. There was no difference in a) synonymous or b) non-synonymous mutations between groups. The c) error rate and d) Hamming distance were also similar between groups at all time-points measured.
Treatment Outcome
Five patients receiving combination therapy and 3 on peginterferon alone were HCV RNA negative by day 28 (RVR) (p=0.52). All but one of these patients went onto achieve an SVR. Similar numbers in each group achieved complete (42% vs. 54%) and partial EVR (21% vs. 21%). Eighteen patients on combination therapy (75%) were HCV RNA negative at the end of treatment compared to 14 who received peginterferon alone for the first month of treatment (58%) (p=0.36), but 6 patients in the combination group relapsed compared to only 1 in the peginterferon alone arm (p=0.10), resulting in similar rates of SVR (50% vs. 54%, p=1.0). Time to HCV RNA negativity did not differ between groups (Supplementary Figure 4). Baseline IP10 levels were higher in responders than non-responders to therapy, although the difference was not statistically significant (IP10 SVR: 441±63 vs. IP10 NR: 562±92 pg/mL, p=0.14).
As expected, early viral kinetics predicted ultimate treatment response. By logistic regression, RVR, EVR and SVR were all associated with a rapid first and second phase decline and a low rebound from day 3 to 7. No clinical features including treatment with ribavirin were predictive of first-phase decline. A rapid second phase slope was associated with a rapid first phase decline, combination therapy and low rebound. After controlling for first phase slope, patients treated with ribavirin were 6-fold more likely to achieve a rapid second-phase decline (Odds Ratio 6.4 95% CI 1.3-32, p=0.023).
Discussion
Despite the major contribution that ribavirin provides in improving treatment outcomes in chronic HCV infection, the mechanism by which it acts has been hard to tease apart. The poor understanding of its mechanism of action has made development of ribavirin analogues difficult. A close examination of early viral kinetics, mutagenesis and cytokine levels during peginterferon therapy with and without ribavirin offers some clues to understanding the action of this important adjunctive agent.
Ribavirin had no effect on first phase viral decline. The initial drop in viral load after starting therapy is thought to be due to inhibition of viral replication and clearance of free circulating virus by interferon, which is unlikely to be affected by any of the proposed mechanisms of ribavirin action14. In this study, the major effect of ribavirin was seen in improvement of the second phase viral decline, which is believed to be due to clearance of infected hepatocytes. Importantly, the effect of ribavirin was not observed in all patients, but only in those with an adequate initial response to peginterferon. Patients with an adequate first phase decline who received ribavirin had a significantly improved second phase slope. No difference in second phase slope was seen between treatment groups in patients with a poor first phase decline. If the first phase decline is primarily due to the effect of peginterferon, these data suggest that the addition of ribavirin leads to an acceleration in viral decline, but a prerequisite of this effect is adequate interferon responsiveness. This observation may shed some light on understanding how ribavirin improves outcomes of therapy.
Of the proposed mechanisms of action for ribavirin, those suggesting direct antiviral activity such as polymerase or IMPDH inhibition, would be expected to act independently of interferon, producing similar results in those with and without an adequate first phase decline. Similarly, promotion of a Th1 phenotype and improvement in antiviral immune responsiveness would likely also be independent of the initial efficacy of interferon16. In addition, previous studies indicate that T cell responses decline during peginterferon therapy and in this study, Th1 cytokines were low or undetectable in serum25. An immunomodulatory effect may be more important in late responses as proposed by Hermann et al who suggested that this may account for the triphasic decline seen in some patients17.
The other two proposed mechanisms of ribavirin action, mutagenesis and interferon-related gene induction, are both compatible with the kinetics data observed in this study. Dixit and colleagues suggested that the mutagenic effect of ribavirin would be more pronounced when given with interferon than as monotherapy16. They argued that during interferon treatment the production of new viral genomes is decreased, thereby increasing the concentration of ribavirin per new genome. If incorporation of ribavirin increases mutational frequency in a dose-per-remaining-genome-dependent manner, the mutagenic effect of ribavirin would be enhanced with greater efficacy of interferon. Although early viral kinetics in this study were improved with ribavirin in patients who responded to interferon, there was no increase in mutational frequency as detected by direct sequencing. It is possible that reliance on consensus sequencing rather than clonal analysis may have missed a mutagenic effect, however previous studies of the effect of ribavirin monotherapy have shown correlation between the two approaches9.
We have previously reported that hepatic ISG induction is greater in patients treated with ribavirin and peginterferon than in those treated with peginterferon alone12. In vitro data also show enhanced activation of interferon signaling with adjunctive ribavirin therapy10, 11. If ribavirin functions primarily by enhancing ISG induction, the greatest benefit would be in patients who respond to interferon, as observed in this study. In support of this mechanism, evaluation of interferon-inducible serum cytokines (IP10, MIG and MCP-1) showed greater induction in patients receiving ribavirin who had an adequate initial response to interferon. The degree of induction of IP10 correlated strongly with first and second phase decline, suggesting that the degree of ISG activation was driving viral clearance. Together these data support the concept that ribavirin acts, at least partially, through augmentation of interferon signaling.
Sensitivity analysis around the threshold for interferon responsiveness showed that the results were unchanged for a range of values. At very high thresholds for interferon responsiveness (>1.0 log10IU/mL), the improvement in second phase slope in patients receiving ribavirin was no longer significant. This is in keeping with previous kinetic modeling suggesting that when interferon efficacy is very high, ribavirin has a negligible effect on second phase. Although Dixit et al modeled ribavirin kinetics based on the mutagenesis hypothesis16, their findings are also consistent with ISG induction. Patients with maximal interferon efficacy would presumably have maximal ISG induction, as has been shown with ISG expression in PBMCs during therapy26. Further gene induction by the addition of ribavirin would be of little benefit. However, in patients with no clinical response to interferon, there is likely a significant impairment in interferon signaling, which may also affect the ability of ribavirin to induce ISGs. Ribavirin has the greatest effect in patients with an adequate, but not overwhelming, response to interferon.
If ribavirin enhances the effect of interferon, it might also then be expected to improve the initial first-phase kinetics, however this has not been observed in any studies to date. Because of the profound drop in viral load in the first 48 hours, a small additional effect of ribavirin may be difficult to observe. In the second phase, as viral levels decline more slowly, the additional benefit of ribavirin may become more apparent. An additional consideration is that ISGs involved in initial viral clearance may differ significantly from those involved in clearance of infected cells. To date, there is a little understanding of which ISGs are responsible for the antiviral effects of interferon. In this study, IP10, MIG and MCP1 were selected as convenient markers of ISG activation because they are interferon inducible and abundant in serum23, 24, although not necessarily involved in HCV clearance directly. The observation that induction of all three of these genes correlated with first and second phase decline as well as with ribavirin serum concentration, suggests that ribavirin is enhancing ISG induction broadly, which ultimately improves viral clearance despite the fact that the precise genes involved, their mechanisms and timing of action remain unknown.
Previous studies have shown that high baseline IP10 concentration correlates with non-response to therapy27, 28. In this cohort, a similar, albeit not statistically significant, pattern was observed (p=0.14). IP10 serum concentrations may be a good surrogate for intrahepatic ISG activation with high pretreatment levels of both predicting treatment non-response. Hepatic ISG induction after the first dose of interferon has been reported to be a marker of treatment responsiveness12, 29 and similarly we found that serum IP10 induction correlated with early viral kinetics. Thus, IP10 may serve as a reliable surrogate marker for hepatic ISG expression.
In summary, analysis of early viral kinetics revealed that ribavirin improved the second phase of viral decline, but only in patients with an adequate initial response to peginterferon. Ribavirin treatment enhanced interferon-related cytokine induction, which correlated with viral decline. Ribavirin showed no significant effect on mutational frequency. Although there may be multiple mechanisms by which ribavirin enhances HCV therapy, these data support the notion that ribavirin augments the activity of interferon resulting in an acceleration of viral decline.
Supplementary Material
Acknowledgments
Financial support: This research was supported by the Intramural Research Program of NIDDK. Dr. Feld reports being a member of the advisory board for Roche Canada and Schering-Plough Canada. None of the others authors has any financial interest or conflict of interest related to this research.
Abbreviations
- HCV
hepatitis C virus
- IMPDH
inositol monophosphate dehydrogenase
- RVR
rapid virological response
- EVR
early virological response
- SVR
sustained virological response
- IP10
interferon-gamma inducible protein 10
- IFNg
interferon gamma
- IL4
interleukin 4
- IL5
interleukin 5
- IL8
interleukin 8
- MCP1
monocyte chemoattractant protein 1
- MIG
monokine induced by interferon gamma
- PCR
polymerase chain reaction
Footnotes
Publisher's Disclaimer: This is a PDF file of an unedited manuscript that has been accepted for publication. As a service to our customers we are providing this early version of the manuscript. The manuscript will undergo copyediting, typesetting, and review of the resulting proof before it is published in its final citable form. Please note that during the production process errors may be discovered which could affect the content, and all legal disclaimers that apply to the journal pertain.
References
- 1.Hezode C, Forestier N, Dusheiko G, Ferenci P, Pol S, Goeser T, Bronowicki JP, Bourliere M, Gharakhanian S, Bengtsson L, McNair L, George S, Kieffer T, Kwong A, Kauffman RS, Alam J, Pawlotsky JM, Zeuzem S. Telaprevir and peginterferon with or without ribavirin for chronic HCV infection. N Engl J Med. 2009;360:1839–50. doi: 10.1056/NEJMoa0807650. [DOI] [PubMed] [Google Scholar]
- 2.Davis GL, Esteban-Mur R, Rustgi V, Hoefs J, Gordon SC, Trepo C, Shiffman ML, Zeuzem S, Craxi A, Ling MH, Albrecht J. Interferon alfa-2b alone or in combination with ribavirin for the treatment of relapse of chronic hepatitis C. International Hepatitis Interventional Therapy Group. N Engl J Med. 1998;339:1493–9. doi: 10.1056/NEJM199811193392102. [DOI] [PubMed] [Google Scholar]
- 3.Poynard T, Marcellin P, Lee SS, Niederau C, Minuk GS, Ideo G, Bain V, Heathcote J, Zeuzem S, Trepo C, Albrecht J. Randomised trial of interferon alpha2b plus ribavirin for 48 weeks or for 24 weeks versus interferon alpha2b plus placebo for 48 weeks for treatment of chronic infection with hepatitis C virus. International Hepatitis Interventional Therapy Group (IHIT) Lancet. 1998;352:1426–32. doi: 10.1016/s0140-6736(98)07124-4. [DOI] [PubMed] [Google Scholar]
- 4.McHutchison JG, Gordon SC, Schiff ER, Shiffman ML, Lee WM, Rustgi VK, Goodman ZD, Ling MH, Cort S, Albrecht JK. Interferon alfa-2b alone or in combination with ribavirin as initial treatment for chronic hepatitis C. Hepatitis Interventional Therapy Group. N Engl J Med. 1998;339:1485–92. doi: 10.1056/NEJM199811193392101. [DOI] [PubMed] [Google Scholar]
- 5.Zhou S, Liu R, Baroudy BM, Malcolm BA, Reyes GR. The effect of ribavirin and IMPDH inhibitors on hepatitis C virus subgenomic replicon RNA. Virology. 2003;310:333–42. doi: 10.1016/s0042-6822(03)00152-1. [DOI] [PubMed] [Google Scholar]
- 6.Maag D, Castro C, Hong Z, Cameron CE. Hepatitis C virus RNA-dependent RNA polymerase (NS5B) as a mediator of the antiviral activity of ribavirin. J Biol Chem. 2001;276:46094–8. doi: 10.1074/jbc.C100349200. [DOI] [PubMed] [Google Scholar]
- 7.Tam RC, Pai B, Bard J, Lim C, Averett DR, Phan UT, Milovanovic T. Ribavirin polarizes human T cell responses towards a Type 1 cytokine profile. J Hepatol. 1999;30:376–82. doi: 10.1016/s0168-8278(99)80093-2. [DOI] [PubMed] [Google Scholar]
- 8.Contreras AM, Hiasa Y, He W, Terella A, Schmidt EV, Chung RT. Viral RNA mutations are region specific and increased by ribavirin in a full-length hepatitis C virus replication system. J Virol. 2002;76:8505–17. doi: 10.1128/JVI.76.17.8505-8517.2002. [DOI] [PMC free article] [PubMed] [Google Scholar]
- 9.Lutchman G, Danehower S, Song BC, Liang TJ, Hoofnagle JH, Thomson M, Ghany MG. Mutation rate of the hepatitis C virus NS5B in patients undergoing treatment with ribavirin monotherapy. Gastroenterology. 2007;132:1757–66. doi: 10.1053/j.gastro.2007.03.035. [DOI] [PubMed] [Google Scholar]
- 10.Zhang Y, Jamaluddin M, Wang S, Tian B, Garofalo RP, Casola A, Brasier AR. Ribavirin treatment up-regulates antiviral gene expression via the interferon-stimulated response element in respiratory syncytial virus-infected epithelial cells. J Virol. 2003;77:5933–47. doi: 10.1128/JVI.77.10.5933-5947.2003. [DOI] [PMC free article] [PubMed] [Google Scholar]
- 11.Liu WL, Su WC, Cheng CW, Hwang LH, Wang CC, Chen HL, Chen DS, Lai MY. Ribavirin up-regulates the activity of double-stranded RNA-activated protein kinase and enhances the action of interferon-alpha against hepatitis C virus. J Infect Dis. 2007;196:425–34. doi: 10.1086/518894. [DOI] [PubMed] [Google Scholar]
- 12.Feld JJ, Nanda S, Huang Y, Chen W, Cam M, Pusek SN, Schweigler LM, Theodore D, Zacks SL, Liang TJ, Fried MW. Hepatic gene expression during treatment with peginterferon and ribavirin: Identifying molecular pathways for treatment response. Hepatology. 2007;46:1548–63. doi: 10.1002/hep.21853. [DOI] [PMC free article] [PubMed] [Google Scholar]
- 13.Feld JJ, Hoofnagle JH. Mechanism of action of interferon and ribavirin in treatment of hepatitis C. Nature. 2005;436:967–72. doi: 10.1038/nature04082. [DOI] [PubMed] [Google Scholar]
- 14.Neumann AU, Lam NP, Dahari H, Gretch DR, Wiley TE, Layden TJ, Perelson AS. Hepatitis C viral dynamics in vivo and the antiviral efficacy of interferon-alpha therapy. Science. 1998;282:103–7. doi: 10.1126/science.282.5386.103. [DOI] [PubMed] [Google Scholar]
- 15.Pawlotsky JM, Dahari H, Neumann AU, Hezode C, Germanidis G, Lonjon I, Castera L, Dhumeaux D. Antiviral action of ribavirin in chronic hepatitis C. Gastroenterology. 2004;126:703–14. doi: 10.1053/j.gastro.2003.12.002. [DOI] [PubMed] [Google Scholar]
- 16.Dixit NM, Layden-Almer JE, Layden TJ, Perelson AS. Modelling how ribavirin improves interferon response rates in hepatitis C virus infection. Nature. 2004;432:922–4. doi: 10.1038/nature03153. [DOI] [PubMed] [Google Scholar]
- 17.Herrmann E, Lee JH, Marinos G, Modi M, Zeuzem S. Effect of ribavirin on hepatitis C viral kinetics in patients treated with pegylated interferon. Hepatology. 2003;37:1351–8. doi: 10.1053/jhep.2003.50218. [DOI] [PubMed] [Google Scholar]
- 18.Dahari H, Ribeiro RM, Perelson AS. Triphasic decline of hepatitis C virus RNA during antiviral therapy. Hepatology. 2007;46:16–21. doi: 10.1002/hep.21657. [DOI] [PubMed] [Google Scholar]
- 19.Jessner W, Gschwantler M, Steindl-Munda P, Hofer H, Watkins-Riedel T, Wrba F, Mueller C, Gangl A, Ferenci P. Primary interferon resistance and treatment response in chronic hepatitis C infection: a pilot study. Lancet. 2001;358:1241–2. doi: 10.1016/S0140-6736(01)06356-5. [DOI] [PubMed] [Google Scholar]
- 20.Tsubota A, Arase Y, Someya T, Suzuki Y, Suzuki F, Saitoh S, Ikeda K, Akuta N, Hosaka T, Kobayashi M, Kumada H. Early viral kinetics and treatment outcome in combination of high-dose interferon induction vs. pegylated interferon plus ribavirin for naive patients infected with hepatitis C virus of genotype 1b and high viral load. J Med Virol. 2005;75:27–34. doi: 10.1002/jmv.20232. [DOI] [PubMed] [Google Scholar]
- 21.Durante-Mangoni E, Zampino R, Portella G, Adinolfi LE, Utili R, Ruggiero G. Correlates and prognostic value of the first-phase hepatitis C virus RNA kinetics during treatment. Clin Infect Dis. 2009;49:498–506. doi: 10.1086/600887. [DOI] [PubMed] [Google Scholar]
- 22.Lindh M, Alestig E, Arnholm B, Eilard A, Hellstrand K, Lagging M, Wahlberg T, Wejstal R, Westin J, Norkrans G. Response prediction and treatment tailoring for chronic hepatitis C virus genotype 1 infection. J Clin Microbiol. 2007;45:2439–45. doi: 10.1128/JCM.00577-07. [DOI] [PMC free article] [PubMed] [Google Scholar]
- 23.Yurkovetsky ZR, Kirkwood JM, Edington HD, Marrangoni AM, Velikokhatnaya L, Winans MT, Gorelik E, Lokshin AE. Multiplex analysis of serum cytokines in melanoma patients treated with interferon-alpha2b. Clin Cancer Res. 2007;13:2422–8. doi: 10.1158/1078-0432.CCR-06-1805. [DOI] [PubMed] [Google Scholar]
- 24.Padovan E, Spagnoli GC, Ferrantini M, Heberer M. IFN-alpha2a induces IP-10/CXCL10 and MIG/CXCL9 production in monocyte-derived dendritic cells and enhances their capacity to attract and stimulate CD8+ effector T cells. J Leukoc Biol. 2002;71:669–76. [PubMed] [Google Scholar]
- 25.Rahman F, Heller T, Sobao Y, Mizukoshi E, Nascimbeni M, Alter H, Herrine S, Hoofnagle J, Liang TJ, Rehermann B. Effects of antiviral therapy on the cellular immune response in acute hepatitis C. Hepatology. 2004;40:87–97. doi: 10.1002/hep.20253. [DOI] [PubMed] [Google Scholar]
- 26.Taylor MW, Tsukahara T, Brodsky L, Schaley J, Sanda C, Stephens MJ, McClintick JN, Edenberg HJ, Li L, Tavis JE, Howell C, Belle SH. Changes in gene expression during pegylated interferon and ribavirin therapy of chronic hepatitis C virus distinguish responders from nonresponders to antiviral therapy. J Virol. 2007;81:3391–401. doi: 10.1128/JVI.02640-06. [DOI] [PMC free article] [PubMed] [Google Scholar]
- 27.Diago M, Castellano G, Garcia-Samaniego J, Perez C, Fernandez I, Romero M, Iacono OL, Garcia-Monzon C. Association of pretreatment serum interferon gamma inducible protein 10 levels with sustained virological response to peginterferon plus ribavirin therapy in genotype 1 infected patients with chronic hepatitis C. Gut. 2006;55:374–9. doi: 10.1136/gut.2005.074062. [DOI] [PMC free article] [PubMed] [Google Scholar]
- 28.Romero AI, Lagging M, Westin J, Dhillon AP, Dustin LB, Pawlotsky JM, Neumann AU, Ferrari C, Missale G, Haagmans BL, Schalm SW, Zeuzem S, Negro F, Verheij-Hart E, Hellstrand K. Interferon (IFN)-gamma-inducible protein-10: association with histological results, viral kinetics, and outcome during treatment with pegylated IFN-alpha 2a and ribavirin for chronic hepatitis C virus infection. J Infect Dis. 2006;194:895–903. doi: 10.1086/507307. [DOI] [PubMed] [Google Scholar]
- 29.Sarasin-Filipowicz M, Oakeley EJ, Duong FH, Christen V, Terracciano L, Filipowicz W, Heim MH. Interferon signaling and treatment outcome in chronic hepatitis C. Proc Natl Acad Sci U S A. 2008;105:7034–9. doi: 10.1073/pnas.0707882105. [DOI] [PMC free article] [PubMed] [Google Scholar]
Associated Data
This section collects any data citations, data availability statements, or supplementary materials included in this article.