

Abstract
Conformational flexibility in nucleic acids provides a basis for complex structures, binding, and signaling. One-base bulges directly neighboring single-base mismatches in nucleic acids can be present in a minimum of two distinct conformations, complicating the examination of the thermodynamics by calorimetry or UV-monitored melting techniques. To provide additional information about such structures, we demonstrate how electron paramagnetic resonance (EPR) active spin-labeled base analogues, base-specifically incorporated into the DNA, are monitors of the superposition of different bulge-mismatch conformations. EPR spectra provide information about the dynamic environments of the probe. This information is cast in terms of “dynamic signatures” that have an underlying basis in structural variations. By examining the changes in the equilibrium of the different states across a range of temperatures, the enthalpy and entropy of the interconversion among possible conformations can be determined. The DNA constructs with a single bulge neighboring a single-base mismatch (“bulge-mismatches”) may be approximately modeled as an equilibrium between two possible conformations. This structural information provides insight into the local composition of the bulge-mismatch sequences. Experiments on the bulge-mismatches show that basepairing across the helix can be understood in terms of purine and pyrimidine interactions, rather than specific bases. Measurements of the enthalpy and entropy of formation for the bulge-mismatches by differential scanning calorimetry and UV-monitored melting confirm that the formation of bulge-mismatches is in fact more complicated than a simple two-state process, consistent with the base-specific spectral data that bulge-mismatches exist in multiple conformations in the pre-melting temperature region. We find that the calculations with the nearest-neighbor (NN) model for the two likely conformations do not correlate well with the populations of structures and thermodynamic parameters inferred from the base-specific EPR dynamics probe. We report that the base-specific spin probes are able to identify a bi-stable, temperature dependent, switching between conformations for a particular complex bulged construct.
Keywords: Site-specific spin labeling (SDSL), extrahelical, differential scanning calorimetry (DSC), spin-lattice relaxation, thermodynamics, nearest-neighbor model
INTRODUCTION
DNA sequence dependent structure is extremely polymorphic. Depending upon the particular sequences comprising two strands, there are a number of alternate possible minor structures that can co-exist due to favorable sequence dependent interactions. Such minor duplex structures might contain mismatch base pairs, bulged base pairs, or other non-Watson-Crick interactions within the duplexes. Consequently, depending on their sequences, a population of duplex complexes can occupy multiple conformations that may be separated by relatively small energy barriers and therefore may interconvert resulting in a steady-state of multiple duplex conformations. Such manifold minor duplex structures, with small energy barriers between them, have been suggested for over twenty years,1-6 although their characterization has been elusive. EPR spectroscopy provides an ideal tool with which to probe existence and interconversion of multiple interdependent conformers in the pre-melting region, in regions where bulged and mismatched bases are found.
Extrahelical (bulged) bases can be vital to the structure and function of RNA and DNA systems, or sources of potentially harmful frame-shift or deletion mutations. Only 1.2% of human DNA codes for proteins, leaving a vast amount of DNA, much of which is non-duplexed.7 One non-duplex, non-coding sequence neighbors the human seudoautosomal telomere, and is composed of a loop made of neighboring mismatched bases.8 This looped type of non-duplex structure has been postulated to serve as a molecular switch, and is but one example of how non-coding DNA influences biological function.9
Bulges are often intermediates for errors in DNA replication, targets for repair enzymes in imperfect homologous recombination,10 and are believed to play a significant role in many diseases, including muscular dystrophy and Alzheimer’s.11,12 In fact, single-nucleotide polymorphisms (SNPs), which include some forms of single-base bulges, are thought to account for ~90% of mutations in an individual’s DNA.13 There is much interest in developing high-throughput SNP detection methods, in order to map diseases and disease susceptibility to a set of SNPs. New techniques to probe for SNPs are being developed, which requires an understanding of the structure and dynamics of SNP sites.14-18 Sequence-dependent effects have a profound impact on the insertion or deletion of bases during DNA replication, and could determine the type and severity of an SNP.19 It has been shown that the frequency of one-base deletion mutations are affected by the identity of the base as well as of its neighboring bases.20
A number of studies have indicated that bulge structure and dynamics are size-, sequence-, position-, and temperature-dependent.21-28 For example, solution NMR studies have shown that for thymidine or cytidine bulges, the position of the bulge relative to the helix depends on both temperature and flanking sequence.21,22 To understand the energetics underlying the structure and sequence-dependent structure of duplex DNAs, UV-monitored melting is often employed. While experimentally straightforward, a shortcoming of this technique is that results are ordinarily analyzed assuming DNA hybridizes in a two-state manner. For many DNA sequences it is unlikely that melting is simply a transition between two well-defined structures. Even so, the two-state assumption is often employed in the analysis of DNA melting curves collected by UV absorbance and the evaluation of thermodynamic parameters. The two-state model is particularly inadequate for DNA systems with conformational flexibility that can exist in multiple distinct structures prior to melting. In contrast to UV melting, differential scanning calorimetry (DSC) is commonly used to determine the enthalpy and entropy of formation of a nucleic acid in a model-independent manner. By combining the DSC and UV melting results, it can be determined whether the DNA actually melts in a two-state manner.29
The most widely used method to predict the thermodynamics of the melting transition for a given DNA sequence is the nearest-neighbor (NN) model. First developed by Crothers and Zimm, and Tinoco and coworkers,30,31 the NN model assumes that the thermodynamics of a duplex with known sequence can be calculated as the sum of individual NN doublets comprising the specific sequence. In the NN model, sequence dependence or other types of interactions are implicitly assumed not to extend beyond two base pairs. SantaLucia evaluated and reported a “unified” set of NN parameters for perfectly matched duplexes.32 Since being reported, these unified parameters have been ubiquitously applied to the design of DNA probes and primers. NN parameters are also available for all possible single-base pair mismatches, and single base overhangs. In contrast, comparatively few groups have studied in any systematic way the consequences on thermodynamic properties of duplex DNAs containing a single base bulge flanked by a mismatch base pair. Due to lack of availability of quantitative parameters, current applications of the NN model either ignore the bulge or assume it to behave as a broken base pair.
Each of the DNA constructs in this study is composed of a short oligomer containing a single spin-labeled base. The same spin-labeled oligomer is then hybridized with various non-labeled complementary oligomers, each one base shorter than the spin-labeled oligomer. The resulting structure is, at minimum, composed of two conformations capable of interconversion. These “bulge-mismatch” constructs are compared to two reference spectra: the EPR spectra of the spin-labeled bases within fully duplexed DNAs are the reference spectra reflecting minimum base motion, and the EPR spectra of DNAs containing a spin-labeled base with no available partner are the reference spectra reflecting maximum base motion. The EPR spectra contain information of the dynamics of the spin probe, which, in turn, is information about the local structure of the DNA around the spin probe. The spin label within the constructs reflects either rapid or slow motion depending on whether the environment allows the probe to move with respect to the DNA or whether the environment hinders that motion. In this way, the multiplicity of spin probe environments reflects the equilibrium among possible structures. The EPR-based information is complementary to standard thermodynamic data because it indicates which possible structures are present within a single thermodynamic state. Additionally, we report that DSC studies on the same constructs support the notion that multiple structures are present at all temperatures.
MATERIALS AND METHODS
DNA Samples
DNA oligomers were constructed through solid-state synthesis, as described elsewhere.33-35 For all experiments, samples were prepared in a solvent of 10 mM sodium phosphate, 100 mM sodium chloride, and 0.1 mM EDTA at pH 7.0 buffer (PNE buffer).
Samples for EPR Studies
In this study, spin labels Ç and Q were employed. The structures are shown in Figure 1 where Ç is an analog of cytidine and forms a Watson-Crick-like base pair with G, and Q forms a base pair with 2-amino purine (2AP). Spin labels were incorporated into the duplex constructs called GÇ/G, GÇ/T, GQ/P, QA/P, GÇ/A, ÇA/C, and GÇA/AC displayed in Figure 2. Control duplexes containing spin labels, and referred to as constructs I-VI, are shown in Figure 3. To make the duplexes shown in Figures 2 and 3, the spin-labeled sequences were combined in a 1:1.2-1.5 ratio with the appropriate unlabeled complementary strand and hybridized stepwise on a thermocycler according to the following scheme: 90 °C, 2 min; 60 °C, 5 min; 50 °C, 5 min; 40 °C, 5 min; 22 °C, 15 min; store at 4 °C. Sequence design was such that the bulge constructs contained one less nucleotide on the unlabeled strand than the spin-labeled strand, to create a one-base bulge on the spin-labeled strand of the hybridized duplex. Sample labels indicate the bases on the longer strand, 5′ to 3′, followed by the base(s) on the shorter strand. For the EPR experiments, the final concentration of the spin-labeled DNA was between 80 and 150 μM.
Figure 1.
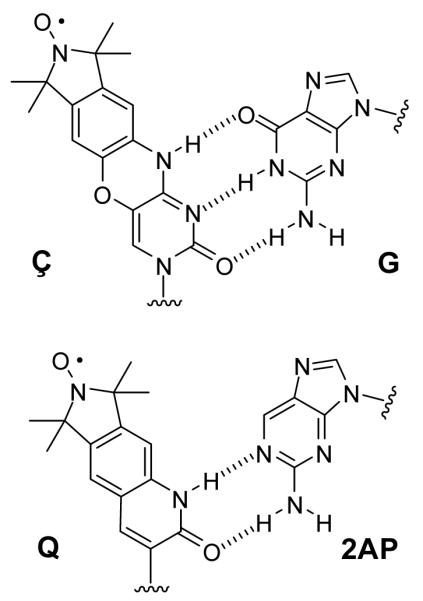
Structure of spin labels. Top: Ç shown paired to G. Bottom: Q shown paired to 2-aminopurine (2AP).
Figure 2.

Samples for the bulge/single-mismatch equilibria experiments studied in this work. Each is shown in its two likely conformations, as an equilibrium between spin label SLOW (the first conformation shown in each equilibrium) and FAST (the second conformation). The red font is used at the position of the spin probe, which for GÇ/G, GÇ/T, GÇ/A and ÇA/C is Ç and GQ/P and QA/P is Q. Vertical black lines represent Watson-Crick basepairs, and black dots represent non-Watson-Crick pairings. P represents 2-aminopurine, the basepairing partner for the spin label used in samples GQ/P and QA/P. The doubly-mismatched, bulged sample is GÇA/AC. The spin probe Ç is indicated in red font, black lines represent Watson-Crick basepairs, and black dots represent non-Watson-Crick pairings. The two conformations for the double-mismatch sample are indicated by GÇ/A and ÇA/C, which represent the two likely possible equilibria of the same sample.
Figure 3.

Control SLOW (left) and FAST (right) samples for the bulge/single-mismatch equilibria experiments. Each of the SLOW controls has the spin label locked into the duplex structure, and each of the FAST controls has Watson-Crick basepairs on each side of the spin label, with no partner provided for the spin probe itself. The spin probe is indicated in each construct by red font, and P represents Q’s basepairing partner, 2-aminopurine. The top sample of each column (I and IV) is the control for GÇ/G and GÇ/T, the constructs II and V are the SLOW and FAST controls for GQ/P, and III and VI are controls for QA/P. UV monitored TMs are given in Table 1.
Samples for DSC and UV Melting
DNA concentrations were 3.6 μM for UV melting experiments performed on the complexes shown in Figures 2 and 3. DNA samples for DSC melting experiments were analogous to those used for EPR studies and UV melting, except a natural cytidine replaced the spin probe analog, Ç, because of the large sample volumes for DSC measurements. For DSC melting experiments duplex DNA concentrations were 75-130 μM.33
UV-Monitored Melting Experiments
Absorbance at 268 nm versus temperature measurements (UV melting curves), were collected using a Cary 100 UV-vis spectrophotometer (Varian Instruments, Walnut Creek, CA). Sample temperature was increased from 10 to 80 °C at a rate of 0.5 °C/min. Data points were collected every 0.5 °C.
Differential Scanning Calorimetry Measurements
DSC melting curves were collected as measurements of the excess heat capacity, ΔCp, versus temperature, using one of four Nano-DSC™ differential scanning calorimeters (Calorimetry Sciences Corp - CSC). Data was analyzed using the Cpcalc™ (CSC) routine and produced the melting enthalpy (ΔHf°) and entropy (ΔSf°). Free energy (ΔGf°) was calculated using the formula ΔGf° = ΔHf° — TΔSf°. For all melting experiments, DNA concentrations ranged from 75–130 mM.
EPR Experiments and Data Analysis
CW-EPR Experiments
Using a commercial X-band (~9.4 GHz) Bruker EMX EPR spectrometer, spectra were collected from 0 to 40 °C at 5 °C intervals, accurate to +/- 0.2 °C, such that the highest temperature data point for each sample is still at least 5 °C below the UV-monitored melting temperature for that construct. For each sample, 50-100 scans were taken and averaged to obtain the final spectrum. A modulation frequency of 100 kHz at modulation amplitude 1.0 G was used, at 2.0 mW microwave power (non-saturating conditions).
Saturation Recovery EPR Experiments
Pulsed saturation recovery (pSR) spectra were acquired at X-band (~9.2 GHz) on a homebuilt EPR spectrometer with both CW and saturation recovery EPR measurement capability.36 A CW spectrum is obtained with resolution of 1024 points over a range of 90 G during one scan at a constantly applied -12 dbm microwave power, with 1 G modulation amplitude and a modulation frequency of 10 kHz. The highest spin density point for an 14N-nitroxide-labeled DNA sample is the center of the spectrum; this position was chosen as the field position at which the pump pulse was applied for the pSR experiment. To collect data by pSR, a 200 ns pump pulse was applied with +20 dbm of microwave power, followed by a 90 ns dead time. The response was observed with an offset of 100 kHz at -12 dbm of microwave power. The typical time resolution for a pSR spectrum in this study was 20 ns per point, for 4096 points and averaged over 4.8×10⁶ scans (80 % of the scans on resonance and 20 % ~100 Gauss off resonance for background subtraction). For each relaxation rate reported, the experiment was repeated at minimum 6 times and the results averaged. All samples were in a gas-permeable, but not water-permeable, 0.8 mm inner diameter Teflon capillary tube under a continuous stream of N2 gas at ~21 °C.
Dynamic Signatures from EPR Spectra
There are several ways of measuring EPR spectral features reported by a spin probe and obtaining a “dynamic signature”. One method is to measure the full peak-to-trough width (referred to as in EPR literature) of the CW-EPR spectra.37 A second method is to measure the line width of the central peak in the CW-EPR.38 The third method is to directly measure the spin-lattice relaxation rate.36,39 As briefly described below, for each of these signatures, the more exposed the labeled base is to the solvent environment, the less constrained it is by the adjoining duplex structure and therefore the faster the characteristic motional time.
1. Spectral Width,
The peak-to-trough spectral width is measured as the difference between the maximum of the low-field peak and the minimum of the high-field peak. Standard routines within Matlab are used to search for the local maximum and minimum. Measurements are routinely repeated on at least two independently prepared samples.
2. Center Manifold Linewidth
The observed width of the center field line is obtained using Matlab to search for the maximum and minimum of the CW-EPR spectra. The linewidth is the difference in field positions of the minimum and maximum of the CW-EPR spectra. The extreema of the center field line are that of the full EPR spectra. The measurement was repeated on at least two independently prepared samples.
3. Spin-lattice Relaxation Rate
A set of 6-10 pSR-EPR measurements was fit globally to a single exponential, giving a single relaxation rate. A comparison was performed using two relaxation rates to demonstrate that the spectra were fit better by a single exponential decay curve.
Fitting of EPR Spectra to a Sum of Two Components
For the bulged DNA duplexes of this study, EPR spectra were modeled as the sum of two reference spectra, using a least-squares fitting routine (Marquardt-Levenberg minimization algorithm) in Matlab. At each temperature, control spectra were measured at the same temperature as the sample spectra, and the sample spectra fit as a superposition of two control spectra. All spectra were normalized, and the points of maximum intensity on the center field line in each of the spectra (where y = 0 in the derivative spectra) were aligned. This ensured any variation in frequency of the instrument did not affect the results of the fitting procedure. Previous work has shown this method was in good agreement with standard methods of determining fractions of two components in a mixture.40
To determine errors in fitting of EPR spectra, several metrics were evaluated. Spectra for each bulge-mismatch construct were obtained at least twice on multiple samples. Spectra were digitized to 4096 points by the EPR instrument, and then filtered to 256 points to facilitate computation. Even further reducing the number of points to 128 did not affect the results. Each EPR spectrum was fit to sets of SLOW and FAST control spectra. Reducing the number of points slightly increased the errors in the Marquardt-Levenberg fitting (because the total error was averaged over fewer points).
Simulation of EPR Spectra
Simulations of EPR spectra were performed according to the methods of Freed and coworkers.41 The simulation was performed using the following tensors, derived from a fit to a rigid-limit spectra of a 14-mer DNA in 50% (w/v) sucrose/PNE solution at 0 °C (determined in a previous study): gxx = 2.0086, gyy = 2.0064, gzz = 2.0026, Axx = 5.81 G, Ayy = 5.75 G, and Azz = 36.75 G.42 The homogeneous linewidths were chosen to be 0.7 G, 0.85 G, and 1.3 G (from low field to high field), and the inhomogeneous broadening function had a width of 0.58 G.42 The tilt of the Euler angle β was set equal to 20°.42 The diffusion tensor values were calculated for a rigid cylinder of the dimensions of a 14-mer DNA at differing temperatures, based on the well-established methods of Tirado and de la Torre.42,43
Theoretical Methods and Data Analysis
Interconversion Between SLOW and FAST Conformations: Enthalpies and Entropies from EPR Experimental Data
The bulge-mismatch constructs were modeled assuming a two-state equilibrium between two distinct conformations of each bulge-mismatch. These states are: a duplex DNA with a spin label in the bulged position (out, FAST dynamics), and a duplex with the spin label firmly locked into the duplex structure (in, SLOW conformational dynamics).44 EPR spectra were analyzed to determine the dynamic equilibrium between the FAST and SLOW states. The middle spectrum of Figure 4 shows an example fit of a bulge-mismatch sample to spectra from the SLOW and FAST controls. The chemical reaction is two-state: SLOW⇄FAST. The control spectra from sample I (blue in Figure 4), S (x) , and IV (green), F (x), were added to produce a least-squares fitted line (black dashed), shown superimposed on top of the target sample (red) spectrum. All spectra, E (x), were normalized to unity with the double integral:
| (1.1) |
Figure 4.

EPR spectrum of GÇ/T (red line), compared with the SLOW control (blue) and FAST control (green). The summed superposition of the SLOW and FAST controls is shown (dashed black line), where GÇ/T at 35 °C is fit by a sum of 38.2% control FAST at 35 °C and 61.8% SLOW at 35 °C.
The expression for the equilibrium between SLOW and FAST conformations is given by,
| (1.2) |
To evaluate the thermodynamics of the SLOW to FAST interconversion reaction, the natural logarithm of the equilibrium constant, Keq, obtained from the ratio in Equation (1.2), was plotted according to the van’t Hoff relation:
| (1.3) |
The slope was and the intercept , and Keq is the ratio obtained from Equation (1.2). Results of the linear fits provided evaluations of ΔHD and ΔSD, determined by the dynamics associated with the spin probe being bulged out or locked into the helical structure. The values ΔHD and ΔSD were compared to analogous quantities, ΔHNN and ΔSNN, estimated from the NN model.
Interconversion Between Conformations: Calculation of Enthalpies and Entropies from the Unified Nearest-Neighbor (NN) Model
Based on the assumption that the dynamics can be approximately described in terms of a SLOW and FAST structure (used to obtain Keq and ΔHD above), the NN method can be applied to approximate ΔΔHNN and ΔΔSNN. Calculations were based on the published NN parameters.32 For example, the calculation to determine the NN enthalpy is demonstrated. The same process is used to determine the entropy. The difference in enthalpy between the FAST and SLOW components is given by,
| (1.4) |
For example, consider the two equilibrium states of GÇ/T, shown in Figure 2. The difference can be calculated in two ways, depending on how the mismatched and bulged bases are treated.
1. Assume the enthalpy of a bulge-mismatch construct is not affected by the presence of the bulge. This approximation allows determination of the interconversion enthalpy from the difference in energies of the different basepairs flanking the bulge in the two conformational states. After identical terms that appear in ΔHf for both SLOW and FAST conformations cancel, the result for ΔΔHNN of interconversion is,
| (1.5) |
CG/GT represents the NN doublet (), comprised of a C:G Watson-Crick basepair flanked by a G:T mismatch. This analysis omits contributions from the bulged Ç in the FAST conformation and the bulged G in the SLOW conformation.
2. Assume the contribution from the basepair adjoining the bulge can be ignored, which implicitly assumes that stacking interactions “across” the bulged site do not contribute significantly to the interconversion reaction. The result is:
| (1.6) |
There are literature values for ΔHNN and ΔSNN in 1 M Na+. For fully duplex oligomers under 16 basepairs long, the following conversion has been employed to determine ΔSNN at a lower [Na+].45
| (1.7) |
Where Nphos is the number of phosphate groups in the oligomer, Nphos = Nlength*2-2 in basepairs, and Nlength is the length of the oligomer in basepairs. This correction of ΔSNN has not been tested for bulge-containing duplexes, although we used (1.7) in our calculations of ΔSNN. It is reported that ΔHf for DNA duplexes is independent of Na+ concentration, thus it is assumed that ΔΔHNN for the bulge-mismatch samples is not affected by [Na+].45
In the NN calculations, the Q spin probe was treated as thymidine, the 2-aminopurine as an adenosine, and the Ç spin probe as cytidine. Earlier work established that these spin probes are thermodynamically analogous to the natural bases.33,34,44,46 It should be noted that the NN model is based on thermodynamic parameters obtained from analysis of melting curves of duplex DNAs, even though it has been applied to estimate thermodynamic parameters below the melting region.
UV-Monitored Melting: Enthalpies and Entropies of Formation from Experimental Data
To estimate melting thermodynamic parameters from UV melting curves, the low and high temperature linear sections were extrapolated across the temperature range, as depicted in Figure S1 in Supporting Information. Procedures developed by Breslauer and coworkers were utilized to evaluate thermodynamic parameters from DNA melting curves.29 In the non-linear region, each temperature-absorbance point is defined as the fraction of strands in the duplex state , where the index (Ti) refers to the temperature. Determination of X and Y is shown graphically in Figure S1. The basic annealing reaction is given by,
| (1.8) |
CT is equal to the total strand concentration. The equilibrium constant at each point i along the curve is given by,
| (1.9) |
Melting temperature, Tm, is defined as the temperature when α = 0.5 (half of the DNA is single-stranded). The equilibrium constant at the Tmis:
| (1.10) |
The standard form of the van’t Hoff equation is given as:
| (1.11) |
To calculate the free energy at each point of the transition,
| (1.12) |
The equilibrium constant (Ki = K(Ti)) is for the reaction of two distinct strands going to a duplex. It should correspond to the relative fraction of spin label that is solvent exposed (bulged out) versus locked into the duplex structure, at each temperature (Ti) through the melting (non-linear) region.
The entropy of the annealing reaction from single strands to duplex is calculated using (1.13):
| (1.13) |
DSC Melting: Enthalpies and Entropies of Formation from Experimental Data
DSC measures changes in excess heat capacity, ΔCp, versus temperature T when a DNA sample is heated or cooled. Thermodynamic parameters of the DNA melting transition, ΔHcal and ΔScal were evaluated from the normalized, base line corrected ΔCp versus Temperature curve.47,48 DSC data were collected at heating rates from 15 to 90 °C/hr. The average buffer base line determined from multiple (usually more than eight) scans of the buffer alone was subtracted from these curves. The resulting base line corrected curve was then normalized for total DNA concentration and the calorimetric transition enthalpy, ΔHcal, and entropy, ΔScal, are evaluated. Routinely, at least three forward and reverse ΔCp versus T scans were made per experiment. For short DNA melting curves it is generally assumed49 that ΔCp = ΔCp(Tinitial) — ΔCp(Tfinal) = 0, but this assumption has not been generally validated (mainly because it is difficult to measure). If there is no net excess ΔCp in the melting reaction then the thermodynamic transition parameters, evaluated from analysis of the transition (in the temperature region of the transition, i.e. at Tm), were assumed to be entirely independent of temperature. These evaluated parameters are then applied to calculate stabilities (equilibrium constants) of duplex complexes at temperatures below (20-40 °C) the transition region. In the few cases attempted to evaluate ΔCp ≠ 0 for DNA melting, the derived value has been found to be relatively small, but non-zero.49-52 Yet this is clearly an issue that has not been settled. It is particularly relevant for the interpretation of reactions that occur far below the transition region. As in this study, small differences in thermodynamic stability of different duplexes are introduced via sequence specific design.
The effect of a non-zero ΔCp on the evaluated thermodynamic parameters is as follows:
| (1.14) |
The values of ΔH°(T°) and ΔS°(T°) are the enthalpy and entropy values at the reference temperature T°, which can be designated as the melting transition temperature Tm. The parameters in the transition region ΔH°(T°) and ΔS°(T°) can be evaluated by DSC. In practice, DSC melting curves are acquired using Nano-II differential scanning calorimeters (Calorimetry Sciences Corp., Provo, Utah). If ΔH°(T°) = ΔHcal and ΔS°(T°) = ΔScal are evaluated by DSC, and ΔCp is known for a duplex, values of ΔH(T) and ΔS(T) for melting (or annealing) can be determined at any temperature, and will likely be more accurate.
RESULTS
We report data on bulge-mismatch constructs (Figure 2), utilizing two base-specific spin probes (Figure 1). Each bulge-mismatch was simulated as a sum of FAST and SLOW components (as illustrated in Figure 4) across a range of temperatures in the pre-melting region. The temperature-dependent results are used to determine a dynamics-based entropy and enthalpy of interconversion between conformations present in equilibrium within the pre-melting temperature region. We compare our results to those of various NN model predictions that are based on simple assumptions about the nature of the conformations contributing to the state of the DNA as a function of temperature, in the melting region. Moreover, the thermodynamics of the conformations involved in forming the DNA were examined by DSC and UV-monitored melting experiments.
EPR Reference Samples
The construct designed with a Ç paired to X (X = A, C, T, or G), is shown in the inset of Figure 5. The melting temperatures (Tm) of each complex measured by UV melting and EPR spectral widths measured as a function of temperature are shown in Figure 5. Spectral width is an established reporter of the level of spin label motion, where the narrowest peak-to-peak linewidth reflects the highest level of motion.37 As seen in Figure 5, the order of the Tm’s was Ç/G » Ç/A > Ç/T > Ç/C. Over the entire pre-melting region examined, the widest spectral widths are observed for sequences with a Ç/C or Ç/T, while the Ç/G and Ç/A sequences show more motion. Interestingly, the level of motion does not correlate with the order of Tm’s, revealing that reduced motion does not imply a more thermodynamically stable state. Based on spectral width measurements, the level of motion among the Ç/X samples is lowest for Ç/C, although Ç/G has a Tm that is ~16 °C higher than Ç/C. For comparison, the spectral widths of the simulated spectra are also plotted versus temperature in Figure 5. The simulations were done assuming only rigid body motion of a cylinder-like object; no internal motion was included in the calculation. Consequently, the simulated spectra have a larger spectral width than Ç/C, which in turn has a larger spectral width than that of a bulged Ç in the FAST control (spectra shown in Figure S2).
Figure 5.

Spectral widths as a function of temperature, labeled with the sample name and the sample melting temperature (Tm). Sequence of constructs shown as inset, where X = A, C, T, or G. Ç/A (blue right-pointing triangles), Ç/G (green diamonds), Ç/T (red circles), Ç/C (cyan left-pointing triangles), and simulated spectra of 14-mer with no internal motion (black plus marks). Margin of error is within the size of the markers used. Dotted lines added to aid the eye.
In Figure 6 (top), the spin-lattice relaxation rates (R1e) are reported for the Ç/X samples and the simulated 14-mer (solid blue line and plus marks) as shown in Figure 5, as well as the Ç-labeled bulge samples (structures shown in Figures 2 and 3-IV). The solid black line indicates the excellent linear correlation between spectral width and R1e for the Ç/X samples. The dashed black line indicates a different linear correlation between spectral width and R1e for the bulged samples. The R1e values, calculated on the basis of a rigid 14-mer,39,53 demonstrate that the experimental R1e values are about twice as large as the calculated values. The increased rate of experimental values arises from the internal motion of the spin probe over and above that of a rigid object.39 The R1e, like the spectral width , indicates Ç/C has the least mobility of the Ç/X samples. Figure 6 (bottom) indicates high correlation between the dynamics reported based on central field manifold measurement and full spectral width measurement.
Figure 6.

Top: Correlation of full spectral width at 20 °C of the Ç-labeled samples to the spin-lattice relaxation rate, R1e, at ~21 °C. Solid black line is a least-squares linear fit to the non-bulged sequence data, and dashed black line is a least-squares linear fit to Ç/A, GÇ/T, GÇ/G, FAST reference IV, and GÇ/A. Solid blue line with plus marks indicate the correlation of the calculated values from simulated spectra of 14-mer with no internal motion. Bottom: Correlation of center manifold peak-to-peak linewidth and spectral width, both measured at 20 °C. GÇ/A (solid blue right-pointing triangle), Ç/A (hollow blue right-pointing triangle), GÇ/G (solid green diamond), Ç/G (hollow green diamond), GÇ/T (solid red circle), Ç/T (hollow red circle), ÇA/C (solid cyan left-pointing triangle), Ç/C (hollow cyan left-pointing triangle), and FAST reference IV (solid black star). Solid black line is a least-squares linear fit to all data points except the FAST reference.
Because Ç/C (I in Figure 3) reported the lowest level of spin label motion, it was used as a reference sample for SLOW dynamics. Control sample IV in Figure 3 has a Ç spin probe present without any partner available for pairing, and has a higher Tm than any of the other bulge samples (and it is nearly equal to the Tm of GÇ/G), as can be seen in Table 1.
Table 1.
Results of UV-monitored measurements.
| Sample | ΔHf [kcal/mol] |
ΔSf [cal/mol] |
ΔGf, 20 [kcal/mol] |
Tm [°C] |
|---|---|---|---|---|
| FAST IV | -100.7 ± 1.4 | -289 ± 4 | -15.9 ± 1.6 | 46.8 ± 0.9 |
| GÇ/G | -94.7 ± 2.2 | -270 ± 4 | -15.6 ± 2.5 | 47.4 ± 0.6 |
| GÇ/T | -92.3 ± 1.4 | -267 ± 4 | -13.8 ± 1.6 | 41.2 ± 0.5 |
| GÇ/A | -88.8 ± 2.5 | -257 ± 5 | -13.1 ± 2.7 | 40.2 ± 0.6 |
| ÇA/C * | -60.3 ± 3.6 | -165 ± 13 | -11.9 ± 5.0 | 38.9 ± 0.3 |
| GÇA/AC | -60.4 ± 3.8 | -168 ± 10 | -12.6 ± 5.0 | 33.2 ± 0.3 |
| Ç/G | -116.3 ± 3.0 | -323 ± 11 | -21.6 ± 3.5 | 61.7 ± 0.6 |
| Ç/T | -87.2 ± 3.1 | -244 ± 10 | -15.7 ± 3.6 | 48.6 ± 0.3 |
| Ç/A | -89.7 ± 1.3 | -250 ± 4 | -16.4 ± 1.7 | 51.1 ± 0.5 |
| Ç/C, SLOW I * | -97.4 ± 2.7 | -278 ± 11 | -15.9 ± 3.2 | 46.0 ± 0.3 |
These samples have a broadened peak, although they can still be fit by the UV melting two-state model. The values are likely less accurate.
To show a comparison of experimental spectra from the reference constructs to spectra that are simulated with no internal motion, EPR spectra from the simulated 14-mer (first column) and the control samples I (second column), and IV (third column) at 0, 20, and 40 °C are shown in Figure S2 in Supporting Information. Sample I resembles the 14-mer rigid simulation more closely than does sample IV.
A Single Base Bulge Adjacent to a Single Base Mismatch
The EPR spectra for the bulge-mismatches at each temperature were fit to a superposition of the control spectra, and the percentage of FAST component was determined. These values are plotted versus temperature in Figure 7 (top). GÇ/T, ÇA/C and GQ/P all contain a larger percentage of the FAST spectra at higher temperature, GÇ/A is fairly constant across the temperature range studied, and GÇ/G and QA/P both have less FAST at higher temperature.
Figure 7.

Top: Results of fitting spectra to a sum of SLOW spectra and FAST spectra, as a function of temperature. Dotted lines are added to aid the eye. Bottom: Plot illustrating ln(Keq) versus 1/T [1/K], where Keq is calculated from spectral fitting, as shown in Equation (1.2) . GÇ/A (blue right-pointing triangles), GÇ/G (green diamonds), GÇ/T (red circles), ÇA/C (cyan left-pointing triangles), GQ/P (purple squares), and QA/P (orange triangles) sequences.
Using Equation (1.2) and results of fitting the EPR spectra to a superposition of the two controls, ln(Keq) at each temperature and for the different samples was determined, and plotted versus in Figure 7 (bottom). Points were fit to the van’t Hoff equation and values of ΔHD and ΔSD were derived, and are listed in Table 2. GÇ/A, GÇ/T, ÇA/C and GQ/P all have endothermic SLOW→FAST transitions, while GÇ/G and QA/P both have exothermic SLOW→FAST transitions. The ΔHD and ΔSD values in Table 2 were used to calculate ΔGD(T) of the interconversion at 20 °C given in Table 2.
Table 2.
Thermodynamic data for the interconversion SLOW→FAST, derived from the EPR data.
| Sample | ΔHD [kcal/mol] |
ΔSD [cal/mol] |
ΔG20 [kcal/mol] |
|---|---|---|---|
| GÇ/A | + 0.2 ± 1.0 | - 1.5 ± 3.5 | + 0.7 ± 1.2 |
| GÇ/G | - 3.8 ± 0.7 | - 15.0 ± 2.5 | + 0.6 ± 0.9 |
| GÇ/T | + 1.4 ± 1.3 | + 3.6 ± 4.4 | + 0.4 ± 1.5 |
| ÇA/C | + 14.2 ± 2.9 | + 45.7 ± 10 | + 0.8 ± 3.2 |
| GQ/P | + 2.4 ± 0.3 | + 4.0 ± 0.9 | + 1.2 ± 0.6 |
| QA/P | - 3.9 ± 1.2 | - 13.9 ± 4.1 | + 0.2 ± 1.4 |
The spectra from bulge-mismatch samples GÇ/A, GÇ/G, GÇ/T and ÇA/C (structures shown in Figure 2), were fit as a sum of the FAST reference IV and the corresponding spectra from the Ç/X samples. For example, GÇ/T was fit to a sum of FAST and Ç/T. Results are shown in Figure S3 in Supporting Information. Comparing the plots in Figures 7 (top) and S3, it is evident that the results obtained when using the closest-matching Ç/X as reference spectra are not qualitatively different than when Ç/C is used as the reference SLOW sample. Therefore, using the Ç/C construct as general reference sample, rather than use a construct specific for a particular sequence, does not compromise any of the conclusions.
A Single Base Bulge Adjacent to Two Mismatched Basepairs
To demonstrate the complex equilibria present in GÇA/AC, samples GÇ/A, ÇA/C, andGÇA/AC (shown in Figure 2) were fit to a spectral sum of SLOW and FAST control spectra. For sample GÇA/AC, any of the three center bases (G, Ç, or A) could form a one-base bulge, which leaves the neighboring bases to form two mismatched basepairs. Among the many possibilities for dominant structures, there are likely two competing equilibria in GÇA/AC: 1) The competition between the G and Ç for the A mismatch, and 2) the competition between the Ç and A for the C mismatch. The former is much like the GC/A construct and the latter is much like the CA/C construct, which have been analyzed by the same SLOW to FAST equilibrium.
Results of fitting GÇA/AC, GÇ/A, and ÇA/C to a sum of the spectra for the controls I and IV are shown in Figure 8. From 5-20 °C, the percentage of the FAST component in GÇA/AC correlates with that of GÇ/A. From 20-35 °C it switches to matching the data of ÇA/C. Because the EPR-based data for GÇA/AC was not monotonically linear, the van’t Hoff analysis could not be applied to derive a ΔHD and ΔSD for the conformational interconversion in these complex equilibria. Similarity between the fraction of the GÇA/AC sequence and the two single base bulges, in the two different temperature regimes, suggests the equilibrium is composed of multiple interconverting structures, which differ markedly with temperature.
Figure 8.

A comparison of a sample that has two possible bulge-mismatch equilibria, GÇA/AC, (magenta circles), with bulge-mismatch results on each of the two equilibria individually: ÇA/C (cyan left-pointing triangles) and GÇ/A (blue right-pointing triangles).
Melting Thermodynamics for Bulge-Mismatches
Thermodynamic parameters evaluated by UV and DSC melting curve analysis are summarized in Tables 1 and 3. The ΔHf and ΔSf from UV melting studies are all more negative than the DSC results, as are the resultant ΔGf values at 20 °C. As expected, the Tm values obtained by UV melting experiments are 10-21 °C lower than measured by DSC for every sample. This difference in Tm was most certainly due to the difference in concentrations for the two types of experiment.
Table 3.
Results of DSC measurements. SLOW represents the thermodynamic values for the SLOW control sample that is the top structure in Figure 3, and FAST is the FAST control sample for the top construct in Figure 4. Instead of a spin probe, a natural cytidine base is used at the site of the spin probe, as shown in the parenthesis.
| Sample | ΔHf [kcal/mol] |
ΔSf [cal/mol] |
ΔGf, 20 [kcal/mol] |
Tm [°C] |
|---|---|---|---|---|
| SLOW, I | -86.9 ± 1.1 | -249 ± 4 | -13.9 ± 0.1 | 77.1 ± 0.1 |
| FAST, IV | -83.8 ± 3.6 | -248 ± 11 | -11.1 ± 0.5 | 65.4 ± 0.1 |
| GÇ/G (GC/G) | -71.4 ± 0.7 | -213 ± 2 | -8.9 ± 0.2 | 61.6 ± 0.1 |
| GÇ/T (GC/T) | -69.2 ± 2.1 | -210 ± 6 | -7.6 ± 0.2 | 56.0 ± 0.2 |
| GÇ/A (GC/A) | -68.8 ± 1.6 | -208 ± 5 | -7.8 ± 0.2 | 57.9 ± 0.2 |
| ÇA/C (CA/C) | * | * | * | 46.7 ± 0.2 65.3 ± 0.2 |
|
GÇA/AC
(GCA/AC) |
-68.6 ± 2.8 | -209 ± 9 | -7.3 ± 0.2 | 54.4 ± 0.1 |
The enthalpy and entropy could not be obtained from the DSC curves for this sample, as there were two distinct peaks in the data, each of which had a unique Tm.
From calorimetry, the order of thermal stability (as determined by either the Tm’s or the enthalpies of melting, except for the problematic Ç/C) is: Ç/G > Ç/A > Ç/T > Ç/C. This order of thermodynamic stability may be compared with the order of dynamics: of these four constructs Ç/C show the slowest dynamics and Ç/G has the fastest dynamics. Therefore the orders do correlate; however, the orders are counter to the notion that the most thermodynamically stable entities will have the slowest motion. Below we discuss why the dynamics of structures in the pre-melt region need not correlate with thermal stability. For the bulge-mismatch samples, the order of enthalpic stability is GÇ/G > GÇ/T > GÇ/A > ÇA/C, based on UV melting and assuming a two-state model for all samples (Table 1). This set of constructs is compared because it represents a series in which Ç is opposite each of the four bases, as the Ç/X series. The order of thermodynamic stability of the bulge-mismatches is nearly the same as the corresponding oligomers in the Ç/X series. The data in Figure 7 (derived from the EPR spectra) show that in the pre-melt region, the nature of the structure is not explained by either the SLOW (Ç/X pairing) or the FAST construct alone. The UV melting curves for samples ÇA/C and Ç/C were broadened, and have a slight shoulder towards higher temperature that provides direct calorimetric evidence that makes the two-state model even more questionable.
The DSC data in Table 3 for GÇ/A and GÇA/AC (the bulge-double mismatch) are remarkably similar, although the UV melting data for these two samples did not show the same high level of similarity. In fact, the UV melting data showed nearly identical results for ÇA/C and GÇA/AC. A comparison of DSC results for GÇA/AC and ÇA/C cannot be made because the ÇA/C molecule displayed two distinct peaks in the DSC melting curve. Other DSC curves of 14-mer and 11-mer bulge-single mismatch constructs having a C/C interaction as one conformational possibility also showed two peaks (data not shown).
Comparison of EPR Experimental Data to NN Calculations
Results of the EPR-derived thermodynamics of interconversion from SLOW→FAST were compared for two different types of NN calculations in Figure S4 in Supporting Information. No clear correspondence was observed between EPR-derived thermodynamics and the analogous parameters from the NN calculations.
In order to observe whether the calorimetric data corresponded with NN calculation, the experimentally derived DSC and UV melting values for enthalpy and entropy of formation were compared directly to the NN-calculated thermodynamics of formation for either the FAST or SLOW state. Figure S5 in Supporting Information shows that this method of comparing calorimetric data to NN calculations for bulge-mismatches is an inadequate means of determining the conformations.
EPR Studies Comparing One-, Two-, and Three-Base Bulges
EPR spectra for one-, two-, and three-base bulge samples (inset of Figure 9) were fit to a spectral sum of the spectrum of I (Figure 3) and the single 14-mer spin-labeled strand used to make I, without any complementary strand. The fitting method was the same as used for the bulge-mismatches, except the single-strand served as the FAST control. Results of the spectral fitting are shown in Figure 9. From 0 to 30 °C, the one-base bulge displays the most single-strand character (highest level of motion). The two- and three-base bulges reported nearly identical results from 0 to 20 °C. Above 20 °C, the three-base bulge began to show more and more single-strand character, presumably because it has the fewest paired bases, more conformational freedom of the bulged region, and melts at a lower temperature (27.0 °C for the three-base bulge as compared to 35.8 °C for the two-base bulge) as determined by UV melting.
Figure 9.

Results of fitting one- (purple squares), two- (black diamonds), and three-base (black orange circles) (structures shown in inset) bulge spectra to a sum of single- and double-stranded character (SLOW control I). The single-stranded reference comes from spectra of the spin-labeled 14-mer used in SLOW control I with no complementary strand. Error margins for each data point are < 5 %. (TMs are 46.8 °C for the one-base bulge, 35.8 °C for the two-base bulge, and 27.0 °C for the three-base bulge.)
DISCUSSION
These studies have shown that a base-specific probe in conjunction with a spectroscopic technique can provide information not attainable by melting studies. EPR spectroscopy is a valuable technique for such studies, since it is sensitive to dynamics on the nanosecond to microsecond timescale. Thus, EPR is suitable for observing local motions in DNA, (as well as twisting and bending collective motions and overall tumbling motions for nucleic acids).42 EPR studies of nucleic acids require incorporation of unpaired electrons, such as nitroxide radicals. For detection of base or nucleotide specific dynamics, the nitroxide spin labels must be somewhat rigid, i.e. not have motion independent of the nucleotide to which they are attached.
The spin labels in this study have been base-specifically attached within the helical structure of the DNA constructs; and therefore, they provide information about the local structure and environment of the labeled base through the dynamics of the spin probe. The EPR spectra reflect less motion when the spin label is firmly locked within the duplex structure relative to when the spin label is bulged out or otherwise not held tightly. In this way, the dynamics signatures of the spin probe reflect the equilibrium among possible structures. The EPR-based information is complementary to standard thermodynamic data, because it indicates which possible structures are present under conditions of thermodynamic equilibrium. We present here the type of information that can be obtained from such probes, and provide a framework to understand the information and compare it with DSC results and calculations using the NN model. Our results indicate that in the pre-melting region, at a fixed pressure and temperature, the DNA is composed of several different structures.
Both UV and DSC melting data (Tables 1 and 3, Figure S5 in Supporting Information) indicate formation of bulge-mismatches is a non-two-state process. Origins of the differences of a van’t Hoff-derived (UV melting) ΔHf and the model-independent (DSC) ΔHf have been discussed by Breslauer and coworkers.29 Results presented here consistently showed the van’t Hoff-derived ΔHf was less than the calorimetric ΔHf, highly indicative of a non-two-state process of formation.29 This non-two-state formation has been observed by others, particularly in DNA duplexes with non-canonical Watson-Crick sites.54 The structural evaluations determined by site-specific EPR probes distinguish among possible structures that are present prior to melting. The data show that bulge-mismatch DNA in the pre-melting region is composed of at least two distinct conformations. Comparison of results from NN calculations with EPR data for the thermodynamics of structural interconversion is tenuous because the EPR results are determined directly from a base-specific probe, which reports on structure in the pre-melting region through a dynamics-dependent parameter, while the NN model is based on thermodynamic parameters from changes around the melting transition region.
There are two potential points worth consideration when applying the NN model to calculate stabilities of somewhat unusual duplexes, containing bulges and mismatches, at temperatures below the melting transition. First is the validity of the NN model for these types of structures. It is likely that the effects of single base bulges extend beyond the nearest neighbor base pairs. Second, throughout our analysis it has been assumed that the excess heat capacity difference between helical and coiled states is zero [ΔCp = 0] (i.e. that the enthalpy and entropy evaluated from DSC melting curves are temperature independent). If correct, then predicted thermodynamics at temperatures well below the transition temperature should be accurate. However, if ΔCp does not equal zero, then the enthalpy and entropy are temperature dependent. This would imply thermodynamic parameters evaluated from analysis of the melting transition region may not be accurate when extrapolated to temperatures in the pre-transition temperature region. The likelihood of polymorphic states occupied by the duplex and potential temperature dependence of the thermodynamic parameters cast suspicion on reliability of results and comparisons based on the NN model.
For the samples spin-labeled with Ç, the control SLOW duplex has a cytidine across from the Ç spin label. This Ç/C sample was chosen as the reference because this particular sample give spectra that contain the least amount of EPR-observable dynamics. Surprisingly, the Ç/C construct is the most rigid dynamically but had the lowest Tm. Reduced motion of Ç/C compared to the other Ç/X samples inversely correlates with the thermodynamic stability. The order of Tm’s (Figures 7 and 8 and Tables 1 and 3) demonstrates that thermal stability is opposite to dynamic stability.
The motion observed from the spin probe consists of two types: the uniform motion of the duplex DNA and the internal motions of the probe relative to the duplex. Figures 4 and 5 (top) and Figure S2 provide a comparison of the experimental data with simulations of what the results would look like if only the uniform modes of motion were present. The comparisons show that the SLOW spectra are indeed closer to the uniform mode-only spectra than are the bulge-mismatches (Figure 6 (top)), and even the SLOW motion spectra contain local dynamics in addition to the uniform modes of motion (Figure 5).
Figure 6 illustrates different possible ways to measure a dynamic signature from the spin probe attached to a single base. The three parameters are 1) the full spectral splitting, called , 2) the central linewidth, which is directly related to the mobility parameter of Hubbell,38 and 3) the spin lattice relaxation rate, R1e.39 Each parameter depends on the dynamics in different ways. However, all three track the dynamics qualitatively in the same way. The R1e measurement follows linearly, when the character of the dynamics is held constant (Figure 5). For example, R1e of the 4 Ç/X structures show a simple linear relation with , and the bulged structures show a different linear relation. This illustrates that R1e depends on the dynamics in a different way from the and when the characteristics of the motion change the relation changes. The comparison of the spin-lattice relaxation rate, R1e, with the CW EPR spectral width, (Figure 6 (top)), provides information on the origin of the dynamics. As a general principle, is determined in main part by dynamics processes that have rotational diffusion coefficients comparable to the width of the spectrum, which is on the order of 108Hz. In contrast, the R1e is dominated by dynamics process that compete with the spectrometer frequency, which is 9.109Hz (for X band spectrometers).39,53,55 Therefore, the results from the simulated spectra (Figure 6 (top), blue line) demonstrates that R1e for a sample with no internal motion does not depend strongly on the uniform mode of motion of the spin label, as the uniform mode for a ~14-mer is much slower than the spectrometer frequency. However, the strong correlation of R1e relative to for the Ç/X and bulge-mismatch samples (black and dashed black lines in Figure 6 (top)) indicates that R1e is sensitive to rapid motion, which is the motion of the base relative to the local helical structure. The dominant dynamics do not come from the collective modes: The collective modes are nearly independent of sequence; however, both experimental dynamics signatures are quite sensitive to sequence. Moreover, for such short lengths of DNA the amplitudes of such modes are very small. Experimentally, the rapid local dynamics are so fast that the rate of the motion does not affect , although the amplitude of the local motion likely does affect the width. The experimental data of the set of Ç/X samples (solid black line in Figure 6 (top)) as compared to the set of bulge-mismatches (dashed black line in Figure 6 (top)) shows each set spans a similar range of values of . This indicates that the range of amplitudes of motion is similar in the two types of structures. However, the range of R1e values is larger for the Ç/X construct set than for the bulge-mismatch set, which indicates that the rates of motion for the bases within the helix are faster (i.e. closer to the spectrometer frequency) than those in the bulges. Therefore, having two independent dynamics signatures allows us to identify the local motion, including both the rate and the amplitude of motion, that contribute to defining the different states of the DNA.
From a structural perspective, differences in dynamics reflect the possibility that the pyrimidine-based spin label Ç, when paired with a pyrimidine, either cytidine or thymidine, does not fill the region of space in the center of the duplex to the extent that Ç paired with either purine does. Hence the equilibrium structure of Ç, when paired with a pyrimidine, is that of a basepair held further within the helix, and thus the spin probe appears more rigidly locked by the surrounding duplex. Therefore, while the Ç/C pairing in the duplex is thermodynamically less stable than the Ç/G pairing, it appears to be dynamically more rigid. The present observations of a close Ç/C interaction agree with other proposed structure(s) for the C/C pairing, and with reported thermodynamic instability in the melting region in DNA duplexes with C/C pairings.54,56 It was also reported that perturbations induced by C/C pairing may persist over several base pairs.54,56 It is difficult to clearly define the extent or range of this interaction by conventional thermodynamic methods such as DSC. However, as shown here, EPR spectroscopy may provide an alternate viewpoint from which to investigate such sequence dependent perturbative effects. Consequently, our results on stability of Ç/C in the pre-melting region underscores the distinction between the information obtained from analysis of the melting region and that obtained from the EPR dynamics-sensitive base probe in the pre-melting region.
Validity of our assumptions on the structures of the SLOW and FAST references as well as bulge-mismatches is demonstrated by examining the distances between two Q probes. By determining the distance between two neighboring Q probes in duplex form, the spectrum (Figure S6 [1]) shows that nearest neighbor Q’s are at the interelectron distance predicted by simple helical B-form DNA (7.2 Å).57 When one Q probe is in a bulged position, the distance between the two Q’s is that of one probe pushed out of the helix and rotated, as illustrated in Figure 10. On the left in Figure 10, the bulged base is shown stacked into the duplex without a partner, sandwiched in between neighboring base pairs with a rotation angle of 17.3 degrees (half of the 34.6 degrees for a normal rotation) and a height of 1.7 Å. The predicted distance between the two spin probes, based on this geometry, would be only ~5 Å. Rotating the extra base by either 90° inward (B) or 90° outward (C), from the preceding base leads to distances of ~11 Å, which though structurally unlikely, corresponds to the distance measured between the neighboring spins. This result supports the assertion that one spin label is bulged out and rotated, likely with some additional bending, while the other remains locked into the helical structure.
Figure 10.

Cartoon-style figures of a bulged base, (2 in Figure 9), at different positions with respect to the duplex and inter-electron distances from a neighboring base in the duplex. The neighboring base is considered to be at the back, in these depictions. A) shows 2 possible orientations and distances for the bulged base, as referenced to the previous base: +17.3° and 1.7 Å from the neighboring base (gray), versus 34.6° and 3.4 Å (black), a usual base step. B) shows a -90° rotation of an unpaired base, and C) is a +90° rotation of an unpaired base.
Figure 9 shows that the one-base bulge FAST reference does not appear to intercalate into the duplex, as evidenced by the large percentage of single stranded dynamics. However, the two- and three-base bulge sequences seem to stabilize and be more like the duplex forms. One possible explanation for why the larger bulged region might appear to have less dynamics is that the bases stack but remain looped out. Other studies have suggested that the presence of stacked bases generates a local bend in the duplex DNA.58 For the case of one-, two-, and three-base adenine bulges the adenines stack into the duplex.27 The basepairs on either side of the bulge remains intact, but as the number of adenines at the bulge site increases, the bending increases.27 A solution NMR structure of an A-T-A 3-base bulge within a 12-mer DNA oligonucleotide showed that three bases did not greatly disrupt the helical axis, but rather created a large twist or “lateral shearing” between the two halves of the duplex.58 The present results seem to be very much in agreement with these other findings: The bulge-mismatches observed here are that of a stacked set of bases on the bulge side which neither intercalate nor directly stack against the duplex structure.
In Figure 8, the analysis of GÇA/AC in terms of the SLOW and FAST references demonstrates a complicated dependence on temperature that cannot be modeled by a simple two-state van’t Hoff type analysis. Nonetheless, a comparison with the two constructs GÇ/A and ÇA/C reveals startling similarities. At low temperature (below 20 °C), the GÇA/AC construct is much like one possible component, the GÇ/A construct, and at higher temperatures, is more like the other possible component, the ÇA/C construct. It is not surprising that the high temperature form is the one that is more calorimetrically similar to the GÇA/AC construct as it is the dominant form leading into the melting region. The conclusion about the GÇA/AC construct is that it is a temperature-dependent bi-stable structure, which approximates one type of bulge-mismatch equilibrium at low temperatures (the GÇ/A form, Figure 2 ) and another type at high temperatures (the ÇA/C form, Figure 2). Moreover, each of the components of this bi-stable switching structure (the GÇ/A and the ÇA/C constructs) is in turn composed of multiple-conformations.
CONCLUSIONS
Local, base-specific probes can provide dynamics and structural information on the nature of the components involved in polymorphic nucleic acid structures where non-duplex forms, specifically bulges and mismatches, are involved. Structural information can be obtained from different EPR-based “dynamic signatures”. Two different base-specific probes were used in multiple bulge-mismatch constructs, and van’t Hoff analysis used to examine the thermodynamics. Neither probe yielded a clear correspondence with NN model calculations. The utility of a base-specific probe to complement and interpret complex calorimetric data on multi-state structures has been demonstrated. The presence of several states in the pre-melt region of a bulge-mismatch structure is demonstrated; therefore, the calorimetric data on these structures cannot be interpreted in terms of a simple two-state model. Through analysis of the dynamics of a base-specific spin probe, we are able to demonstrate that a multi-state structure can be analyzed in terms of simpler bulges, and that temperature dependent, bi-stable forms may be quite common in non-duplex DNA and by implication RNA.
Supplementary Material
ACKNOWLEDGMENTS
This work was supported in part by NIH GM65944, GM62360, and NIH-NIEHS P30ES07033, the Iceland Research Fund (60028021), and by a doctoral fellowship to P. Cekan from the Eimskip Fund of the University of Iceland.
The authors thank Steve Alley for assistance in sample preparation, Kari Pederson, Greg Olsen, and Dorothy Caplow Echodu for comments on the manuscript, and J. Michael Schurr for scientific insight.
Footnotes
SUPPORTING INFORMATION AVAILABLE: Figures illustrating: two-component fit of EPR spectra; calculation of α from UV melting curves; rigid 14-mer simulated, FAST, and SLOW spectra at 0, 20, and 40 °C; results of fitting spectra to FAST and “closest match Ç/X” spectra; NN calculation comparisons; spectra and analysis of doubly spin-labeled samples for distance measurements. This material is available free of charge via the Internet at http://pubs.acs.org.
REFERENCES
- (1).Ellison MJ, Fenton MJ, Ho PS, Rich A. EMBO J. 1987;6:1513. doi: 10.1002/j.1460-2075.1987.tb02394.x. [DOI] [PMC free article] [PubMed] [Google Scholar]
- (2).Kim US, Fujimoto BS, Furlong CE, Sundstrom R, Humbert D, Teller C, Schurr JM. Biopolymers. 1993;33:1725. doi: 10.1002/bip.360331110. [DOI] [PubMed] [Google Scholar]
- (3).Roy KB, Miles HT. Biochem. Biophys. Res. Commun. 1983;115:100. doi: 10.1016/0006-291x(83)90974-9. [DOI] [PubMed] [Google Scholar]
- (4).Schurr JM, Delrow JJ, Fujimoto BS, Benight AS. Biopolymers. 1997;44:283. doi: 10.1002/(SICI)1097-0282(1997)44:3<283::AID-BIP7>3.0.CO;2-R. [DOI] [PubMed] [Google Scholar]
- (5).Shindo H, Fujiwara T, Akutsu H, Matsumoto U, Shimidzu M. J. Mol. Biol. 1984;174:221. doi: 10.1016/0022-2836(84)90374-7. [DOI] [PubMed] [Google Scholar]
- (6).Wang JC, Davidson N. J. Mol. Biol. 1966;15:111. doi: 10.1016/s0022-2836(66)80213-9. [DOI] [PubMed] [Google Scholar]
- (7).International Human Genome Sequencing Consortium Nature. 2004;431:931. doi: 10.1038/nature03001. [DOI] [PubMed] [Google Scholar]
- (8).Inglehearn CF, Cooke HJ. Nucl. Acids Res. 1990;18:471. doi: 10.1093/nar/18.3.471. [DOI] [PMC free article] [PubMed] [Google Scholar]
- (9).Kondo J, Sunami T, Takenaka A. Acta Crystallogr. D. Biol. Crystallogr. 2007;63:673. doi: 10.1107/S0907444907012607. [DOI] [PubMed] [Google Scholar]
- (10).Stassinopoulos A, Ji J, Gao X, Goldberg IH. Science. 1996;272:1943. doi: 10.1126/science.272.5270.1943. [DOI] [PubMed] [Google Scholar]
- (11).McNally EM, Duggan D, Gorospe JR, Bonnemann CG, Fanin M, Pegoraro E, Lidov HGW, Noguchi S, Ozawa E, Finkel RS, Cruse RP, Angelini C, Kunkel LM, Hoffman EP. Human Mol. Gen. 1996;5:1841. doi: 10.1093/hmg/5.11.1841. [DOI] [PubMed] [Google Scholar]
- (12).Hol EM, van Leeuwen FW, Fischer DF. Trends Mol. Med. 2005;11:488. doi: 10.1016/j.molmed.2005.09.001. [DOI] [PubMed] [Google Scholar]
- (13).Collins FS, Brooks LD, Chakravarti A. Genome Res. 1998;8:1229. doi: 10.1101/gr.8.12.1229. [DOI] [PubMed] [Google Scholar]
- (14).Li N, Mei L, Xiang Y, Tong A, Nishizawa S, Teramae N. Anal. Chim. Acta. 2007;597:97. doi: 10.1016/j.aca.2007.06.031. [DOI] [PubMed] [Google Scholar]
- (15).Okamoto A, Tainaka K, Kamei T. Org. Biomol. Chem. 2006;4:1638. doi: 10.1039/b600401f. [DOI] [PubMed] [Google Scholar]
- (16).Okamoto A. Nucleos. Nucleot. Nucl. Acids. 2007;26:1601. doi: 10.1080/15257770701548428. [DOI] [PubMed] [Google Scholar]
- (17).Takei F, Suda H, Hagihara M, Zhang J, Kobori A, Nakatani K. Chemistry. 2007;13:4452. doi: 10.1002/chem.200601496. [DOI] [PubMed] [Google Scholar]
- (18).Cekan P, Sigurdsson ST. Chem. Commun. (Camb) 2008;29:3393. doi: 10.1039/b801833b. [DOI] [PubMed] [Google Scholar]
- (19).Chi LM, Lam SL. Biochemistry. 2008;47:4469. doi: 10.1021/bi8001456. [DOI] [PubMed] [Google Scholar]
- (20).Shibutani S. Environ. Mut. Res. 2004;26:135. [Google Scholar]
- (21).Kalnik MW, Norman DG, Li BF, Swann PF, Patel DJ. J. Biol. Chem. 1990;265:636. [PubMed] [Google Scholar]
- (22).Kalnik MW, Norman DG, Zagorski MG, Swann PF, Patel DJ. Biochemistry. 1989;28:294. doi: 10.1021/bi00427a040. [DOI] [PubMed] [Google Scholar]
- (23).Fish DJ, Horne MT, Brewood GP, Goodarzi JP, Alemayehu S, Bhandiwad A, Searles RP, Benight AS. Nucl. Acids Res. 2007;35:7197. doi: 10.1093/nar/gkm865. [DOI] [PMC free article] [PubMed] [Google Scholar]
- (24).Kalnik MW, Norman DG, Swann PF, Patel DJ. J. Biol. Chem. 1989;264:3702. [PubMed] [Google Scholar]
- (25).Nikonowicz EP, Meadows RP, Gorenstein DG. Biochemistry. 1990;29:4193. doi: 10.1021/bi00469a024. [DOI] [PubMed] [Google Scholar]
- (26).Popenda L, Adamiak RW, Gdaniec Z. Biochemistry. 2008;47:5059. doi: 10.1021/bi7024904. [DOI] [PubMed] [Google Scholar]
- (27).Rosen MA, Live D, Patel DJ. Biochemistry. 1992;31:4004. doi: 10.1021/bi00131a016. [DOI] [PubMed] [Google Scholar]
- (28).Wang Y, Patel DJ. Biochemistry. 1995;34:5696. doi: 10.1021/bi00016a046. [DOI] [PubMed] [Google Scholar]
- (29).Breslauer KJ. Methods Enzymol. 1995;259:221. doi: 10.1016/0076-6879(95)59046-3. [DOI] [PubMed] [Google Scholar]
- (30).Crothers DM, Zimm BH. J. Mol. Biol. 1964;9:1. doi: 10.1016/s0022-2836(64)80086-3. [DOI] [PubMed] [Google Scholar]
- (31).DeVoe H, Tinoco I., Jr. J. Mol. Biol. 1962;4:500. doi: 10.1016/s0022-2836(62)80105-3. [DOI] [PubMed] [Google Scholar]
- (32).SantaLucia J., Jr. Proc. Natl. Acad. Sci. USA. 1998;95 doi: 10.1073/pnas.95.4.1460. [DOI] [PMC free article] [PubMed] [Google Scholar]
- (33).Barhate N, Cekan P, Massey AP, Sigurdsson ST. Angew. Chem. Int. Ed. 2007;46:2655. doi: 10.1002/anie.200603993. [DOI] [PubMed] [Google Scholar]
- (34).Miller TR, Alley SC, Reese AW, Solomon MS, McCallister WV, Mailer C, Robinson BH, Hopkins PB. J. Am. Chem. Soc. 1995;117:9377. [Google Scholar]
- (35).Cekan P, Smith AL, Barhate N, Robinson BH, Sigurdsson ST. Rigid spin-labeled nucleoside Ç: A non-perturbing EPR probe of nucleic acid conformation. Nucl. Acids Res. doi: 10.1093/nar/gkn562. in press. [DOI] [PMC free article] [PubMed] [Google Scholar]
- (36).Nielsen R, Canaan S, Gladden JA, Gelb MH, Robinson BH. J. Magn. Res. 2004;169:129. doi: 10.1016/j.jmr.2004.04.010. [DOI] [PubMed] [Google Scholar]
- (37).Freed JH. Theory of slow tumbling ESR spectra for nitroxides. In: Berliner LJ, editor. Spin Labeling: Theory and Applications. Academic Press; New York: 1976. p. 53. [Google Scholar]
- (38).Columbus L, Hubbell WL. Trends Biochem. Sci. 2002;27:288. doi: 10.1016/s0968-0004(02)02095-9. [DOI] [PubMed] [Google Scholar]
- (39).Smith AL, Cekan P, Rangel DP, Sigurdsson ST, Mailer C, Robinson BH. J. Phys. Chem. B. 2008;112:9219. doi: 10.1021/jp7111704. [DOI] [PubMed] [Google Scholar]
- (40).Griffith OH, Jost PC. Lipid Spin Labels in Biological Membranes. In: Berliner LJ, editor. Spin Labeling: Theory and Applicatons. Vol. 1. Academic Press, Inc.; New York: 1976. p. 453. [Google Scholar]
- (41).Freed JH, Fraenkel GK. J. Chem. Phys. 1963;39:326. [Google Scholar]
- (42).Okonogi TM, Reese AW, Alley SC, Hopkins PB, Robinson BH. Biophys. J. 1999;77:3256. doi: 10.1016/S0006-3495(99)77157-2. [DOI] [PMC free article] [PubMed] [Google Scholar]
- (43).Tirado MM, Torre J. G. d. l. J. Chem. Phys. 1980;73:1986. [Google Scholar]
- (44).Okonogi TM. Dynamics, thermodynamics, and structural investigations of nucleic acids using site-specific spin-labeling and electron paramagnetic resonance. University of Washington; 2000. [Google Scholar]
- (45).SantaLucia JJ, Hicks D. Annu. Rev. Biophys. Biomol. Struct. 2004;33:415. doi: 10.1146/annurev.biophys.32.110601.141800. [DOI] [PubMed] [Google Scholar]
- (46).Law SM, Eritja R, Goodman MF, Breslauer KJ. Biochemistry. 1996;35:12329. doi: 10.1021/bi9614545. [DOI] [PubMed] [Google Scholar]
- (47).Ricelli PV, Vallone PM, Kashin I, Faldasz BD, Benight AS. Biochemistry. 1999;38:11197. doi: 10.1021/bi9904407. [DOI] [PubMed] [Google Scholar]
- (48).Vallone PM, Benight AS. Biochemistry. 2000;39:7835. doi: 10.1021/bi000326k. [DOI] [PubMed] [Google Scholar]
- (49).Chalikian TV, Volker J, Plum GE, Breslauer KJ. Proc. Natl. Acad. Sci. U S A. 1999;96:7853. doi: 10.1073/pnas.96.14.7853. [DOI] [PMC free article] [PubMed] [Google Scholar]
- (50).Jelesarov I, Crane-Robinson C, Privalov PL. J. Mol. Biol. 1999;294:981. doi: 10.1006/jmbi.1999.3284. [DOI] [PubMed] [Google Scholar]
- (51).Privalov PL, Jelesarov I, Read CM, Dragan AI, Crane-Robinson CJ. J. Mol. Biol. 1999;294:997. doi: 10.1006/jmbi.1999.3285. [DOI] [PubMed] [Google Scholar]
- (52).Holbrook JA, Capp MW, Saecker RM, Record MTJ. Biochemistry. 1999;38:8409. doi: 10.1021/bi990043w. [DOI] [PubMed] [Google Scholar]
- (53).Mailer C, Nielsen R, Robinson BH. J. Phys. Chem. A. 2005;109:4049. doi: 10.1021/jp044671l. [DOI] [PubMed] [Google Scholar]
- (54).Tikhomirova A, Beletskaya IV, Chalikian TV. Biochemistry. 2006;45:10563. doi: 10.1021/bi060304j. [DOI] [PubMed] [Google Scholar]
- (55).Robinson BH, Haas DA, Mailer C. Science. 1994;263:490. doi: 10.1126/science.8290958. [DOI] [PubMed] [Google Scholar]
- (56).Boulard Y, Cognet JAH, Fazakerley GV. J. Mol. Biol. 1997;268:331. doi: 10.1006/jmbi.1997.0975. [DOI] [PubMed] [Google Scholar]
- (57).Hustedt EJ, Smirnov AI, Laub CF, Cobb CE, Beth AH. Biophys. J. 1997;72:1861. doi: 10.1016/S0006-3495(97)78832-5. [DOI] [PMC free article] [PubMed] [Google Scholar]
- (58).Rosen MA, Shapiro L, Patel DJ. Biochemistry. 1992;31:4015. doi: 10.1021/bi00131a017. [DOI] [PubMed] [Google Scholar]
Associated Data
This section collects any data citations, data availability statements, or supplementary materials included in this article.