

Abstract
Predicting which individuals will progress to Alzheimer’s disease (AD) is important in both clinical and research settings. We used brain Event-Related Potentials (ERPs) obtained in a perceptual/cognitive paradigm with various processing demands to predict which individual Mild Cognitive Impairment (MCI) subjects will develop AD versus which will not. ERP components, including P3, memory “storage” component, and other earlier and later components, were identified and measured by Principal Components Analysis. When measured for particular task conditions, a weighted set of eight ERP component_conditions performed well in discriminant analysis at predicting later AD progression with good accuracy, sensitivity, and specificity. The predictions for most individuals (79%) had high posterior probabilities and were accurate (88%). This method, supported by a cross-validation where the prediction accuracy was 70–78%, features the posterior probability for each individual as a method of determining the likelihood of progression to AD. Empirically obtained prediction accuracies rose to 94% when the computed posterior probabilities for individuals were 0.90 or higher (which was found for 40% of our MCI sample).
Keywords: Event-Related Potentials (ERP), Biomarker, Neurophysiology, Mild Cognitive Impairment (MCI), Alzheimer’s disease (AD), Diagnosis, Prediction, EEG, Principal Components Analysis (PCA), Discriminant Analysis, Posterior Probability, Early Detection
1. Introduction
There is a pressing need for a reliable method of early detection in the study and treatment of Alzheimer’s disease (AD), an age-related neurological illness with early cognitive and behavioral disruption particularly in the domain of memory. Specifically, the discovery of a biological marker for early detection of AD is vital. Brain Event-Related Potentials (ERPs) may have the power to predict AD progression in individuals with impaired mental functioning that does not reach the severity of clinically defined AD, a disorder known as Mild Cognitive Impairment (MCI) (Petersen et al, 1999; Petersen et al., 2001). Amnestic MCI is defined as memory difficulties without impairment in other cognitive domains or impact on activities of daily living and is considered a transitional state between normal aging and AD (Petersen, 2004). Because not all patients with MCI progress to AD, this group is of great interest for research on predicting individuals who progress versus those who do not. Brayne (2007) discussed the need for early detection and prediction and lamented that research results refer to groups, not individuals. Our research has developed methods with cognitive ERPs that are sufficiently robust to predict MCI individuals who will develop AD with associated probability of progression for each individual.
Brain ERP components related to memory (Düzel et al., 1999; Farah et al., 1988; Missonnier et al., 2003; Missonnier et al., 2004), vision (Beglieter et al., 1993; Beglieter et al., 1995; Friedman et al., 1981), and stimulus expectations (Donchin, 1981; Hagen et al., 2006) may be useful in understanding the cognitive deterioration seen in some MCI patients as they progress to AD. ERP components have been used to discriminate between normal aging and AD (Chapman et al., 2007), and it has been reported that ERPs may have important predictive power in measuring degeneration from MCI to AD (Missonnier et al., 2005; Missonnier et al., 2007; Olichney et al., 2002; Olichney et al., 2008). In this article, an ERP component structure that was previously identified and measured by Principal Components Analysis (PCA) and tested to be discriminatory of AD from normal aging (Chapman et al., 2007) was applied to MCI subjects to determine if ERP measures can be combined in a formal weighted fashion to predict progression to AD in MCI individuals.
The method and results presented in this paper generate and feature the posterior probabilities of group membership for each individual, a facet of predicting AD progression that we have not seen explored. Although it is often convenient to consider a diagnosis to be a binary decision between the existence of a disease in a patient or not, this may not capture the progressive nature of a dementia such as Alzheimer’s disease. The posterior probability can be used to indicate the likelihood of an individual developing AD (as demonstrated here) and perhaps might represent a measure of progression from a healthy, stable state to a demented state. Knowing with a probability which individuals will develop AD at a later date would allow early therapeutic and pharmacologic interventions.
2. Methods
2.1 Study subjects
We used 43 elderly individuals diagnosed with Mild Cognitive Impairment (MCI) (Table 1). These subjects were recruited from the Geriatric Neurology and Psychiatry Clinic at the University of Rochester and other affiliated University of Rochester clinics. All MCI subjects were evaluated by memory-disorders physicians and met current consensus criteria for the amnestic subtype of MCI (“a-MCI”) (Petersen et al., 1999; Petersen et al., 2001; Petersen, 2004). (In this article, we will use the term “MCI” to refer to amnestic MCI). Each MCI subject was subsequently determined to either have progressed to clinically defined AD (through the NINCDS-ADRDA criteria (McKhann et al., 1984) and DSM-IV-TR criteria for Dementia of the Alzheimer’s Type (Diagnostic and Statistical Manual of Mental Disorders-Fourth Edition, Text Revision; American Psychiatric Association, 2000)) or to have remained stable with regard to cognitive state. These independent determinations were made through clinical follow-ups at a later date by the same memory-disorders physicians, who were blind to our study data. Those who progressed were given the typical clinical assessment of “probable” AD (but referred to here as AD for brevity’s sake). The clinical diagnosis of MCI and AD was based on a detailed patient history, relevant physical and neurological examinations and laboratory findings, and imaging studies routinely performed as part of the clinical assessment of dementia (Petersen et al., 2001). Separate cognitive testing was performed by the memory-disorders physicians to assist with their diagnosis; these tests included the Mini Mental State Examination (MMSE) (Folstein et al., 1975), a clock face drawing, the Auditory Verbal Learning Test (Rey, 1964; Taylor, 1959), and a category fluency task (animal naming).
Table 1.
Subject demographics. Values appear as mean (SD). The age and education information is in number of years. There was no significant group effect, gender effect, or group by gender interaction for the age and education demographics. Three subjects did not have MMSE scores, and two of those subjects also did not provide education information.
| Group | Gender | Age | Education | MMSE1 |
|---|---|---|---|---|
| Mild Cognitive Impairment (MCI) (n=43) | ||||
| Progress (n=15) | 3 Females, 12 Males | 76.7 (5.2) | 15.7(2.1) | 25.0(3.2) |
| Stable (n=28) | 15 Females, 13 Males | 74.8 (8.8) | 14.2 (2.6) | 27.1 (2.5) |
MMSE = Mini-Mental State Examination (Folstein et al., 1975).
In order to match the terminology of the medical community, we will use the term “Progress” to indicate the disease is progressing. Of the 43 MCI patients, 15 were subsequently diagnosed with AD (the Progress to AD group, or Progress group) and 28 were not (the Stable group). The median number of years between the initial diagnosis of MCI and the subsequent diagnosis of AD was 0.9 (min=0.3, max=3.9, SD=1.1) for the Progress group. For the Stable group, the median number of years between the initial MCI diagnosis and the most recent clinical work-up was 2.07 (min=0.3, max=4.8, SD=1.2). Although the time between our baseline ERP data collection and clinical follow-up was short for some subjects, we included as many participants with follow-up information as possible to boost the sample size used in our analysis understanding that some members of the Stable group may not have been given enough time to progress to AD. The gender, age, education, and MMSE demographics for each group appear in Table 1. There were no significant group or gender differences for age and education. In the Progress group, 7 of the 15 individuals were taking cholinesterase inhibitors and/or memantine at the time of testing. In the Stable group, 11 of the 28 individuals were taking these medications. The proportions taking these medications were not significantly different between these groups (Fisher’s Exact Test, χ2 (1, N = 43) = 0.78, p=0.52).
Exclusion criteria for all groups included clinical (or imaging) evidence of stroke, Parkinson’s disease, HIV/AIDS, and reversible dementias, as well as treatment with benzodiazepines, antipsychotic, or antiepileptic medications. As an additional inclusion criterion, all subjects had a previously administered score of 21 or higher on the MMSE (this criterion included AD subjects recruited for this and other research; the MCI subjects used in this study had mean MMSE scores of 25 or 27 (Progress or Stable) as shown in Table 1). Our study received IRB approval from the University of Rochester Research Subjects Review Board, and informed consent was obtained from each subject.
2.2 Neuropsychological assessment
In addition to the cognitive testing performed by the memory-disorders physicians who routinely evaluated our subjects, we administered a neuropsychological test battery to the MCI participants when the ERP data was collected as part of our experimental paradigm. We designed the battery to produce a comprehensive sample of cognitive processes. Among others, the tests included measures of memory retrieval and retention, generative fluency, executive function, visuospatial abilities, and attributes of mood and daily living. The results of these neuropsychological tests appear in Table 2. Only five measures reached statistical significance at p<0.01, which was selected as a more conservative threshold than 0.05 yet one that is less strict than the Bonferroni adjustment. All five measures were memory measures, and only one of these measures relates to executive function (the Hopkins Verbal Learning Test Discrimination Index). All other measures of executive function were not significantly different between the groups. There was no significant difference between the two MCI subgroups in comorbid depressive symptoms (as shown through the Geriatric Depression Scale) or in impact of disease on daily activities (indicated by the Blessed Dementia Scale). In general, the mean scores for the Geriatric Depression Scale for each group were considered “normal” for depressive symptoms (Hickie and Snowdon, 1987).
Table 2.
MCI Progress and MCI Stable group means (SDs) for each of the neuropsychological tests.
| Group Mean Scores | |||
|---|---|---|---|
| Test Measure | Progress (n=13)* | Stable (n=27)* | p Value† |
| Rey-Osterrieth Complex Figure (Rey, 1941; Osterrieth, 1944) | |||
| Copy Score | 26.8(7.4) | 30.8(3.9) | NS |
| Immediate Recall Score | 4.3(5.2) | 10.6(6.8) | <0.01 |
| Delayed Recall Score | 5.2(5.5) | 9.5(7.2) | NS |
| Mini-Mental State Examination (Folstein et al., 1975) | |||
| Score | 25.0(3.2) | 27.1(2.5) | NS |
| WMS-III Digit Span (Wechsler, 1997) | |||
| Forward Score | 6.3(1.1) | 6.3(1.0) | NS |
| Backward Score | 4.8(1.0) | 5.0(1.3) | NS |
| Letter-Number Sequencing | 4.5(1.3) | 5.0(1.3) | NS |
| Geriatric Depression Scale (Yesevage et al., 1983) | |||
| Score | 7.2(7.7) | 6.5(4.6) | NS |
| WMS-R Logical Memory I (Wechsler, 1945; Wechsler, 1987) | |||
| Total Recall Score | 23.2(11.5) | 34.7(10.7) | <0.01 |
| WMS-R Logical Memory II (Wechsler, 1945; Wechsler, 1987) | |||
| Total Recall Score | 9.2(10.8) | 17.6(9.9) | NS |
| Recognition Score | 20.9(5.3) | 24.1(3.9) | NS |
| Clock Drawing Test (Tuokko et al., 1992) | |||
| Score | 18.5(1.3) | 18.6(2.3) | NS |
| North American National Adult Reading Test (Grober and Sliwinski, 1991) | |||
| Score | 38.2(7.2) | 37.3(8.3) | NS |
| Stroop Test (Golden, 1978) | |||
| Color-Word Score | 26.6(10.8) | 27.3(9.3) | NS |
| Brief Visuospatial Memory Test-Revised (Benedict and Groninger, 1995) | |||
| Total Recall Score | 7.5(5.2) | 12.7(7.7) | NS |
| Delayed Recall Score | 2.1(2.1) | 4.5(3.4) | NS |
| Discrimination Index | 4.6(1.6) | 4.4(1.3) | NS |
| Controlled Oral Word Association Test (Benton and Hamsher, 1976) | |||
| Total Score (F, A, S) | 34.5(17.2) | 37.6(12.4) | NS |
| Category Fluency (Benton and Hamsher, 1976) | |||
| Score (animal naming) | 13.4(5.7) | 16.5(5.3) | NS |
| Blessed Dementia Scale (Blessed et al., 1968) | |||
| Score | 1.8(1.8) | 1.3(1.4) | NS |
| Hopkins Verbal Learning Test (Brandt, 1991) | |||
| Total Recall Score | 17.1(5.9) | 23.0(5.2) | <0.01 |
| Delayed Recall Score | 2.9(4.0) | 6.3(3.2) | <0.01 |
| Discrimination Index | 6.7(3.6) | 9.5(2.1) | <0.01 |
| Boston Naming Test (Kaplan et al., 1978; Mack et al., 1992) | |||
| Score (15 item maximum) | 13.8(1.2) | 14.3(0.8) | NS |
| Standardized Road-Map Test of Direction (Money, 1976) | |||
| Score | 26.7(7.4) | 25.6(7.3) | NS |
| Trail Making Test (Reitan, 1958) | |||
| Trail A Score (in seconds) | 52.8(22.3) | 40.6(12.4) | NS |
| Trail B Score (in seconds) | 182.3(118.9) | 109.0(54.7) | NS |
Two members of the Progress group and one member of the Stable group did not complete the neuropsychological battery, leaving 40 MCI individuals contributing to the group means reported.
In order to maintain a significance level of 0.05 for the entire family of neuropsychological tests, the Bonferroni adjustment would result in p < 0.002 for each individual test; using this, no test reached statistical significance at this level. Because the Bonferroni is often considered too conservative, a two-tailed p level < 0.01 was selected. NS = not significant.
The neuropsychological assessment shown in Table 2 was not used by the memory-disorders physicians in their diagnosis of the MCI patients. Their diagnostic decisions were made completely independent of any data collected in our laboratory. While the two MCI subgroups performed slightly differently, no MCI subject reached the diagnostic criteria for AD. Additionally, on average the subjects of each group did not score 1.5 SD below the normative mean on tests of other cognitive domains aside from memory, a criterion offered by Petersen (2004) as indicative of amnestic MCI-like impairment. In examining each individual’s neuropsychological test results, four subjects may have had impairments in domains secondary to memory (cognitive domains as defined by the NINCDS-ADRDA criteria). One member of the Progress group had impairment in the language domain and three individuals had impairments with problem-solving (one member of the Progress group and two members of the Stable group). However, even if some of the subjects had clinically undiagnosed multiple-domain amnestic MCI, Petersen (2004) indicated that the pattern of progression in both single-domain and multiple-domain amnestic MCI tends to lead to AD (when other factors, such as a vascular or mood component, are excluded, as was done by the memory-disorders physicians).
The neuropsychological assessment is reported here to help characterize the MCI group in this sample. Detailed analyses of these data are not reported here because this paper is focused on ERP measures.
2.3 The Number-Letter paradigm
Subjects completed a Number-Letter paradigm which employed a visual task with memory and other cognitive demands. Memory storage of the first relevant stimulus was required in order to compare it with the second relevant stimulus. Thus, in order to complete the task, the subjects discriminated between stimuli relevant and irrelevant to the task. Two numbers and two letters were flashed individually in random order at intervals of 750 ms preceded and followed by a filled square comparable in size to the numbers and letters. All visual stimuli were white presented briefly (∼20 ms) on a dark background. On a number-relevant block of trials, the participant compared the two numbers in each trial for numerical order, the letters being irrelevant to the task. On another block of trials, the numbers were irrelevant and the task involved comparing the two letters for alphabetic order. At the end of each trial, the participant said “Forward”, “Backward”, or “Same” to indicate the order of the two relevant stimuli. The numbers (1 to 6) and letters (A to F) were randomly chosen, and the sequences of numbers and letters in the four temporal intratrial positions were randomized (constraint of two numbers and two letters per trial). Every participant was shown a randomized sequence of trials. One block of 102 number-relevant and one block of 102 letter-relevant trials were completed by each subject. Subjects were provided practice trials before these experimental blocks began.
Our MCI subjects were able to perform the task with strong success. The Progress group on average answered correctly on 95.1% (SD = 3.7%) of the trials, and the Stable group performed at 96.1% (SD = 3.9%). Both groups were similar to like-age, cognitively normal Controls (96.0%, SD = 2.6%).
2.4 EEG recording
Scalp electrodes (O1, O2, OZ, T3, T4, T5, T6, P3, P4, PZ, C3, C4, CZ, F3, F4, and EOG with reference to linked earlobes) recorded electrical brain activity while the participant performed the Number-Letter task. To begin with a simpler model developed for clinical purposes, we will limit our report in this case to analysis of ERPs at CZ. Picton et al. (2000) wrote in their guidelines that ERPs can be adequately examined for clinical purposes using a single recording channel. Collecting ERP functions at a distance from their discrete brain sources is facilitated by volume conduction in a conducting medium, measures that are based on electrical potential differences between electrodes, and dipole orientations of the sources. Keeping the number of measures entering a discriminant analysis low relative to the number of observations (individuals) is important for not capitalizing on chance in the development of a discriminant function. This is a major methodological reason for limiting the electrodes in this analysis. The central midline site (CZ) is featured here because it provides a good view of many ERP components of interest (Chapman, 1969; Chapman, 1974; Chapman and McCrary, 1979) with the same paradigm used here. Moreover, we have disentangled and measured partially overlapping ERP components based on a formal analysis (PCA) that yielded eight ERP components from this site with similar subjects (Chapman et al., 2007) and successfully used these measures in discriminating AD and Control individuals.
Frequency bandpass of the Grass amplifiers was 0.1 to 100 Hz. Beginning 30 ms before each stimulus presentation, 155 digital samples were obtained at 5 ms intervals. Subsequently, the digital data were digitally filtered to pass frequencies below 60 Hz, and artifact criteria were applied to the CZ and EOG channels to exclude those 750 ms epochs whose voltage range exceeded 200 µV or whose baseline exceeded ±250 µV (baseline was mean of 30 ms pre-stimulus). The ERPs were based on correct trials and data not rejected for artifacts. Mean artifact rejection rate for all MCI subjects was 6.4% (SD = 13.8%).
2.5 Statistical analysis
Event-Related Potentials: Principal Components Analysis
ERPs were derived for each subject from the EEG vectors (155 time points) by averaging each vector separately for each of the stimulus conditions in this experimental design. Kayser and Tenke (2005) discuss the difficulty in visually identifying and quantifying the ERP components “even after thorough inspection of the waveforms”. In our study, ERP components were identified and measured by Principal Components Analysis (PCA) with Varimax rotation which allows the variations due to experimental conditions and individual differences in the data to define the ERP components. While some have expressed concerns about PCA in ERP component analysis, the major misgivings focus upon misallocation of variance. Picton et al. (2000) have stated that misallocation of variance is a problem general to any analysis of ERP data where components overlap. Several simulation studies revisited the problem of misallocation of variance by modeling the component prototypes introduced by Wood and McCarthy (1984) using new perspectives and comparisons not previously considered (Achim and Marcantoni, 1997; Beauducel and Debener, 2003; Chapman and McCrary, 1995; Dien, 1998). For reviews of recent developments using PCA, see Kayser and Tenke (2005) and Dien et al. (2005). For instance, Chapman and McCrary (1995) noted that the misallocation of variance, or component leakage, is likely due to correlated prototypes rather than their overlap and may spread from components producing a large effect size to neighboring components that yield a much smaller effect size. That paper also demonstrated that when the original component prototypes were slightly altered, there was no leakage among the PCA components; however, a peak amplitude measure resulted in a perfect 100% misallocation of variance. Moreover, when the PCA scores are used as predictors in discriminant analyses for purposes of classification (as is done here), they are linearly combined in discriminant functions and any spreading of effects to other components should be automatically adjusted by the weights being developed to maximize the discrimination between classes (groups).
We previously performed the PCA using a correlation matrix of the 155 time points on 48 individuals: 12 with clinically diagnosed AD, 12 MCI individuals, 12 elderly Controls, and 12 young subjects. This set of varying groups all completed the same Number-Letter task under the same experimental and recording conditions, and these subjects and their ERP data were used in a previous study to discriminate between AD and normal cognition using ERP components (for more information, see Chapman et al., 2007). This set of groups was used to create components that would be more generalizable to a wider array of individuals (John et al., 1993). Of the 12 MCI subjects used in developing this component solution, only 4 appear in the MCI dataset of this paper. Deriving a component solution from a narrow set of similar individuals has been shown to limit the range in the variables and attenuate correlations among variables that can result in falsely low estimates of component loadings (Fabrigar et al., 1999). Thus we included a wide variety of individuals in developing our ERP component solution (Chapman et al., 2007). In addition to the technical reasons given for including individuals from diverse groups, it is desirable to have established a method of measuring the ERP components that does not require doing a complete PCA for each new subject, but rather simply applying the “component loadings” that were already developed.
Eight components were retained by Kaiser’s Eigenvalue > 1 rule (accounting for 95% of the variance). The components included well-known components, such as C415, which is often called parietally-loaded P3 (Chapman, 1965; Chapman and Bragdon, 1964; Chapman et al., 1978; Chapman et al., 1981; Donchin, 1981), contingent negative variation (CNV) (Walter et al., 1964), and memory “storage” component C250 (Chapman et al., 1978; Chapman et al., 1981), as well as other early and late components. Part of the PCA output (the component loadings) represented the temporal waveforms of each ERP component (Chapman et al., 2007). Here the ERP component scores (mean zero and variance one) of the 43 MCI individuals were measured using the component structure developed in that previous PCA analysis. We mathematically generated component scores given the ERPs for each subject’s experimental conditions (component_conditions). The SAS 9.1.3 procedures FACTOR and SCORE were used to generate the component solution and calculate component scores for the MCI groups (SAS OnlineDoc 9.1.3).
For this report, only measures for relevant and irrelevant conditions averaged over all the other conditions were analyzed in the discriminant analyses. The intratrial positions and the stimulus conditions of each component were averaged separately for relevant and irrelevant stimulus conditions resulting in 16 ERP component_conditions (8 ERP components obtained for relevant and irrelevant stimuli) for each subject. The blank conditions (the first and last epochs of each trial where the subject saw the square stimuli) were omitted from further analysis. Unlike our previous work (Chapman et al., 2007), the component_conditions were further averaged over the trial number (odd, even). This was done to increase the sample size of each ERP component_condition and reduce noise.
Discriminant Analyses
The component_conditions for each MCI subject were used to predict the individuals who would develop AD at a later date and those who would remain stable. This was completed through another multivariate procedure: discriminant analysis based on Bayesian posterior distributions (Ingelfinger et al., 1983). The linear discriminant function is comprised of the sum of the scores of the selected component_conditions, and each component_condition was weighted by its best contribution in differentiating the subject groups (Progress vs. Stable). First, a stepwise discriminant procedure selected the component_conditions best able to differentiate between the two subject groups (PROC STEPDISC of SAS; see below). This was done by first selecting the component_condition that best discriminates. The next component_condition was then chosen after the discriminatory effect of the first one was removed. This process continued until there was no important improvement in the discriminability of the function. After selecting the predictor variables, discriminant functions, created from the groups’ ERP component scores of the chosen component_conditions (Table 3 and Table 4), were used in a second procedure to classify each MCI individual as either a member of the Progress group or the Stable group. This classification was dependant on from which group that individual had the smaller generalized squared distance (PROC DISCRIM of SAS; see below).
Table 3.
Mean component scores (SD) for the eight ERP components for the relevant and irrelevant stimulus conditions for the Progress and Stable groups. The component scores were based on mean zero and variance one.
| ERP Component Scores (Group Mean and SD) | ||||
|---|---|---|---|---|
| ERP Component | Progress (n=15) | Stable (n=28) | ||
| Stimulus Conditions | Stimulus Conditions | |||
| Relevant | Irrelevant | Relevant | Irrelevant | |
| C1: Slow Wave | −0.24(0.73) | −0.50(0.75) | −0.43(0.84) | −0.67(0.57) |
| C2: CNV | −0.49(0.95) | −0.29(0.62) | −0.71(0.62) | −0.34(0.92) |
| C3: C415 “P3” | −0.54(0.64) | −0.74(0.63) | −0.19(0.66) | −0.76(0.67) |
| C4: C250 “Memory Storage” | −0.39(0.82) | −0.41(0.77) | −0.32(0.46) | −0.41(0.65) |
| C5:C140 | 0.10(0.72) | 0.04(0.72) | 0.06(0.67) | 0.03(0.68) |
| C6: C540 | 0.23(0.89) | 0.04(0.57) | 0.11(0.87) | 0.02(0.84) |
| C7: C325 | −0.20(0.47) | −0.18(0.40) | −0.37(0.89) | −0.12(0.49) |
| C8:C185 | 0.68(1.10) | 0.46(0.96) | 0.19(0.60) | −0.02(0.73) |
Table 4.
Development results using ERP components to predict progression to AD in MCI individuals. A. Linear discriminant function coefficients (SEM) for classifying MCI individuals into Progress to AD and Stable groups. The discriminant functions classified MCI individuals into two groups (those who will Progress to AD and those who will remain Stable) on the basis of ERP component_conditions. Variable names: 3-digit numbers indicate latency (ms) of the ERP component waveform maxima; Rel or Irr indicate relevant or irrelevant stimulus conditions that evoked the ERP. Discriminant coefficients (from development set) shown are for the eight component_conditions selected, in this order, by the stepwise discriminant procedure. These coefficients are provided for replication with novel data. B. Prediction summary for the 43 MCI subjects. T+ indicates a positive ERP test result (ERP test predicts MCI progression to AD) and T-indicates a negative ERP test result (ERP test predicts MCI remaining stable).
| A. | ||
|---|---|---|
| Variable | Progress | Stable |
| (n=15) | (n=28) | |
| Constant | −1.47(0.03) | −1.22(0.02) |
| C185_Rel | 1.44(0.04) | −0.35 (0.04) |
| C540_Rel | 1.48(0.06) | −1.47(0.04) |
| C415_Rel | −1.61 (0.06) | 1.78(0.08) |
| C415_Irr | −0.34 (0.07) | −3.29(0.08) |
| C250_Irr | 1.97(0.10) | −2.99 (0.07) |
| C250_Rel | −2.76(0.10) | 1.84(0.07) |
| C325_Irr | −1.21 (0.06) | 1.03(0.04) |
| C540_Irr | 0.09 (0.05) | 0.91 (0.05) |
| B. | |||||
|---|---|---|---|---|---|
| MCI Subgroups | T+ | T− | Total | ||
| Progress | 12 | 3 | 15 | Sensitivity: 0.80 | |
| Stable | 6 | 22 | 28 | Specificity: 0.79 | |
| Total | 18 | 25 | 43 | Accuracy: 79% | χ2 = 13.8 (p=0.0009)* |
Note. Standard errors of the coefficients were calculated using a bootstrapping procedure with replacement (1000 bootstrapped random samples were taken).
Corrected via Bonferroni's adjustment for multiple comparisons.
In addition, a one-left-out cross-validation was computed to assess classification of subjects that had not contributed to the development of the discriminant functions. The cross-validation uses two distinct samples (development and validation). When each individual serves as validation, that individual does not contribute to the development of the coefficients in the discriminant equation. Thus, a new discriminant function is developed for and tested on every subject individually. This validation method has been shown to achieve a nearly unbiased estimate (Hora and Wilcox, 1982; Lachenbruch, 1975), and when all predictors are forced into the equation, bias is eliminated (Tabachnick and Fidell, 2001). We used the stepwise procedure only to select the variables to use, and these variables remained fixed in the discriminant procedure and cross-validation procedure where all were forced to enter. Additionally, we chose this method considering sample size limitations and our desire to use as much data as possible in the development of the discriminant function (Johnson and Wichern, 2002). This jackknifed classification validation makes good use of a limited number of individuals in that all but one of them contribute to the development, and the larger sample size (n-1 compared to n/2 in a split-half approach) enhances the stability of the solution. This solution stability coupled with elimination of bias in classification makes for a better approach given a limited, fixed sample size. Hora and Wilcox (1982) indicated that the one-left-out method is a “superior alternative” to a split-half method, which has an unfortunate effect of reducing the effective sample size.
Discriminant analysis also provides the posterior probability of group membership for each subject, which adds a key quantitative context when analyzing binary predictions for individuals. The accuracy of these predictions based on ERP data was assessed by comparing with the later clinical outcome for each subject. We also calculated the sensitivity and specificity of the group classifications.
Discriminant analysis was used because the procedure not only can develop classification (discriminant) functions, but it also computes the posterior probability of group membership for each individual as an integral part of the computation. The STEPDISC and DISCRIM procedures of SAS 9.1.3 (SAS OnlineDoc 9.1.3) were used to conduct the discriminant analyses. To evaluate the statistical significance of our classification results, we applied a one-tailed Fisher’s Exact Test with an alpha level of 0.05. This test is appropriate because each individual is placed in a cell in a 2×2 contingency table: ERP test classification of Progress or Stable by clinical diagnosis of Progress or Stable. We would not consider the ERP predictions successful if they were significantly in the wrong direction, so a one-tailed rejection region is appropriate. As was performed on the neuropsychological data, p values calculated from the Fisher’s Exact Tests on classification results were corrected with a Bonferroni adjustment for multiple comparisons (Shaffer, 1995).
3. Results
3.1 Group mean ERPs to relevant and irrelevant stimuli
For illustrative purposes, the ERPs of the Progress and Stable groups were averaged separately for the relevant and irrelevant stimulus conditions. These mean ERPs were visually compared to those from a group with clinically diagnosed AD and those from a group of like-age Controls judged by memory-disorders physicians to have normal cognitive function (Figure 1). The ADs and Controls are the same subjects who contributed to the PCA component solution (Chapman et al., 2007). Although all the MCI individuals were in the same clinical diagnostic group at the time their ERPs were recorded, those that later would progress to AD showed obviously different average ERP waveforms than those who would remain stable. The differences in ERP amplitude between the relevant and irrelevant conditions were much smaller for the Progress group (which was similar to the AD group, plotted above) than the Stable group (which was similar to the Control group, plotted below).
Figure 1.

The mean brain ERPs to relevant and irrelevant stimuli for the AD(n=12), MCI (Progress(n=15) and Stable(n=28)), and like-age Control(n=12) groups. The ERP data for the MCI individuals were collected approximately 1–2 years before clinical follow-up where progression to AD or stability was determined. For demographic information concerning the ADs and the like-age Controls, see Chapman et al., 2007. The ERPs here were recorded at CZ with reference to linked earlobes. The ERPS shown are from relevant and irrelevant stimulus conditions averaged over all other conditions. For underlying ERP components, see Figure 2 for temporal waveforms (loadings) and Table 3 for group mean component scores.
Although Figure 1 represents the observed ERPs, these will mirror virtual ERPs for the relevant and irrelevant conditions. Since 95% of the variance of the PCA dataset was accounted for by the eight components retained, the virtual ERPs built from these eight components with the appropriate component scores for the experimental conditions (Table 3) will very closely approximate the observed ERPs. Examples like this were shown in Chapman et al., 1979 for the same paradigm where 96% of the variance of the PCA dataset was accounted for by eight ERP components. Looking at these overall average waveforms may lead to interpretation without benefit of knowing the underlying components. However, we present them in Figure 1 to offer an overall impression that the ERP waveforms may be different between the Progress and Stable groups under our experimental conditions as well as different from AD and Control groups. We take account of the variability within groups after measuring the ERP components and using their amplitudes (component scores) (Table 3).
3.2 Predicting MCI individuals who progress to AD (discriminant analyses)
To predict which MCI individuals will progress to AD and which will not, we used discriminant analysis to derive and apply a weighted combination of ERP component scores. The temporal waveforms of the five ERP components used in the discriminant analysis are shown in Figure 2. The group mean component scores for the relevant and irrelevant stimulus conditions for each of the eight components are listed in Table 3, and Table 4A contains the group-derived discriminant functions for the eight selected component_conditions. Little credence should be placed in the meaning of the particular coefficients found for the sample unless all important variables are known to be included in the analysis or are known to be uncorrelated with the variables already included (Ahlgren, 1986). We show them here because they were used in the discriminant functions as the weights to be multiplied by the ERP component_condition scores of an individual and as a set were assessed to have favorable, statistically significant classification success (Table 4B). Furthermore, they may be used as a tool in analyzing additional data. It should also be noted that an examination of the univariate group mean component scores listed in Table 3 may not reveal the relative contributions of the components selected in the multivariate set with the greatest discriminability between the groups because the stepwise discriminant procedure takes the correlations among the component scores into account during its analysis.
Figure 2.
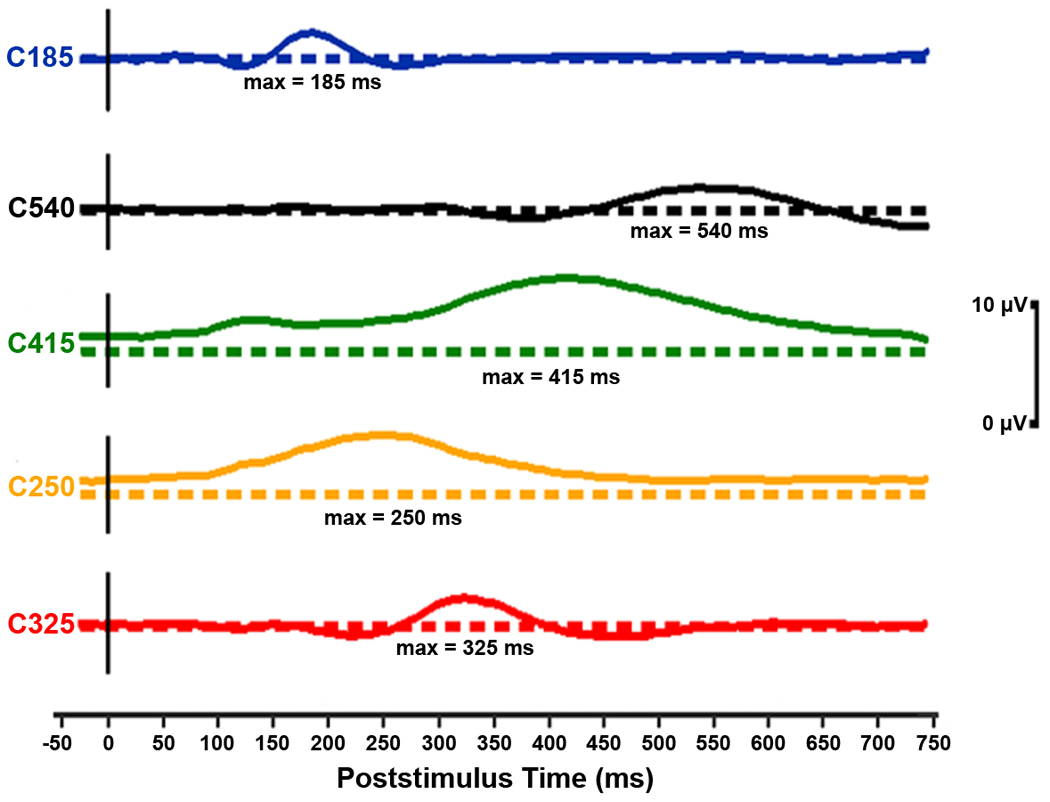
Temporal waveforms of the ERP components selected by the stepwise discriminant procedure for their predictive power of progression to AD in MCI. Each component is offset here with its baseline shown as a dashed line. In these component waveforms, the metric has been restored by multiplying the loading at each time point by the standard deviation of the data set at the corresponding time point (Chapman and McCrary, 1995). The amplitudes depicted are for a component score of 1.0. The five components appear (top to bottom) in the order they were selected by the discriminant procedure. The discriminant procedure actually selected component_conditions (these were ERP components scores under either relevant or irrelevant stimulus conditions; for more information, see Table 3 and Table 4).
The discriminant functions were individually applied to the component scores of the 43 MCI subjects to classify each subject into the Progress or Stable group with an associated posterior probability. Of the 15 MCI individuals in the Progress group, our ERP test measures correctly predicted 12 would later develop AD (Table 4B). The discriminant analysis also correctly predicted 22 of the 28 subjects in the Stable group would not progress to AD. Overall, 34 of 43 individuals were correctly classified, a prediction accuracy of 79% (Fisher’s Exact Test, χ2 (1, n = 43) = 13.8, p=0.0009). The sensitivity (the number of MCIs who were correctly predicted to progress to AD out of the total number that did progress to AD) and the specificity (the number of MCIs correctly predicted to remain stable out of the total number that did remain stable) were 0.80 and 0.79, respectively. Thus, the ERP components were able to detect progression to AD and differentiate between progression and stability with good success. Also, it is possible that, given more time, some members of the Stable group might develop AD. If the six stable individuals who were predicted to progress to AD in fact develop it later, then the accuracy, sensitivity, and specificity would increase.
All four subjects with possible multiple-domain amnestic MCI received correct predictions from our ERP method (two to progress and two to remain stable). Thus this basis of prediction may apply to both single-domain and multiple-domain amnestic MCI, though further study is necessary to confirm this.
It was important to determine how confident (probable) these predictions were. In addition to the decision of group membership (will progress to AD or will remain stable) for each participant, the posterior probability of membership in either group was also provided by the discriminant procedure (for an example, see Chapman et al., 2007). This added a quantitative context to the binary predictive decision by supplying a measurement of likelihood that the group into which the subject was placed by our ERP measures was the correct one. The obtained prediction accuracy (percent of subjects correctly classified) for each posterior probability bin was plotted (Figure 3). Subjects were placed in posterior probability bins by their probability of belonging to the group in which the discriminant function placed them (and placement was determined by the group for which the posterior probability was greater than 0.50). First, the obtained prediction accuracy does dramatically rise with posterior probability. Most (34) of the 43 subjects lie in highly confident posterior probability bins (0.70 – 1.00). Additionally, half of the 34 subjects lie in the highest confidence bin (0.90 – 1.00), where the obtained prediction accuracy was 94%. Even in the slightly less confident bins, the prediction accuracy remains very good (81%–84%). Only in the lowest bins (which contain only 9 subjects) does the accuracy greatly decrease to near 50%. These bins (0.50 – 0.59 and 0.60 – 0.69) could be considered “too close to call”. The remaining 79% of individuals were correctly predicted with 88% accuracy. Thus, with this method of using the posterior probabilities, most of the subjects have correct predictions, and the confidence in those predictions is high.
Figure 3.
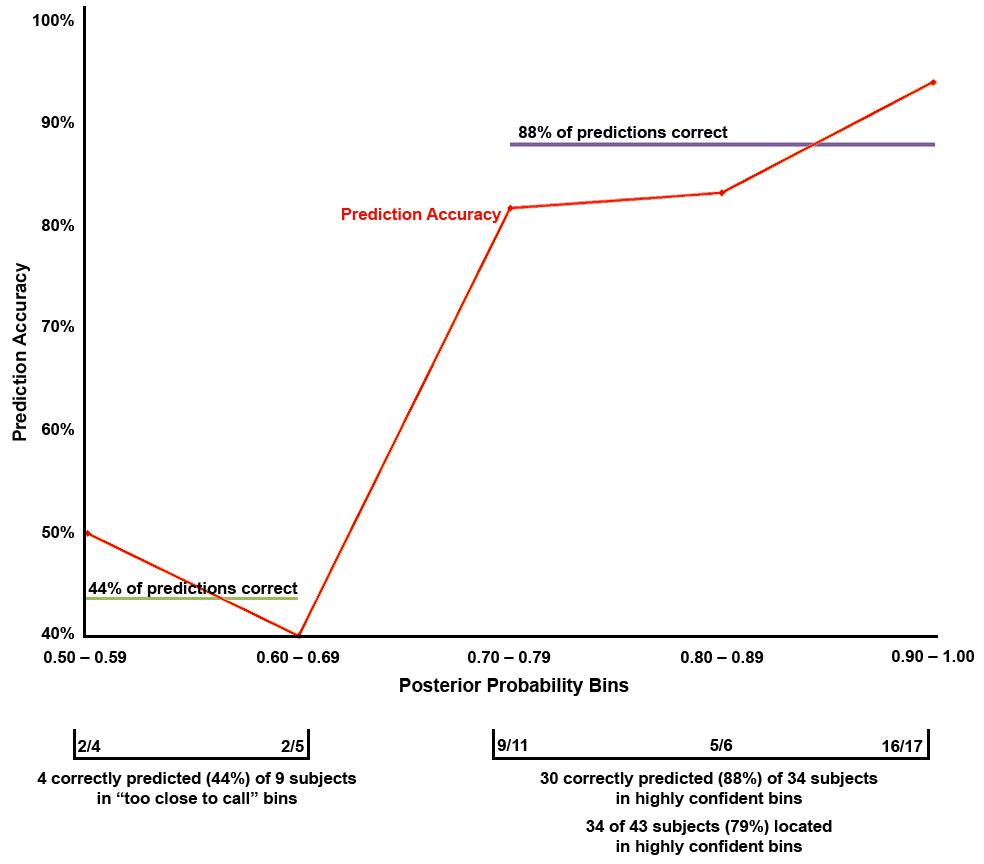
The prediction accuracy for, and number of subjects in, each posterior probability bin based on the development set. Prediction accuracy is the percent of MCI individuals correctly predicted to progress to AD or remain stable. Each of the 43 MCI individuals was placed in a bin by the probability of group membership calculated through the discriminant function (placement was determined by the probability greater than 0.50). The number of subjects is given below the x-axis (e.g. 16/17 = 16 of 17 subjects were correctly classified in this posterior probability bin). Disregarding the bins with low probability (those that were “too close to call”), the prediction accuracy and number of subjects data show 79% of the subjects were predicted with high confidence (in the 0.70 – 1.0 bins) and 88% of these predictions were correct.
In addition, a cross-validation was performed. The cross-validation created discriminant functions for each individual using the data of all other subjects in the MCI group and then used those functions to classify the individual as a member of either the Progress or Stable groups. Thus, 43 separate pairs of discriminant functions were calculated. The mean discriminant coefficients for each component_condition for each group are shown in Table 5. Two aspects of these results should be noted: first, the variabilities (standard deviations) of the coefficients were low. Second, the mean coefficients in the cross-validation were extremely similar to those in the development function (Table 4A); in all cases, the development coefficients lie well within one standard deviation from the mean cross-validation coefficients. This suggested that the cross-validation was testing essentially the same discriminant functions as those created using the development set. Therefore, the cross-validation tested an independent sample (each of the 43 subjects, classified one at a time) with a relatively stable discriminant function that was derived for each individual without using that individual’s data.
Table 5.
Cross-validation: mean linear discriminant function coefficients (SD) using ERP measures for classifying MCI individuals into Progress to AD and Stable groups. Variable names: 3-digit numbers indicate latency (ms) of the ERP component waveform maxima; Rel or Irr indicate relevant or irrelevant stimulus conditions that evoked the ERP.
| Variable | Progress | Stable |
|---|---|---|
| (n=15) | (n=28) | |
| Constant | −1.54(0.31) | −1.25(0.09) |
| C185_Rel | 1.46(0.15) | −0.36 (0.07) |
| C540_Rel | 1.49(0.19) | −1.49(0.20) |
| C415_Rel | −1.62(0.23) | 1.84(0.32) |
| C415_Irr | −0.39(0.31) | −3.34(0.27) |
| C250_Irr | 2.09 (0.70) | −3.05 (0.45) |
| C250_Rel | −2.92 (0.84) | 1.88(0.39) |
| C325_Irr | −1.25(0.28) | 1.04(0.18) |
| C540_Irr | 0.04 (0.24) | 0.90(0.16) |
Note. Means and standard deviations of the coefficients were calculated from the cross-validation where each subject was omitted from creating the discriminant functions. Thus, 43 sets of discriminant coefficients were the data underlying these numbers.
The cross-validation produced slightly lower classification results: 30 of 43 individuals were correctly predicted, resulting in 70% prediction accuracy (Table 6A, using a cut point of 0.50). Given that some subjects with low posterior probabilities of group membership may not have confident predictions and are perhaps “too close to call” (suggesting a cut point of 0.70 for classification), we analyzed the posterior probabilities provided by the cross-validation using only the probable predictions (probable progression and probable stability). The results were improved; disregarding the lowest two probability bins, 25 of the 32 individuals had 78% prediction accuracy in the cross-validation (Table 6B). This suggests that few MCI subjects would be in the “too close to call” category and many (74%) would belong to the probable category.
Table 6.
Cross-validation results for individual MCI subjects belonging to either the Progress group or the Stable group. A. Prediction summary for the cross-validation analysis including all 43 MCI subjects. T+ indicates a positive ERP test result (ERP test predicts MCI progression to AD) and T− indicates a negative ERP test result (ERP test predicts MCI remaining stable). Cut point for classification is 0.50. B. Prediction summary omitting the subjects that were “too close to call” based on their posterior probability of group membership. Cut point for classification is 0.70. The specificity, accuracy, and statistical significance increased when only the probable subjects were considered.
| A. | |||||
|---|---|---|---|---|---|
| MCI Subgroups | T+ | T− | Total | ||
| Progress | 10 | 5 | 15 | Sensitivity: 0.67 | |
| Stable | 8 | 20 | 28 | Specificity: 0.71 | |
| Total | 18 | 25 | 43 | Accuracy: 70% | χ2 = 5.82 (p=0.02)* |
| B. | |||||
|---|---|---|---|---|---|
| MCI Subgroups | T+ | T− | Total | ||
| Progress | 9 | 4 | 13 | Sensitivity: 0.69 | |
| Stable | 3 | 16 | 19 | Specificity: 0.84 | |
| Total | 12 | 20 | 32 | Accuracy: 78% | χ2 = 9.41 (p=0.004)* |
Corrected via Bonferroni’s adjustment for multiple comparisons.
Additionally, a bootstrapping validation approach was performed where the 43 subjects were randomly sorted without replacement into a 15 subject pseudo-Progress group and a 28 subject pseudo-Stable group irrespective of their clinical diagnoses. The two randomized groups were then classified using the discriminant function developed from the eight ERP component_conditions (Table 4A). An average accuracy, sensitivity, and specificity for the development results of 25 iterations of these randomized groups were calculated. The extent to which our original development results (79% accuracy, 0.80 sensitivity, 0.79 specificity) were outliers in this distribution of classification results with pseudo groups is a measure of our discriminant functions’ validity and generalizability relative to a random sampling of subjects. The discriminations of the 25 random samples produced a mean (SD) accuracy of 53.4% (6.8%), a mean sensitivity of 0.42 (0.09), and a mean specificity of 0.58 (0.05). The accuracy obtained in our development results was more than 3.5 SDs above the mean random accuracy. Likewise, our development sensitivity and specificity were more than 4.0 SDs above the mean random sensitivity and specificity.
For a neuropsychological comparison to the ERP measures, we used each subject’s individual MMSE score in a discriminant analysis to determine how well this ubiquitous test of general cognitive ability can predict outcomes. Of the 43 subjects, 28 were predicted correctly (65%, a result that was not statistically significant at the 0.05 level). The sensitivity and specificity dropped to .60 and .68, respectively. Clearly the ERP measures performed better than the MMSE as predictors of individual MCI progression to AD.
While discriminant analysis could be performed more simplistically using a single component_condition, we discovered this produced worse results. In analyzing each of the eight selected component_conditions in separate discriminant analyses where each variable was used individually to classify the 43 MCI subjects, on average, they performed no better than chance (mean(SD) accuracy = 55.0% (6.66%); sensitivity = 0.55 (0.09); specificity = 0.55 (0.06)). The best single component_condition was C185_Rel, which only reached an accuracy of 67%. This was still 12% lower than what the linear combination of these components achieved (Table 4B).
4. Discussion
4.1 ERP components as predictive biomarkers of AD
The ERP components performed with good accuracy, sensitivity, and specificity at predicting which MCI individuals would later develop AD and which would not. Our method benefits from several advantages. First, using a perceptual/cognitive paradigm with memory processing demands (encoding, retrieval) allows assessment of brain functioning related to cognitive processes believed to be affected by AD. This task contains built-in control stimuli (the irrelevant stimuli), and it also manipulates the expectancy of a relevant stimulus. In addition to previous work with this paradigm (Chapman et al., 2007), this study suggests that analyzing ERPs collected at CZ provides a good initial view (due to volume conduction) of the cognitive processes that may be affected by the deterioration seen in early AD and MCI. Second, ERPs have a temporal resolution that is fast enough to maintain pace with neural processing. In analyzing the ERPs, employing a formal multivariate procedure (PCA) is a third advantage as it permits a data-driven approach to measuring ERP components. Fourth, discriminant analysis combines ERP component_conditions in a weighted manner to predict progression to AD in MCI individuals with good success.
Our results are related to some of those reported in the literature. Missonnier et al., 2007 and Olichney et al., 2008 present prediction accuracies for their study of MCI progression with ERPs in the 80–90% range, which roughly agrees with our findings. Additionally, Jelic et al. (2000) used quantitative EEG markers and frequency bands to predict progression to AD with 85% success. Prichep et al. (2006) also reached 86% success in predicting conversion to AD over a longer time (seven years) using quantitative EEG, although only seven of their study group developed AD. Validation of these varied results is warranted.
Finally, another advantage of our method is the posterior probabilities associated with the binary prediction for each individual, which add a quantitative measure of confidence in that prediction. We have not often found these measures used or discussed in the literature on predicting MCI progression in individuals. Featuring the posterior probabilities is important for several reasons. It allows a determination of which subjects may be “too close to call” (e.g., the determination of a cut point of group membership for classification); these subjects, because of their low posterior probabilities (near chance), should be considered indeterminate in their diagnosis. For example, when removing the “too close to call” participants from the cross-validation analysis by adjusting the cut point to 0.70, diagnoses became more realistic as only the probable predictions remained. This is particularly true of the Stable individuals who lie in the “too close to call” range. Seven of the nine individuals in this range for the development set were Stable subjects who may not have been given enough time to progress to clinically defined AD.
Although it is convenient to consider the prediction outcomes to be binary (either the subject developed AD or did not), the posterior probabilities can be considered to measure disease progression. In this case, they create a continuum of progression to AD and an individual is directly placed along this continuum by the discriminant function according to his or her probability of group membership. We believe evaluating the posterior probabilities as we have done is a novel approach that adds value to study of MCI progression to AD because it allows the physician or researcher to both identify the probable predictions in a group of individuals and perhaps measure the stage of progression for each individual. This could aid a physician in determining the appropriateness of treatment, and it could benefit researchers in selecting participants for their projects about whom they can be confident about the subjects’ group membership.
In general, as is supported in the present work, having separable ERP components permits differential weighting through a formal, data driven procedure that arrived at good classification success for discriminating individuals who progress to AD from those who have not. ERP responses to irrelevant stimuli, as well as to relevant, stimuli were important to discriminating stable MCI individuals from progressive MCI individuals. C185_Rel was our strongest ERP measure for predicting MCI individuals who will progress versus those who remain stable. This relatively early ERP component (maximum near 185 ms poststimulus, Figure 2) is more positive in response to visual stimuli that are relevant to the task. Its amplitude tended to be more positive in MCI individuals who later progress than in MCI individuals who remain stable (Table 3). The larger amplitude in MCI individuals who progress may be indicative of a compensatory stimulus processing effect. Another early ERP component to both relevant and irrelevant stimuli with discriminatory power was C250, peaking at 250 ms poststimulus. C250 is an ERP component that we previously discovered in this Number-Letter paradigm and called the memory “storage” component, because it has larger amplitudes when a stimulus is stored in short-term memory as subsequently assessed by a behavioral memory probe technique (Chapman et al., 1978; Chapman et al., 1981). The C415 component, with a positive maximum at 415 ms poststimulus, has been shown with this type of paradigm to be larger in response to stimuli that are task relevant in normal adults and parietally loaded (Chapman, 1965; Chapman and Bragdon, 1964; Chapman et al., 1978; Chapman et al., 1981). Those MCI who progress tended to have less positive C415 to relevant stimuli than the stable MCI individuals (Table 3), implying that difficulty in differentiating and processing relevant and irrelevant stimuli, or possibly context-updating (Donchin, 1981), may be indicative of AD-like cognitive decline.
There are limitations to our present work that require further research. Clinical follow-ups were conducted approximately one to two years after the initial diagnosis and collection of our ERP data. More time is required to determine how accurate the predictions could be and how far in advance a prediction might hold. One might argue that some of the individuals clinically diagnosed as MCI were really early AD at baseline (though not recognized by the memory-disorders physicians). However, even if that were true, it is clear that all of those later clinically diagnosed as AD (the Progress group) had sufficient clinical deterioration to have had their diagnoses changed and thus would satisfy a “deterioration” criterion that marks the Progress individuals as different from the Stable individuals at follow-up. Our present data lack the statistical power to determine the influence of time on our results, though work by others (Jelic et al., 2000) suggests inclusion of time in prediction models does not improve predictive accuracy. Our discrimination results warrant further, direct validation with a greater number of subjects. Additionally, the model we present here is effective but likely could be improved further by adding additional or more refined variables. While we believe this is an important first step, we have started with a relatively sparse model with a desire to limit the number of variables in the discriminant analyses in order not to overreach the degrees of freedom. Systematic latency differences in ERP components could appear in the PCA component structure (discussed in Chapman and McCrary, 1995). Spatial information provided by additional electrodes would be of interest when larger samples are available. Finally, how our ERP biomarkers relate to other predictors of MCI progression to AD (including neuropsychological test performance) remains to be determined. Further work is necessary to determine the additive value of ERP measures in a clinical setting, but there are several reasons that these measures might improve MCI and AD assessment. First, ERPs more directly measure brain functions than neuropsychological testing and anatomical brain scanning. Second, ERPs have a high temporal resolution (milliseconds). ERPs also can measure underlying processes in a noninvasive, less costly manner. Studying brain responses in this way may reveal information that behavioral and some other biologic measures cannot. Finally, measures to irrelevant stimuli are easier to obtain and are shown in the present work to be important to classifying AD.
5. Conclusion
We believe this is the first report that utilizes formal multivariate analyses to measure separable ERP components obtained while individuals perform a task and to combine these ERP measures in a weighted and cross-validated way to predict with associated probabilities which MCI individuals will progress to AD in the future and which will remain stable. In addition to a binary prediction for each individual, the associated posterior probability offers a quantitative context that allows an estimation of confidence. This estimation was validated by the empirically obtained prediction accuracies rising to 94% when the computed posterior probabilities for individuals was 0.90 or higher (which was found for 40% of our MCI sample). Such a quantitative biomarker warrants greater study and could be useful to early treatment, as well as to elucidating understanding the progression from MCI to AD.
Acknowledgments
We thank: Anton Porsteinsson, the Geriatric Neurology and Psychiatry Clinic, University of Rochester Medical Center, Monroe Community Hospital, the Alzheimer’s Disease Center, especially Charles Duffy and Roger Kurlan, for their strong support of our research; Robert Emerson and William Vaughn for their technical contributions; Rafael Klorman for critical discussions; Harry Reis for statistical consultations; our undergraduate assistants (Courtney Vargas, Dustina Holt, Cendrine Robinson, Jonathan DeRight, Anna Fagan, Kristen Morie, Brittany Huber, Leon Tsao, and Michael Garber-Baron); and the many voluntary participants in this research. This research was supported by the National Institute of Health grants P30-AG08665, R01-AG018880, and P30-EY01319.
Footnotes
Publisher's Disclaimer: This is a PDF file of an unedited manuscript that has been accepted for publication. As a service to our customers we are providing this early version of the manuscript. The manuscript will undergo copyediting, typesetting, and review of the resulting proof before it is published in its final citable form. Please note that during the production process errors may be discovered which could affect the content, and all legal disclaimers that apply to the journal pertain.
Disclosure Statement
No author involved with this article had any conflicts of interest regarding this research. Our study received IRB approval from the University of Rochester Research Subjects Review Board, and informed consent was obtained for each subject.
References
- Achim A, Marcantoni W. Principal component analysis of event-related potentials: misallocation of variance revisited. Psychophysiol. 1997;34:597–606. doi: 10.1111/j.1469-8986.1997.tb01746.x. [DOI] [PubMed] [Google Scholar]
- Ahlgren A. Multivariate Analysis. Science. 1986;234:530–531. doi: 10.1126/science.234.4776.530. [DOI] [PubMed] [Google Scholar]
- American Psychiatric Association. Diagnostic and statistical manual of mental disorders. Fourth ed., text rev. Washington, DC: Author; 2000. [Google Scholar]
- Beauducel A, Debener S. Misallocation of variance in event-related potentials: simulation studies on the effects of test power, topography, and baseline-to-peak versus principal component quantifications. J. Neurosci. Methods. 2003;124:103–112. doi: 10.1016/s0165-0270(02)00381-3. [DOI] [PubMed] [Google Scholar]
- Begleiter H, Porjesz B, Wang W. A neurophysiologic correlate of visual short-term memory in humans. Electroencephal. Clin. Neurophysiol. 1993;87:46–53. doi: 10.1016/0013-4694(93)90173-s. [DOI] [PubMed] [Google Scholar]
- Begleiter H, Porjesz B, Wang W. Event-related brain potentials differentiate priming and recognition to familiar and unfamiliar faces. Electroencephal. Clin. Neurophysiol. 1995;94:41–49. doi: 10.1016/0013-4694(94)00240-l. [DOI] [PubMed] [Google Scholar]
- Benedict RHB, Groninger L. Preliminary standardization of a new visuospatial memory tests with six alternate forms. Clin. Neuropsychol. 1995;9:11–16. [Google Scholar]
- Benton AL, Hamsher KS. Multilingual Aphasia Examination. Iowa City: University of Iowa; 1976. [Google Scholar]
- Blessed G, Tomlinson BE, Roth M. The association between quantitative measures of dementia and of senile change in cerebral grey matter of elderly subjects. Brit. J. Psych. 1968;114:797–811. doi: 10.1192/bjp.114.512.797. [DOI] [PubMed] [Google Scholar]
- Brandt J. The Hopkins Verbal Learning Test: development of a memory test with six equivalent forms. Clin. Neuropsychol. 1991;5:125–142. [Google Scholar]
- Brayne C. The elephant in the room - healthy brains in later life, epidemiolog and public health. Nat. Rev. Neuroscience. 2007;8:233–239. doi: 10.1038/nrn2091. [DOI] [PubMed] [Google Scholar]
- Chapman RM. Evoked responses to relevant and irrelevant visual stimuli while problem solving. Proc. Am. Psych. Assoc. 1965:177–178. [Google Scholar]
- Chapman RM. Discussion of the specification of psychological variables in an averaged evoked potential experiment. In: Donchin E, Lindsley DB, editors. Average Evoked Potentials: Methods, Results, and Evaluations. Washington, D.C.: 1969. pp. 262–275. Government Printing Office, NASA SP-191, [Google Scholar]
- Chapman RM. International Symposium on Cerebral Evoked Potentials in Man, Pre-circulated Abstracts. Brussels: Presses Universitaires de Bruxelles; 1974. Hemispheric differences in average evoked potentials to relevant and irrelevant visual stimuli; pp. 45–46. [Google Scholar]
- Chapman RM, Bragdon HR. Evoked responses to numerical and non-numerical visual stimuli while problem solving. Nature. 1964;203:1155–1157. doi: 10.1038/2031155a0. [DOI] [PubMed] [Google Scholar]
- Chapman RM, McCrary JW. Hemispheric differences in evoked potentials to relevant and irrelevant visual stimuli. In: Callaway E, Lehmann D, editors. Event Related Potentials in Man: Applications and Problems. New York: Plenum Press; 1979. pp. 55–68. [Google Scholar]
- Chapman RM, McCrary JW. EP component identification and measurement by principal components analysis. Brain and Cog. 1995;27:288–310. doi: 10.1006/brcg.1995.1024. [DOI] [PubMed] [Google Scholar]
- Chapman RM, McCrary JW, Bragdon HR, Chapman JA. Latent components of event-related potentials functionally related to information processing. In: Desmedt JE, editor. Cognitive Components in Cerebral Event-Related Potentials and Selective Attention: Vol. 6. Prog. Clin. Neurophysiol. Basel: Karger; 1979. pp. 80–105. [Google Scholar]
- Chapman RM, McCrary JW, Chapman JA. Short-term memory: the “storage” component of human brain responses predicts recall. Science. 1978;15:1211–1214. doi: 10.1126/science.725596. [DOI] [PubMed] [Google Scholar]
- Chapman RM, McCrary JW, Chapman JA. Memory processes and evoked potentials. Can. J. Psychol. 1981;35:201–212. doi: 10.1037/h0081152. [DOI] [PubMed] [Google Scholar]
- Chapman RM, Nowlis GH, McCrary JW, Chapman JA, Sandoval TC, Guillily MD, Gardner MN, Reilly LA. Brain event-related potentials: Diagnosing early-stage Alzheimer’s disease. Neurobiol. Aging. 2007;28:194–201. doi: 10.1016/j.neurobiolaging.2005.12.008. [DOI] [PMC free article] [PubMed] [Google Scholar]
- Dien J. Addressing misallocation of variance in principal components analysis of event-related potentials. Brain Topogr. 1998;11:43–55. doi: 10.1023/a:1022218503558. [DOI] [PubMed] [Google Scholar]
- Dien J, Beal DJ, Berg P. Optimizing principal components analysis of event-related potentials: Matrix type, factor loading weighting, extraction, and rotations. Clin. Neurophysiol. 2005;116:1808–1825. doi: 10.1016/j.clinph.2004.11.025. [DOI] [PubMed] [Google Scholar]
- Donchin E. Presidential address, 1980. Surprise!… Surprise? Psychophysiology. 1981;18:493–513. doi: 10.1111/j.1469-8986.1981.tb01815.x. [DOI] [PubMed] [Google Scholar]
- Düzel E, Yonelinas AP, Mangun GR, Heinze HJ, Tulving E. Event-related brain potential correlates of two states of conscious awareness in memory. Proc. Natl. Acad. Sci. USA. 1999;96:1794–1799. doi: 10.1073/pnas.94.11.5973. [DOI] [PMC free article] [PubMed] [Google Scholar]
- Fabrigar LR, MacCallum RC, Wegener DT, Stahan EJ. Evaluating the use of exploratory factor analysis in psychological research. Psycholog. Meth. 1999;4:272–299. [Google Scholar]
- Farah MJ, Peronnet F, Gonon MA, Girard MG. Electrophysiological evidence for a shared representational medium for visual images and visual percepts. J. Exper. Psychol.: General. 1988;117:248–257. doi: 10.1037//0096-3445.117.3.248. [DOI] [PubMed] [Google Scholar]
- Folstein MF, Folstein SE, McHugh PR. “Mini-mental state”. A practical method for grading the cognitive state of patients for the clinician. J. Psychiatr. Res. 1975;12:189–198. doi: 10.1016/0022-3956(75)90026-6. [DOI] [PubMed] [Google Scholar]
- Friedman D, Vaughan HG, Jr, Erlenmeyer-Kimling L. Multiple late positive potentials in two visual discrimination tasks. Psychophysiol. 1981;18:635–649. doi: 10.1111/j.1469-8986.1981.tb01838.x. [DOI] [PubMed] [Google Scholar]
- Golden CJ. Stroop Color and Word Test: a manual for clinical and experimental uses. Chicago: Stoelting; 1978. [Google Scholar]
- Grober E, Sliwinski M. Development and validation of a model for estimating premorbid verbal intelligence in the elderly. J. Clin. Exper. Neuropsych. 1991;13:933–949. doi: 10.1080/01688639108405109. [DOI] [PubMed] [Google Scholar]
- Hagen GF, Gatherwright JR, Lopez BA, Polich J. P3a from visual stimuli: task difficulty effects. Int. J. Psychophysiol. 2006;59:8–14. doi: 10.1016/j.ijpsycho.2005.08.003. [DOI] [PubMed] [Google Scholar]
- Hickie C, Snowdon J. Depression scales for the elderly: GDS, Gilleard, Zung. Clin. Gerontol. 1987;6:51–53. [Google Scholar]
- Hora SC, Wilcox JB. Estimation of error rates in several-population discriminant analysis. J. Market Res. 1982;XIX:57–61. [Google Scholar]
- Ingelfinger JA, Mosteller F, Thibodeau LA, Ware JH. Biostatistics in Clinical Medicine. New York: Macmillan Pub. Co.; 1983. [Google Scholar]
- Jelic V, Johansson SE, Almkvist O, Shigeta M, Julin P, Nordberg A, Winblad B, Wahlund LO. Quantitative electroencephalography in mild cognitive impairment: longitudinal changes and possible prediction of Alzheimer’s disease. Neurobio. Aging. 2000;21:533–540. doi: 10.1016/s0197-4580(00)00153-6. [DOI] [PubMed] [Google Scholar]
- John ER, Easton P, Prichep LS, Friedman J. Standardized varimax descriptors of event-related potentials: basic considerations. Brain Topogr. 1993;6:143–162. doi: 10.1007/BF01191080. [DOI] [PubMed] [Google Scholar]
- Johnson RA, Wichern DW. Applied Multivariate Statistical Analysis. Fifth Ed. New York: Apprentice-Hall; 2002. [Google Scholar]
- Kaplan EF, Goodglass H, Weintraub S. The Boston Naming Test. Philadelphia: Lea and Febiger; 1978. [Google Scholar]
- Kayser J, Tenke CE. Trusting in or breaking with convention: Towards a renaissance of principal components analysis in electrophysiology. Clin. Neurophysiol. 2005;116:1747–1753. doi: 10.1016/j.clinph.2005.03.020. [DOI] [PubMed] [Google Scholar]
- Lachenbruch PA. Discriminant Analysis. New York: Hafner Press; 1975. [Google Scholar]
- Mack WJ, Freed DM, Williams BW, Henderson VW. Boston Naming Test: Shortened versions for use in Alzheimer’s disease. J. Gerontol. Psychol. Sci. 1992;47:154–158. doi: 10.1093/geronj/47.3.p154. [DOI] [PubMed] [Google Scholar]
- McKhann G, Drachman D, Folstein M, Katzman R, Price D, Stadlan EM. Clinical diagnosis of Alzheimer’s disease: report of the NINCDS-ADRDA Work Group under the auspices of Department of Health and Human Services Task Force on Alzheimer’s disease. Neurology. 1984;34:939–944. doi: 10.1212/wnl.34.7.939. [DOI] [PubMed] [Google Scholar]
- Missonnier P, Deiber MP, Gold G, Herrmann FR, Millet P, Michon A, Fazio-Costa L, Ibáñez V, Giannakopoulos P. Working memory load-related electroencephalographic parameters can differentiate progressive from stable mild cognitive impairment. Neuroscience. 2007;150:346–356. doi: 10.1016/j.neuroscience.2007.09.009. [DOI] [PubMed] [Google Scholar]
- Missonnier P, Gold G, Fazio-Costa L, Michel JP, Mulligan R, Michon A, Ibáñez V, Giannakopoulos P. Early event-related potentials changes during working memory activation predict rapid decline in mild cognitive impairment. J. Gerontol. A Biol. Sci. 2005;60:660–666. doi: 10.1093/gerona/60.5.660. [DOI] [PubMed] [Google Scholar]
- Missonnier P, Gold G, Leonards U, Fazio-Costa L, Michel JP, Ibáñez V, Giannakopoulos P. Aging and working memory: early deficits in EEG activation of posterior cortical areas. J. Neural Trans. 2004;111:1141–1154. doi: 10.1007/s00702-004-0159-2. [DOI] [PubMed] [Google Scholar]
- Missonnier P, Leonards U, Gold G, Palix J, Ibáñez V, Giannakopoulos P. A new electrophysiological index for working memory load in humans. Neuroreport. 2003;14:1451–1455. doi: 10.1097/00001756-200308060-00009. [DOI] [PubMed] [Google Scholar]
- Money JA. A Standardized Road Map of Directional sense, manual. San Rafael: Academic Therapy Publications; 1976. [Google Scholar]
- Olichney JM, Morris SK, Ochoa C, Salmon DP, Thal LJ, Kutas M, Iraqui VJ. Abnormal verbal event-related potentials in mild cognitive impairment and incipient Alzheimer’s disease. J. Neurol. Neurosurg. Psychiatry. 2002;73:377–384. doi: 10.1136/jnnp.73.4.377. [DOI] [PMC free article] [PubMed] [Google Scholar]
- Olichney JM, Taylor JR, Gatherwright J, Salmon DP, Bressler AJ, Kutas M, Iraqui-Madoz VJ. Patients with MCI and N400 or P600 abnormalities are at very high risk for conversion to dementia. Neurology. 2008;70:1763–1770. doi: 10.1212/01.wnl.0000281689.28759.ab. [DOI] [PMC free article] [PubMed] [Google Scholar]
- Osterrieth PA. Le test de copie d’une figure complexe. Archives de Psychologie. 1944;30:206–356. [Google Scholar]
- Petersen RC. Mild cognitive impairment as a diagnostic entity. J. Intern. Med. 2004;256:183–194. doi: 10.1111/j.1365-2796.2004.01388.x. [DOI] [PubMed] [Google Scholar]
- Petersen RC, Smith GE, Waring SC, Ivnik RJ, Tangalos EG, Kokmen E. Mild Cognitive Impairment: Clinical Characterization and Outcome. Arch. Neurol. 1999;56:303–308. doi: 10.1001/archneur.56.3.303. [DOI] [PubMed] [Google Scholar]
- Petersen RC, Stevens JC, Ganguli M, Tangalos EG, Cummings JL, DeKosky ST. Practice parameters: Early detection of dementia: Mild cognitive impairment (an evidence-based review). Report on the Quality Standards Subcommittee of the American Academy of Neurology. Neurology. 2001;56:1133–1142. doi: 10.1212/wnl.56.9.1133. [DOI] [PubMed] [Google Scholar]
- Picton TW, Bentin S, Berg P, Donchin E, Hillyard SA, Johnson R, Jr, Miller GA, Ritter W, Ruchkin DS, Rugg MD, Taylor MJ. Committee Report. Guidelines for using human event-related potentials to study cognition: Recording standards and publication criteria. Psychophys. 2000;37:127–152. [PubMed] [Google Scholar]
- Prichep LS, John ER, Ferris SH, Rausch L, Zang F, Cancro R, Torossian C, Reisberg B. Prediction of longitudinal cognitive decline in normal elderly with subject complaints using electrophysiological imaging. Neurobio. Aging. 2006;27:471–481. doi: 10.1016/j.neurobiolaging.2005.07.021. [DOI] [PubMed] [Google Scholar]
- Reitan RM. Validity of the Trail Making test as an indicator of organic brain damage. Percept. Motor Skills. 1958;8:271–276. [Google Scholar]
- Rey A. L’examin psychologique dans les cas d’escephalopathie traumatique. Archives de Psychologie. 1941;28:286–340. [Google Scholar]
- Rey A. L’examen Clinique en Psychologie. Paris: Presses Universitaires de France; 1964. [Google Scholar]
- SAS OnlineDoc 9.1.3. Cary: SAS Institute Inc.; 2007. [On-line]. Available: http://support.sas.com/. [Google Scholar]
- Shaffer JP. Multiple hypothesis testing. Annu. Rev. Psychol. 1995;46:561–584. [Google Scholar]
- Tabachnick BG, Fidell LS. Using Multivariate Statistics. Fourth Ed. Boston: Allyn and Bacon; 2001. [Google Scholar]
- Taylor EM. Psychological Appraisal of Children with Cerebral Deficits. Cambridge: Harvard University Press; 1959. [Google Scholar]
- Tuokko H, Hadjistavropoulos T, Miller JA, Beattie BL. The clock test: a sensitive measure to differentiate normal elderly from those with Alzheimer’s disease. J. Am. Geriat. Soc. 1992;40:579–584. doi: 10.1111/j.1532-5415.1992.tb02106.x. [DOI] [PubMed] [Google Scholar]
- Walter WG, Cooper R, Aldridge VJ, Mccallum WC, Winter AL. Contingent negative variation: An electric sign of sensorimotor association and expectancy in the human brain. Nature. 1964;203:380–384. doi: 10.1038/203380a0. [DOI] [PubMed] [Google Scholar]
- Wechsler D. A standardized memory scale for clinical use. J. Psychol. 1945;19:87–95. [Google Scholar]
- Wechsler D. Wechsler Memory Scale-Revised. San Antonio, TX: The Psychological Corporation; 1987. [Google Scholar]
- Wechsler D. Wechsler Adult Intelligence Scale-III (WAIS-III) manual. New York: The Psychological Corporation; 1997. [Google Scholar]
- Wood CC, McCarthy G. Principal component analysis of event-related potentials: simulation studies demonstrate misallocation of variance across components. Electroencephalogr. Clin. Neurophysiol. 1984;59:249–260. doi: 10.1016/0168-5597(84)90064-9. [DOI] [PubMed] [Google Scholar]
- Yesevage JA, Brink TL, Rose TL, Lum O, Huang V, Adey M, Leirer VO. Development and Validation of a geriatric depression screening scale: A preliminary report. J. Psych. Res. 1983;17:37–49. doi: 10.1016/0022-3956(82)90033-4. [DOI] [PubMed] [Google Scholar]