

Abstract
Objectives
The number of HIV-infected patients receiving orthotopic liver transplantation (OLTX) is increasing. One major challenge is the severe drug–drug interactions between immunosuppressive drugs such as tacrolimus and ritonavir-boosted HIV-1 protease inhibitors (PIs). The introduction of raltegravir, which is not metabolized by the cytochrome system, may allow concomitant treatment without dose adaptation.
Patients and methods
We conducted a retrospective analysis of HIV-1-infected patients receiving tacrolimus concomitantly with different HIV therapies, including 12 h pharmacokinetic assessment of drug levels.
Results
Three OLTX patients received a ritonavir-boosted PI therapy when tacrolimus was added at very low doses of 0.06, 0.03 and 0.08 mg daily. Median tacrolimus blood levels were 6.6, 3.0 and 7.9 ng/mL over a follow-up period of 8, 22 and 33 months, respectively. In two other patients (one after OLTX and one with Crohn's disease), a raltegravir-based HIV therapy was started while patients received 1 or 2 mg of tacrolimus twice daily. No tacrolimus dose adjustment was necessary and drug levels remained unchanged.
Conclusions
Decreasing the dose of tacrolimus to 0.03–0.08 mg daily in patients with concomitant boosted PI therapy resulted in stable tacrolimus blood levels without alteration of PI drug levels. Concomitant use of raltegravir and tacrolimus revealed no clinically relevant drug interaction.
Keywords: pharmacokinetics, drug interactions, OLTX, CYP450, FK 506
Introduction
Since the advent of highly active antiretroviral treatment (HAART), the number of HIV-1-infected patients receiving organ transplantation has steadily been increasing. One major clinical challenge is the severe drug–drug interactions between immunosuppressive drugs and antiretroviral agents. Only a few case reports have been published addressing this clinically relevant issue. In all reported cases, severe drug-related toxicity occurred due to excessive drug concentrations resulting from drug–drug interactions. One of these severe interactions was observed between tacrolimus and HIV-1 protease inhibitors (PIs). Both drugs are cornerstones of modern immunosuppressive and HIV-1 therapy, and both are substrates of the cytochrome P-450 3A4 (CYP3A4) system of the liver and the intestinal P-glycoprotein.1–4 In particular, the PI ritonavir primarily inhibits the metabolism of other drugs by CYP3A4 and, to a lesser extent, 2D6 as well as P-glycoprotein. Since all PIs undergo a high first-pass metabolism, ritonavir is usually combined with a second PI to benefit from the resulting booster effect. Thus, the addition of low doses of ritonavir has led to a significant increase in drug exposure, leading to a convenient reduction of PI doses and dosing frequencies.5,6
Tacrolimus has a narrow therapeutic window and has a multitude of side effects, including nephrotoxicity and neurotoxicity, which are dose dependent and usually occur at tacrolimus blood levels of >15 ng/mL.7–9 The usually recommended therapeutic range for tacrolimus is 7–15 ng/mL for the first 3 months after orthotopic liver transplantation (OLTX) and 5–10 ng/mL thereafter.10–12 If no signs of organ rejection occur, the dose can be further reduced. Therefore, the combination of tacrolimus and ritonavir-boosted PI regimens warrants a dramatic tacrolimus dose reduction and close drug monitoring to avoid overdosing and toxicity. In the so far published case reports, single doses of 0.5–1 mg of tacrolimus every 1–3 weeks were given when combined with ritonavir-containing HAART, requiring frequent therapeutic drug monitoring to keep the steady-state drug levels within the therapeutic range.13–17 Here, we present three patient cases who were successfully switched to a very low daily dose of tacrolimus while receiving ritonavir-boosted PI-based HAART.
Recently, the first integrase strand-transfer inhibitor, raltegravir, was licensed for treatment of HIV-1 infection and is characterized by a lack of clinically significant drug interactions as compared with the PIs.18 Here, we also present two further patient cases in which we demonstrate a lack of a clinically significant drug interaction between raltegravir and tacrolimus.
Patients and methods
The reported patients were all treated in two German university HIV centres (Frankfurt and Bonn). All data were retrospectively collected. This report comprises a clinical observation of treatment outcome outside a study protocol; therefore, ethics committee approval is not applicable. However, all patients gave oral and written consent to publish their data. All data, including the pharmacokinetic assessments, were generated as part of the routine patient assessment during regular patient management.
Pharmacokinetic assessment
After ≥2 weeks on stable HIV therapy, patients underwent a pharmacokinetic assessment following a standardized protocol under steady-state conditions, which is part of the clinical routine when a drug–drug interaction is suspected. On the day of the pharmacokinetic assessment, fasting trough levels were obtained immediately before drug intake, followed by a standardized hospital breakfast of ∼2500 kJ (25% from fat). Plasma samples were then collected at 1, 2, 4, 6, 9 and 12 h after the drug intake. Pharmacokinetic assay and evaluation of saquinavir, lopinavir, darunavir, ritonavir and raltegravir plasma concentrations were measured by validated high-pressure liquid chromatography–tandem mass spectrometry methods (equipment from Merck–Hitachi, Germany and Applied Biosystems, Canada). Reference values for these drugs were taken from the original prescribing information of the respective manufacturer. The reliable lower limit of quantification (LLQ) was 20 ng/mL and the linearity of the calibration curve for all tested compounds was proven up to 20 000 ng/mL. Pharmacokinetic calculations were based on plasma concentrations that exceeded the LLQ. The Cmin and Cmax values of the non-compartmental analysis represent the lowest and the highest plasma drug concentrations observed over the standard 12 h dosing interval, and were read directly from the plasma concentration–time curves of saquinavir, lopinavir, ritonavir and raltegravir within the standard dosing interval (τ = 0–12 h). The area under the plasma concentration–time curve (AUC) (τ) was calculated by using the log-trapezoidal rule within a non-compartmental analysis module. To compare some of the results with the referenced AUC0–24 values, the AUC0–12 was doubled when needed.
Tacrolimus blood concentration was determined from EDTA whole blood samples by Microparticle Enzyme Immunoassay using an IMx Analyzer (Abbott Laboratories, Abbott Park, IL, USA).
Tacrolimus pills
For Cases 1–3, tacrolimus was mixed and diluted with lactose monohydrate to reach the desired strength and packed in empty hard gelatin capsule shells by a pharmacist. For example, for the 0.06 mg strength, 3 mg of tacrolimus was mixed with 6000 mg of lactose monohydrate, pestled and 120 mg of the mixture filled into the empty hard gelatin capsule shells, standard size 3 (15.4 × 5.6 mm with a volume of 0.25 mL).
Results
Case 1
A 45-year-old HIV/hepatitis B virus (HBV) co-infected male, CDC stage B3, underwent OLTX in 2008 because of end-stage liver disease (ESLD). The CD4 cell count prior to OLTX was 175 cells/mm3 and the HIV-RNA PCR was <50 copies/mL. After OLTX, HIV therapy was restarted with a double-boosted PI regimen (1000 mg of saquinavir, 400 mg of lopinavir and 100 mg of ritonavir, all twice daily) plus two nucleos(t)ide reverse transcriptase inhibitors (NRTIs) (245 mg of tenofovir once daily and 150 mg of lamivudine twice daily). HBV reinfection was successfully prevented by hepatitis B immunoglobulin and the NRTIs. Immunosuppressive therapy was started with 500 mg of mycophenolate mofetil twice daily and 4 mg of corticosteroids once daily. Tacrolimus was then given as a single dose of 0.5 mg every 9–21 days, according to the blood levels. The median tacrolimus concentration was 5.4 ng/mL (min., 4.9 ng/mL; max., 10.7 ng/mL), but the patient frequently attended outpatient care for monitoring of tacrolimus blood concentrations. A subsequent 12 h pharmacokinetic analysis showed a sharp increase in tacrolimus drug levels after a 0.5 mg single dose (Figure 1a) with PI plasma concentrations revealing unfavourable profiles. The saquinavir AUC0–12 was lower than expected (9980 ng·h/mL; reference value, 14 607 ng·h/mL). In contrast, the lopinavir AUC0–12 was 194 000 ng·h/mL (reference value, 82 800 ng·h/mL), which was very high with only a single timepoint below the recommended Cmax. Only the ritonavir AUC0–12 (5530 ng·h/mL) was within the expected range (reference value, 6200 ng·h/mL).
Figure 1.

Tacrolimus blood levels during 12 or 24 h pharmacokinetic assessment in patients concomitantly treated with different types of HIV therapies. (a) Case 1 was treated with ritonavir, saquinavir and lopinavir when receiving a single dose of 0.5 mg of tacrolimus every 2 weeks (circles) and at a later timepoint with 0.06 mg of tacrolimus once daily (squares). (b) Two patients were treated with 400 mg of raltegravir and 1 mg (squares, Case 4) or 2 mg (circles, Case 5) of tacrolimus, all given twice daily. (c) Case 3 was treated with ritonavir, darunavir and tacrolimus (0.01 mg in the morning and 0.02 mg in the evening). The horizontal lines show the lower and upper limits of the therapeutic range of tacrolimus blood concentrations, from 5 to 10 ng/mL.
Aiming to reduce the high variability of tacrolimus blood concentrations and to normalize PI concentrations, the patient was switched to a very low daily dose of tacrolimus, starting with 0.02 mg once daily, which had to be slowly increased to 0.06 mg once daily (∼1% of the usual daily dose). When, finally, tacrolimus was dosed at 0.06 mg once daily, the median tacrolimus blood concentration was 6.6 ng/mL (min., 4.2 ng/mL; max., 10.9 ng/mL) during the 6 months of follow-up (Figure 2a). A second 12 h pharmacokinetic analysis was done, showing a subsequently smoothened tacrolimus time–concentration (Figure 1a) and plasma concentrations much closer to the recommended therapeutic range for all three PIs—the saquinavir concentration increased by >2-fold (AUC0–12 23 470 ng·h/mL), the lopinavir concentration decreased by 45% (AUC0–12 105 200 ng·h/mL) and the ritonavir levels remained more or less unchanged (AUC0–12 6120 ng·h/mL).
Figure 2.
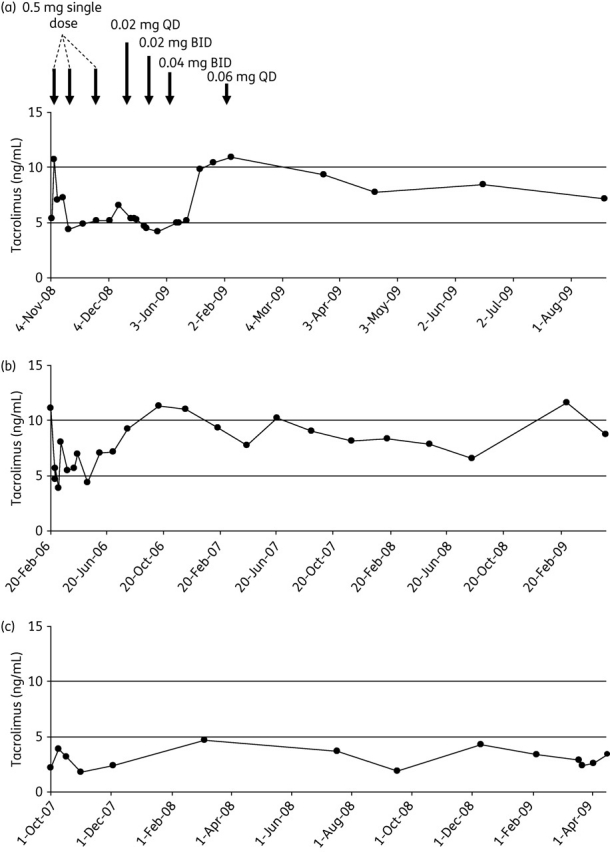
Graphs show tacrolimus trough levels from three patients after orthotopic liver transplant, treated with: (a) 0.06 mg of tacrolimus once daily (unless otherwise indicated) with ritonavir, lopinavir and saquinavir; (b) 0.08 mg of tacrolimus once daily with ritonavir and fosamprenavir; or (c) 0.03 mg of tacrolimus daily with ritonavir and darunavir. The horizontal lines show the lower and upper limits of the therapeutic range of tacrolimus blood concentrations, from 5 to 10 ng/mL. QD, once daily; BID, twice daily.
Case 2
A 34-year-old HIV/hepatitis C virus (HCV) co-infected male, CDC stage A3, underwent OLTX in 2004 because of ESLD. With a triple NRTI therapy (zidovudine, abacavir and tenofovir in standard doses), the HIV-RNA PCR was undetectable. Sustained virological response could be achieved for hepatitis C reinfection with pegylated interferon-α, ribavirin and amantadine. Acute graft rejection was observed 4 and 17 months after OLTX, and was successfully treated with high-dose prednisone. Following the second acute graft rejection, cyclosporine A was replaced by tacrolimus (3 mg once daily) while mycophenolate mofetil (1000 mg twice daily) and prednisone were continued. Because of elevated aminotransferases, zidovudine was replaced by ritonavir-boosted (100 mg twice daily) fosamprenavir (700 mg twice daily) in 2006. After excessive tacrolimus blood concentrations occurred (up to 140 ng/mL), the tacrolimus dose was reduced to 0.08 mg once daily. Thereafter, the median tacrolimus drug level was 7.9 ng/mL (min., 4.7 ng/mL; max., 11.6 ng/mL) during the 33 months of follow-up (Figure 2b). No further graft rejection occurred and the aminotransferase values decreased, although they never returned to normal levels. The last available CD4 cell count was 319 cells/mm3 and the HIV-RNA PCR remained below the limit of detection.
Case 3
A 44-year-old HIV/HCV co-infected patient, CDC status C3, underwent OLTX in 2002 because of ESLD. Hepatitis C reinfection was successfully treated with pegylated interferon-α and ribavirin. A double ritonavir-boosted PI regimen (1000 mg of saquinavir, 400 mg of lopinavir and 100 mg of ritonavir, all twice daily) plus lamivudine (150 mg twice daily) was started. Immunosuppressive therapy consisted of cyclosporine A, mycophenolate mofetil (1500 mg daily) and prednisone for induction. Due to suspected nephrotoxicity, cyclosporine A was replaced by tacrolimus at a very low dose of 0.02 mg twice daily. In 2007, saquinavir and lopinavir were replaced by darunavir (600 mg twice daily), because of hypertriglyceridaemia. With the application of a tacrolimus dose of 0.01 mg in the morning and 0.02 mg in the evening, tacrolimus blood concentrations remained stable, exhibiting a median tacrolimus blood concentration of 3.05 ng/mL (min., 1.8 ng/mL; max., 4.7 ng/mL) during 22 months of follow-up (Figures 1c and 2c). Both the darunavir AUC0–24 (131 190 ng·h/mL; reference value, 11 163 ng·h/mL) and the ritonavir AUC0–12 (6835 ng·h/mL; reference value, 6200 ng·h/mL) were well within the expected range. The latest CD4 cell count was 739 cells/mm3, HIV-RNA PCR remained below the limit detection and no rejection occurred.
Case 4
A 60-year-old HIV/HBV co-infected male, CDC stage A2, underwent OLTX in 2007 because of hepatocellular carcinoma. The CD4 cell count was 380 cells/mm3, the patient was naive to HIV treatment and the HBV infection seroconverted before OLTX. Following OLTX, immunosuppression was started with 1 mg of tacrolimus twice daily, 500 mg of mycophenolate mofetil twice daily and 4 mg of corticosteroids once daily. At the same time, HAART was started with a triple NRTI therapy (245 mg of tenofovir once daily, 150 mg of lamivudine and 300 mg of zidovudine both twice daily), requiring no dose adjustment of tacrolimus. The median tacrolimus drug level was 7.35 ng/mL (min., 5.1 ng/mL; max., 13.2 ng/mL) during 30 months of follow-up. Thirty months after OLTX, serum creatinine increased up to 1.4 mg/dL and, because of suspected nephrotoxicity, tenofovir was replaced by the integrase strand-transfer inhibitor raltegravir at a dose of 400 mg twice daily. The tacrolimus dose remained unchanged and the blood concentration remained in the desired range without signs of a significant drug–drug interaction. During the following 12 months after switching the HIV therapy, the median tacrolimus level was 6.9 ng/mL (min., 5 ng/mL; max., 14.1 ng/mL) during 5 months of follow-up. Figure 1(b) shows a 12 h pharmacokinetic assessment of tacrolimus at steady state during concomitant raltegravir intake. Raltegravir plasma concentrations were within the expected range (AUC0–12 21 989 ng·h/mL; reference value, 14 300 ng·h/mL).
Case 5
A 45-year-old HIV-1-infected patient with severe progressive Crohn's disease, who had developed osteoporosis with secondary fractures while on long-term corticosteroids. Immunosuppressive treatment with tacrolimus was started at 2 mg twice daily as a salvage regimen for Crohn's disease, while the patient was on 400 mg of raltegravir twice daily, 245 mg of tenofovir and 200 mg of emtricitabine both once daily. The median tacrolimus blood concentration was 7.7 ng/mL (min., 4.8 ng/mL; max., 12.9 ng/mL) during 4 months of follow-up (Figure 1b shows the 12 h pharmacokinetic assessment of tacrolimus). The 12 h pharmacokinetic assessment of raltegravir plasma concentrations exhibited an exposure and raltegravir levels within the expected range (AUC0–12 16 754 ng·h/mL; reference value, 14 300 ng·h/mL).
Discussion
In the past, data on drug–drug interactions between ritonavir and tacrolimus were scarce and dosing recommendations are derived from a few published cases.13–17 The reported data suggest the use of a single dose of 0.5–1 mg of tacrolimus every 1–3 weeks when taken together with ritonavir-containing HAART. However, this approach requires intensive therapeutic drug monitoring of both immunosuppressants and HAART, in order to define the optimum timepoint for the next dose and to achieve a steady state within the therapeutic range. Jain et al.13 reported multiple tacrolimus blood concentration peaks within the 24 h dosing interval following a single dose of 1 mg of tacrolimus taken together with ritonavir-boosted lopinavir. This implies that the pharmacological interaction is more complex than assumed; the reason for this finding is as yet unknown. In the 12 h pharmacokinetic assessment of Case 3, we also found a second peak during the dosing interval, although the fluctuation of blood levels seemed to be only marginal. In Case 1, however, we did not observe a second peak, but this patient was treated with two ritonavir-boosted PIs and, since ritonavir, saquinavir, lopinavir and tacrolimus are all metabolized by CYP3A4, the interaction is possibly even more complex.
In Cases 1–3, tacrolimus was given at very low daily doses (0.03–0.08 mg), resulting in stable tacrolimus blood levels over time within the desired range. The AUC0–24 as well as the Tmax of tacrolimus decreased after switching from the single dose to the daily dosing schedule in Case 1. The shape of the tacrolimus time–concentration curve appeared more similar to that of the patients receiving raltegravir after the switch. Moreover, the PI plasma concentrations in Case 1 normalized after switching from a single 0.5 mg dose every 1–2 weeks to a 0.06 mg daily dosing schedule. Teicher et al.17 reported on lopinavir and ritonavir drug levels within the expected range, when tacrolimus was co-administered every 7–21 days, although it was not mentioned if the pharmacokinetic assessment was conducted on the day of or on the day after tacrolimus intake. It may be assumed that with decreasing tacrolimus blood concentrations in between intakes, the extent of interaction with PIs decreases accordingly.
Cases 4 and 5 were started on tacrolimus while being treated with raltegravir. The tacrolimus exposure remained unchanged thereafter. The probable reason for that is the metabolism of raltegravir via glucuronidation, mainly through UDP-glucuronosyltransferases (UGT 1A1 and 2B7) and not by CYP3A4 isoenzymes.18 Raltegravir is now licensed for use in first-line or salvage therapies and the absence of clinically relevant drug–drug interactions makes it a very attractive candidate for HIV therapy, especially for patients requiring co-medication. Nevertheless, switching patients successfully treated with a ritonavir-boosted PI was associated with a slightly higher risk for virological failure in a recently published study.19
The AUC0–12 values for raltegravir reported in Cases 4 and 5 were within the expected range, when tacrolimus was co-administered at standard doses. However, it remains unknown whether the AUC0–12 of raltegravir correlates with the long-term virological response to HAART, so these findings may be of only limited clinical relevance. In a retrospective French case series of 13 HIV-infected solid organ recipients receiving raltegravir and tacrolimus, no signs of a relevant drug–drug interaction, virological failure or rejection occurred, but intensive pharmacokinetic sampling was not performed.20 Our findings are well in agreement with this investigation by Tricot et al.20 and we can demonstrate a lack of alterations of plasma concentrations over the 12 h dosing period when combined with standard doses of tacrolimus.
None of our patients developed virological failure or signs of organ rejection after switching to a very low daily dose of tacrolimus, although the follow-up of these patients is still limited. When combined with ritonavir, very low daily doses of tacrolimus (0.03–0.08 mg/day) resulted in stable tacrolimus blood and PI plasma concentrations within the accordingly therapeutic ranges. In two patients, tacrolimus was safely co-administered with raltegravir-based HAART without revealing a clinically relevant drug–drug interaction.
Funding
This study was investigator-initiated and the study was independent of pharmaceutical companies. No money or grant was utilized; all investigations were conducted as part of routine clinical work.
Transparency declarations
M. B. and N. v. H. have served as consultants and received institutional research grants from Gilead, GlaxoSmithKline, Boehringer Ingelheim and Abott. J. R. has received lecture or advisory fees from Merck, Roche, GlaxoSmithKline, Bristol-Myers Squibb, Tibotec, Pfizer, Gilead, Abbott and Boehringer Ingelheim. All other authors have nothing to declare.
Author contributions
M. K. did the pharmacokinetic measurements. M. B. wrote the manuscript. All authors treated the patients before, during and after transplantation, and helped to write the manuscript.
References
- 1.Sattler M, Guengerich FP, Yun CH, et al. Cytochrome P-450 3A enzymes are responsible for biotransformation of FK506 and rapamycin in man and rat. Drug Metab Dispos. 1992;20:753–61. [PubMed] [Google Scholar]
- 2.Vincent SH, Karanam BV, Painter SK, et al. In vitro metabolism of FK-506 in rat, rabbit, and human liver microsomes: identification of a major metabolite and of cytochrome P450 3A as the major enzymes responsible for its metabolism. Arch Biochem Biophys. 1992;294:454–60. doi: 10.1016/0003-9861(92)90711-5. [DOI] [PubMed] [Google Scholar]
- 3.Paterson DL, Singh N. Interactions between tacrolimus and antimicrobial agents. Clin Infect Dis. 1997;25:1430–40. doi: 10.1086/516138. [DOI] [PubMed] [Google Scholar]
- 4.Christians U, Jacobsen W, Benet LZ, et al. Mechanisms of clinically relevant drug interactions associated with tacrolimus. Drug Metab Dispos. 2003;31:1292–5. doi: 10.2165/00003088-200241110-00003. [DOI] [PubMed] [Google Scholar]
- 5.van Heeswijk RP, Veldkamp A, Mulder JW, et al. Combination of protease inhibitors for the treatment of HIV-1-infected patients: a review of pharmacokinetics and clinical experience. Antivir Ther. 2001;6:201–29. [PubMed] [Google Scholar]
- 6.Hsu A, Grannemann G, Bertz R. Ritonavir. Clinical pharmacokinetics and interactions with other anti-HIV agents. Clin Pharmacokinet. 1998;35:275–91. doi: 10.2165/00003088-199835040-00002. [DOI] [PubMed] [Google Scholar]
- 7.Bäckman L, Nicar M, Levy M, et al. FK506 trough levels in whole blood and plasma in liver transplant recipients. Correlation with clinical events and side effects. Transplantation. 1994;57:519–25. [PubMed] [Google Scholar]
- 8.Winkler M, Jost U, Ringe B, et al. Association of elevated FK 506 plasma levels with nephrotoxicity in liver-grafted patients. Transplant Proc. 1991;23:3153–5. [PubMed] [Google Scholar]
- 9.Alessiani M, Cillo U, Fung JJ, et al. Adverse effects of FK 506 overdosage after liver transplantation. Transplant Proc. 1993;25:628–34. [PMC free article] [PubMed] [Google Scholar]
- 10.Moench C, Barreiros AP, Schuchmann M, et al. Tacrolimus monotherapy without steroids after liver transplantation – a prospective randomized double-blinded placebo-controlled trial. Am J Transplant. 2007;7:1616–23. doi: 10.1111/j.1600-6143.2007.01804.x. [DOI] [PubMed] [Google Scholar]
- 11.Winkler M, Pichlmayr R, Neuhaus P, et al. Optimal FK 506 dosage in patients under primary immunosuppression following liver transplantation. Transpl Int. 1994;7(Suppl 1):S58–63. doi: 10.1111/j.1432-2277.1994.tb01311.x. [DOI] [PubMed] [Google Scholar]
- 12.Williams R, Neuhaus P, Bismuth H, et al. Two-year data from the European multicentre tacrolimus (FK506) liver study. Transpl Int. 1996;9(Suppl 1):S144–50. doi: 10.1007/978-3-662-00818-8_36. [DOI] [PubMed] [Google Scholar]
- 13.Jain AB, Venkataramanan R, Eghtesad B, et al. Effect of coadministered lopinavir and ritonavir (Kaletra) on tacrolimus blood concentration in liver transplantation patients. Liver Transpl. 2003;9:954–60. doi: 10.1053/jlts.2003.50171. [DOI] [PubMed] [Google Scholar]
- 14.Schonder KS, Shullo MA, Okusanya O. Tacrolimus and lopinavir/ritonavir interaction in liver transplantation. Ann Pharmacother. 2003;37:1793–6. doi: 10.1345/aph.1D076. [DOI] [PubMed] [Google Scholar]
- 15.Guaraldi G, Cocchi S, Codeluppi M, et al. Role of therapeutic drug monitoring in a patient with human immunodeficiency virus infection and end-stage liver disease undergoing orthotopic liver transplantation. Transplant Proc. 2005;37:2609–10. doi: 10.1016/j.transproceed.2005.06.001. [DOI] [PubMed] [Google Scholar]
- 16.Hardy G, Stanke-Labesque F, Contamin C, et al. Protease inhibitors and diltiazem increase tacrolimus blood concentration in a patient with renal transplantation: a case report. Eur J Clin Pharmacol. 2004;60:603–5. doi: 10.1007/s00228-004-0824-2. [DOI] [PubMed] [Google Scholar]
- 17.Teicher E, Vincent I, Bonhomme-Faivre L, et al. Effect of highly active antiretroviral therapy on tacrolimus pharmacokinetics in hepatitis C virus and HIV co-infected liver transplant recipients in the ANRS HC-08 study. Clin Pharmacokinet. 2007;46:941–52. doi: 10.2165/00003088-200746110-00002. [DOI] [PubMed] [Google Scholar]
- 18.Hicks C, Gulick RM. Raltegravir: the first HIV type 1 integrase inhibitor. Clin Infect Dis. 2009;48:931–9. doi: 10.1086/597290. [DOI] [PubMed] [Google Scholar]
- 19.Eron JJ, Young B, Cooper DA, et al. Switch to a raltegravir-based regimen verus continuation of a lopinavir-ritonavir-based regimen in stable HIV-infected patients with suppressed viraemia (SWITCHMRK 1 and 2): two multicentre, double-blind, randomised controlled trials. Lancet. 2010;375:396–407. doi: 10.1016/S0140-6736(09)62041-9. [DOI] [PubMed] [Google Scholar]
- 20.Tricot L, Teicher E, Peytavin G, et al. Safety and efficacy of raltegravir in HIV-infected transplant patients cotreated with immunosuppressive drugs. Am J Transplant. 2009;9:1946–52. doi: 10.1111/j.1600-6143.2009.02684.x. [DOI] [PubMed] [Google Scholar]