

Abstract
Nucleic acids ligation is a vital process in the repair, replication and recombination of nucleic acids. Traditionally, it is assayed by denatured gel electrophoresis and autoradiography, which are not sensitive, and are complex and discontinuous. Here we report a new approach for ligation monitoring using molecular beacon DNA probes. The molecular beacon, designed in such a way that its sequence is complementary with the product of the ligation process, is used to monitor the nucleic acid ligation in a homogeneous solution and in real-time. Our method is fast and simple. We are able to study nucleic acids ligation kinetics conveniently and to determine the activity of DNA ligase accurately. We have studied different factors that influence DNA ligation catalyzed by T4 DNA ligase. The major advantages of our method are its ultrasensitivity, excellent specificity, convenience and real-time monitoring in homogeneous solution. This method will be widely useful for studying nucleic acids ligation process and other nucleic acid interactions.
INTRODUCTION
The replication, repair and recombination of nucleic acids are essential life processes, in which many biomolecules like enzymes, proteins and ribozymes participate. Among them, DNA ligase plays an indispensable role in catalyzing the formation of phosphodiester bonds at single strand breaks between adjacent 3′-hydroxyl and 5′-phosphate ends in double strand DNA (1–7). Nucleic acid ligation is an important tool for editing DNA both in vivo and in vitro, and some nucleic acid assay methods like Ligase Chain Reaction (LCR) and Amplified Fragment Length Polymorphism (AFLP) have been developed based on it (8–12). Currently, the ligation process is usually assayed by radial 32P labeling, denaturing gel electrophoresis and autoradiography (3–12). These methods are time consuming, discontinuous and not sensitive. There have been recent efforts to develop fluorescence assays for nucleic acids ligation. One way is to replace the radioisotope with a fluorophore (13), and another is to utilize fluorescence resonance energy transfer (FRET) and time-resolve fluorescence measurements (14). However, all of these are discontinuous assays, making real-time monitoring of nucleic acids ligation impossible.
A molecular beacon (MB) is a synthetic short oligonucleotide that possesses a loop and a stem structure (15–25). The loop portion of a MB is a probe sequence complementary to a target nucleic acid. The arm sequences flanking either side of the probe are complementary to one another. A fluorophore and a quencher are attached to the two termini. The stem keeps these two moieties in close proximity to each other, causing the fluorescence of the fluorophore to be quenched (15,16). While hybridized with target nucleic acids, the fluorophore and the quencher are moved away from each other, leading to the restoration of fluorescence. Profiting from this artful design, MBs have a few advantages over traditional DNA probes, including enhanced specificity and sensitivity, and the ability to detect target hybridization in homogeneous solution without separation of hybridized and non-hybridized probes (17–25). MBs serve as a highly sensitive, extremely selective, non-radioactive, easily detectable probe for following real-time biomolecular interactions, making them ideal probes for ligation monitoring.
We have developed a simple and efficient assay for the monitoring of the nucleic acid ligation process in real time and in homogeneous solutions using MBs. As shown in Figure 1, the ligation system is composed of a DNA ligase, two oligos to be ligated and a MB, in which the combined sequences of the two oligos are complementary to the loop sequence of the MB. In the beginning, each oligo is hybridized to one-half of the loop of the MB to form a DNA complex with a nick. This will not open the MB stem completely, but instead will slightly destabilize the stem. When ligase is added, the ligation reaction closes the nick to form a longer DNA strand that is complementary to the MB, resulting in the MB opening completely. This leads to a full fluorescence restoration. We call this a ‘ligate and light’ process. According to this mechanism, the MB is not only a probe for the detection of the ligation process, but also a template for the two oligos in the ligation process. Using this method, an efficient bioassay for monitoring the activity of T4 DNA ligase has been developed. This is then used to investigate the ligation process under different conditions.
Figure 1.

‘Ligate and light’. Schematics diagram of real-time monitoring of the nucleic acid ligation process by a MB. (A) The two half-matching oligos hybridize with the MB to form a nick and may open the stem slightly. (B) The DNA ligase binds to the nick and catalyzes the ligation of two short oligos to form a longer oligo. The ligation product then hybridizes with the MB, which restores the quenched fluorescence of the MB.
MATERIALS AND METHODS
Materials
The MB was synthesized by TriLink Biotechnologies, Inc. (San Diego, CA), with a tetramethylrhodamine (TAMRA) molecule bound at 5′ and a 4-(4′-dimethylaminophenylazo) benzoic acid (DABCYL) coupled to 3′ terminus. The length of the MB is 32-nt, with a loop part of 20-nt and 6-nt in each side of the stem of the MB. The following four oligos were synthesized by SANGO Biological Engineering Technology and Service Co., Ltd (Shanghai, China). The sequences of the oligos are listed in Table 1. N1 is an 18-nt oligo matching the loop sequence of the loop of the MB. N2 and N3 are 9-nt oligos and designed to match 3′ and 5′ half part of the loop of the MB. N4 matches the 5′ half part of MB’s loop and was phosphorylated at its 5′ end. The T4 DNA ligase purchased from Takara Biotechnology Co., Ltd (Dalian, China), and a 10× reaction buffer [660 mM Tris–HCl (pH 7.6), 1 mM ATP and 66 mM MgCl2] was used. Acrylamide and N,N,N′,N′-tetramethyl-ethylenediamine (TEMED) were purchased from Sigma Chemical Co. (St Louis, MO). N′N-methylene-bis-Acrylamide and urea were purchased from Bebco (Kansas, AZ). dATP was purchased from MBI Fermentas (Lithuania), KCl, NaCl, ATP and MgCl2 were purchased from Amresco (Solon, OH). Deionized water was obtained through a Nanopure Infinity™ ultrapure water system (Barnstead/thermolyne Corp, Dubuque, IA) and had an electric resistance >18.3 MΩ.
Table 1. Oligonucleotides synthesized in this experimenta.
| Code | Description | Sequence (5′ to 3′) |
|---|---|---|
| MB | Molecular beacon | (TMR) -CGTTGA TGG TTC CAC TTC |
| TCG TGC GT TCAACG-(DABCYL) | ||
| N1 | 18-nt oligo complement with MB’s loop | CGC ACG AGA AGT GGA ACC |
| N2 | 9-nt oligo complement with 3′ half part of MB’s loop | CGC ACG AGA |
| N3 | 9-nt oligo complement with 5′ half part of MB’s loop | AGT GGA ACC |
| N4 | Same sequence as N3, but phosphorylated at 5′ end | p AGT GGA ACC |
| N5 | Similar to N2, but one base mismatch at 3′ end | CGC ACG AGG |
| N6 | Similar to N2, but one base mismatch at 3′ end | CGC ACG AGC |
| N7 | Similar to N2, but one base mismatch at 3′ end | CGC ACG AGT |
| N8 | Similar to N4, but one base mismatch at 5′ end | p GGT GGA ACC |
| N9 | Similar to N4, but one base mismatch at 5′ end | p CGT GGA ACC |
| N10 | Similar to N4, but one base mismatch at 5′ end | p TGT GGA ACC |
aThe underlined sequences in MB indicate the stem of molecular beacon. p in N4, N8, N9 and N10 represents phosphate at 5′.
Fluorescence measurements
All fluorescence measurements were carried out on a Fluorolog Tau-3 spectrofluorometer (Jobin Yvon, Inc., Edison, NJ) equipped with a thermostat accurate to 0.1°C. The fluorescence intensity of samples was monitored by exciting at 521 nm and an emission of 578 nm was recorded. Slits for both the excitation and the emission were set at 5 nm. The emission spectra were obtained by exciting the samples at 521 nm and by scanning the emission from 545 to 650 nm in steps of 1 nm. Except for the thermal profiles measurements, all samples were incubated at 37°C. When the fluorescence intensity became steady, the T4 DNA ligase was added into a ligation solution and after stirring for ∼4 s, the fluorescence intensity was recorded over time.
DNA ligation catalyzed by T4 DNA ligase
We carried out ligation experiments to monitor the ligation process and to study the effects of external factors and mismatch oligos on ligation. Each ligation mixture contained target oligos and basal solution, which consisted of 400 nM MB, 66 mM Tris–HCl (pH 7.6), 10 mM dithiothreitol (DTT), 6.6 mM MgCl2 and 0.1 mM ATP. The target oligos were altered depending on variant experiments. Additionally, the concentrations of MgCl2 and ATP were adjusted while their influences on ligation were investigated. All solutions were prepared with super-purified water with a volume of 120 µl. In real-time monitoring experiments, four samples were prepared at 300 nM oligos, in which the oligos are (A) N1, (B) N2 and N4, (C) N2 and N3, and (D) none, respectively. The time scan fluorescence of each sample was recorded with the addition of 1.4 U T4 DNA ligase. To perform denaturing polyacrylamide gel electrophoresis, four ligation mixtures similar to that mentioned above, but containing 10 µM MB and 7.5 µM oligos, were prepared. Two samples containing 10 µl reaction solutions were moved from each sample before adding T4 DNA ligase, and after the ligation process had taken place for 360 s with the addition of ligase. The reactions were stopped by the addition of 50% final volume formamide and 5 mM EDTA. The samples were then electrophoresed on 20% denaturing polyacrylamide gels (20% acrylamide, 19:1 acrylamide:bisacrylamide, 7 M urea, 2 mM EDTA, 89 mM Tris–borate, 25% formamide). Electrophoresis was carried out in 1× TBE (pH 8.3) at 200 V constant voltage for 2 h. After fixing and silver staining, gels were scanned using an ImageMaster VDS-CL (Amersham).
There are a few molecules and ions that can influence the nucleic acids ligation. The effect of five molecular species, including ATP, Mg2+, K+, Na+ and dATP, was studied. The ligation solutions consisted of MB, N2, N4 and the specific molecular species. The concentrations of ATP or MgCl2 were adjusted while their effects were investigated. Fluorescence of all solutions was obtained with the addition of 0.28 U T4 DNA ligase. Initial ligation velocity was calculated by using the increase in fluorescence over time. To investigate the fidelity of T4 DNA ligase, a serial of mismatch ligation was also studied to investigate the effect of mismatches. The ligation mixtures contained basal solution and 300 nM oligos. The target oligos were selected purposely to form the nick with a mismatched base pair at 3′ or 5′ on the side. Mismatch effects on ligation were evaluated by initial ligation velocity.
Thermal profiles of MB and its targets
To search for a proper temperature for ligation experiments, the fluorescence intensity of MB solutions in the presence of half matched targets (N3 and N4) or an 18-nt matched target (N1) was measured as a function of temperature. Two solutions were prepared: a mixture of MB solution with 300 nM oligo N1 and a mixture with 300 nM oligos N2 and N4. The temperature was increased from 20 to 61°C in steps of 3°C, with each step lasting for 10 min for equilibrium. The steady fluorescence intensity of each sample at different temperature was used for the MB thermal profile and the optimization of temperature for ligase reaction.
Assay of T4 DNA ligase
The T4 DNA ligase was commercially provided at the concentration of 2.8 U/µl. A series of standard T4 DNA ligase solutions was prepared from 2.8 × 10⁻⁵ to 2.8 × 10⁻¹ U/µl. These solutions were diluted with a T4 DNA ligase storage buffer consisting of 50% glycerol, 10 mM Tris–HCl (pH 7.5), 10 mM 2-mercaptoethanol, 0.1 mM EDTA and 50 mM KCl. To protect the activity of the T4 DNA ligase, all of these standard solutions were prepared under 4°C and stored at –20°C. The samples prepared by mixing MB solution with 300 nM N2 and N4, as well as the fluorescence measurements were carried out with the addition of variant concentrations of T4 DNA ligase.
RESULTS AND DISCUSSION
Using MBs to monitor nucleic acids ligation process in real time
We have developed a simple MB based assay for real-time monitoring of nucleic acids ligation using T4 DNA ligase. Figure 2 shows real-time fluorescence scan curves of four samples: curve A for MB with N1, curve B for MB with N2 and N4, curve C for MB with N2 and N3 and curve D for MB only. There was no fluorescence change for curves A, C and D after the addition of T4 DNA ligase, implying that there was no significant change in MB stem–loop structure. Curve B had a rapid rise with the addition of T4 DNA ligase, with the slope of the curve decreasing gradually as time lapsed. According to the proposed schematic mechanism in Figure 1, this indicated that ligation occurred, opening the MB for fluorescence restoration.
Figure 2.

Real-time fluorescence scans and corresponding gel electrophoresis. (Left) Curve A is a time scan of fluorescence intensity of MB with N1; B is of MB with N2 and N4; C is of MB with N2 and N3; curve D is of MB itself. t0 is the time when T4 DNA ligase is added into the MB/oligo solution. (Right) Gel electrophoresis images. Lanes 1 and 2 are for sample D; 3 and 4 for sample C; 5 and 6 for sample B; and 7 and 8 for sample A. Lanes 1, 3, 5 and 7 represent samples D, C, B and A before the addition of T4 DNA ligase, while lanes 2, 4, 6 and 8 represent corresponding samples obtained at 360 s after the addition of ligase. There is a major difference between lanes 5 and 6, while there is basically no difference for all the other pairs.
To confirm the ligation process, denaturing polyacrylamide gel electrophoresis was used to identify the components in the ligation reaction mixtures, shown in Figure 2 (right). All the odd number lanes are for the samples before the ligation process started, and the even numbers represent the samples obtained at 360 s after T4 DNA ligase was added to the solution. It is clear that no difference exists between lanes (1 versus 2, 3 versus 4 and 7 versus 8) for each sample, except for lanes 5 and 6. This is in agreement with the fluorescence time scan results shown in Figure 2 (left, 1 versus 2 for D, 3 versus 4 for C, 7 versus 8 for A). Lanes 5 and 6 represented sample B, which contained MB, N2 and N4. Lane 6 had a band indicating N1, while lane 5 did not, suggesting that N1 is the product of the ligation of N2 and N3. Also, the band indicating N2 and N3 in lane 6 was greatly reduced due to their consumption in the ligation process. These results clearly show that using MB in homogeneous solutions in real-time monitoring of the ligation process is as efficient as gel electrophoresis, currently the most common method. It is worth noting that the MB-based fluorescent bioassay took only a few minutes to finish, while the gel electrophoresis took a few hours to a full day in preparation and operation. Additionally, the MB-based assay can be monitored in real time and in homogeneous solutions, and can also be highly sensitive and quantitatively precise due to our ability to measure extremely weak fluorescence signal using a fluorescence spectrometer.
Thermal profiles of MB with target oligos
Thermal profiles of the MB and its hybrids will be useful in determining the optimal ligation temperature. As shown in Figure 3 (left), we obtained the thermal profiles of MB with its target oligos, characterized as the fluorescence intensity as a function of temperature. Curve A represents the sample containing MB with N1, and curve B for MB with N2 and N4. Unlike monitoring ligation experiments, no ligase was introduced into these samples. The optimal temperature for ligation study should be a temperature at which the MB and N1 would have the highest intensity after hybridization, while MB and N2 and N3 would have the lowest fluorescence intensity. The curve A in Figure 3 (left) rose from 20°C and reached its maximum around 26°C, after which the unwiring of 18 bp double helix upon rising temperature decreased the fluorescence. The curve B was fluctuated for the competition of hybridization and melting, and reached a minimum around 40°C. The discrepancy between these two curves represented the capability of MB in distinguishing oligos before/after ligation, and thus presented us an opportunity in selecting an optimal temperature for MB-based ligation study.
Figure 3.

Thermal profiles for MB hybrids. (Left) Curve A is the thermal profile of MB with N1, and curve B is that of MB with N2 and N4. (Right) Fluorescence intensity ratio is plotted as a function of temperature. The ratio is calculated using the fluorescence intensity of MB with N1 over that of MB with N2 and N4 without ligase. This profile can be used for determining the optimal temperature for ligase studies using MBs.
The ligation temperature affects two important aspects in the real-time monitoring of nucleic acids ligation: the first one is the ability of MB to distinguish the oligos before/after ligation, and the other is the activity of T4 DNA ligase. The MB’s distinguishing capability was virtually determined by the different Tm between MB with N1, and that with N2, N4. This difference is a function of temperature, as illustrated in Figure 3 (left). Evidently, the ratio of curve A to B can be used to characterize the discerning ability of MB, as plotted in Figure 3 (right). The ratio curve rises from 2.9 to 11.2 as temperature increases from 20 to 40°C, and decreased to 2.0 when the temperature is increased to 61°C. Obviously, the higher the ratio, the higher the sensitivity for assaying ligation product will be. In addition to the signal ratio, the activity of the ligase should be taken into account. The activity of T4 DNA ligase would be restrained if the temperature is >37°C. Therefore, 37°C was chosen for all ligation reactions to ensure a high sensitivity (the ratio reached 10.7) and a high activity of T4 DNA ligase.
Factors affecting ligation process
The ligation process can be affected by many molecular species including biomolecules and metal ions. We are able to monitor ligation velocity easily and accurately with the MB based bioassay in order to investigate these effects. Figure 4 shows five factors on ligation using T4 DNA ligase. Figure 4A and B shows that the ligation did not take place unless ATP or Mg2+ was added to the ligation mixtures. The ligation reached its maximum rate at 50 µM of ATP or at 16.7 mM of Mg2+, respectively. The dATP slowed down the ligation rate gradually upon increasing its concentration, as illustrated in Figure 4C. It is well known that dATP is a competitive inhibitor that combines with ligase but cannot be adenylated to perform the ligation process. The high concentration of K+ and Na+ obviously hindered the ligation process as demonstrated in Figure 4D. The initial ligation velocity decreased proportionally to the concentrations of K+ or Na+, and the velocity was close to zero when the concentrations were ∼300 mM. The effects of high concentrations of K+, Na+ and Mg2+ on MB with/without target oligos were also studied, suggesting a minimal effect on MB itself and its hybrids (data not shown). All these control experiments confirmed that the initial ligation rate was indeed altered by these external factors.
Figure 4.

Effects of molecular species on ligation process. (A) Ligation velocity in the presence of various concentrations of ATP. (B) Effects of Mg2+ on ligation. (C) Effects of dATP on ligation. (D) Effects of K+ and Na+ on ligation. Initial ligation velocity in each chart was normalized in each experiment. Therefore, each plot can only be compared within itself, and cannot be used to draw comparisons with plots.
Specificity of the MB based ligase assay
The MB based bioassay is highly specific for monitoring the ligation process. To confirm this, a series of mismatched ligations was inspected to evaluate the specificity of T4 DNA ligase. MB was designed with weak stems to reduce its specificity (18–20) and to ensure that all six mismatch ligation processes would obtain similar fluorescence signal (data not shown). The results had been normalized by base paired control ligation and tabulated in Table 2. Mismatches at both sides greatly slowed down ligation, while 3′ mismatches inhabited ligation more significantly than that at 5′. C-T and T-T mismatches at 3′ cut down ligation velocity to 1/1000 and 1/100, respectively, while a G-T mismatch base pair, shown to cause a minimum structural disturbance within the DNA duplex (26,27), had the highest ligation velocity both at 5′ and 3′ side. These data indicate that T4 DNA ligase could not tolerate most of the mismatches, which is consistent with the results reported previously (7,13,27).
Table 2. Mismatches and their effects on ligationa.
| 5′-CGCACGAG-N N-GTGGAACC-3′ | |||||||
|---|---|---|---|---|---|---|---|
| 3′-GCGTGCTC-T-T-CACCTTGG-5′ | |||||||
| -A A- | 1.00 | -A C- | 0.09 | -A G- | 0.34 | -A T- | 0.14 |
| -T-T- | -T-T- | -T-T- | -T-T- | ||||
| – | – | -C A- | 0.001 | -G A- | 0.14 | -T A- | 0.01 |
| -T-T- | -T-T- | -T-T- | |||||
aThe top two rows of the table represents the composition of the hybrid, in which the lower sequence is the loop of MB while the upper sequences represent the substrate oligos. The mismatched nick listed in the table is characterized by the four adjacent nucleotides (bold). The normalized ligation velocity is listed to correspond to each mismatch.
Assay of T4 DNA ligase
The MB has been used as a highly sensitive molecular probe for bioanalysis (15,16,25). We carried out experiments to characterize the effects of T4 DNA ligase concentration on the ligation rate. Time scan curves of the fluorescence intensity of the samples are illustrated in Figure 5. Along with the lapse of time, the ligation velocity slowed down gradually with the diminishing of reactant oligos N2 and N4. From Figure 5, it is clear that the initial rate of ligation was highly dependent on the concentration of T4 DNA ligase in the range from 2.3 × 10⁻⁴ to 2.3 U/ml. According to the Michaelis–Menten equation (28), the initial reaction rate catalyzed by enzymes is directly proportional to the concentration of the enzyme within a certain concentration range. In this study, the relationship between the initial ligation rate and the concentration of T4 DNA ligase is elucidated in an insert chart of Figure 5. In the range from 2.3 × 10⁻⁴ to 0.23 U/ml, the initial ligation rate is directly proportional to the concentration of T4 DNA ligase, and could be expressed by equation 1:
Figure 5.
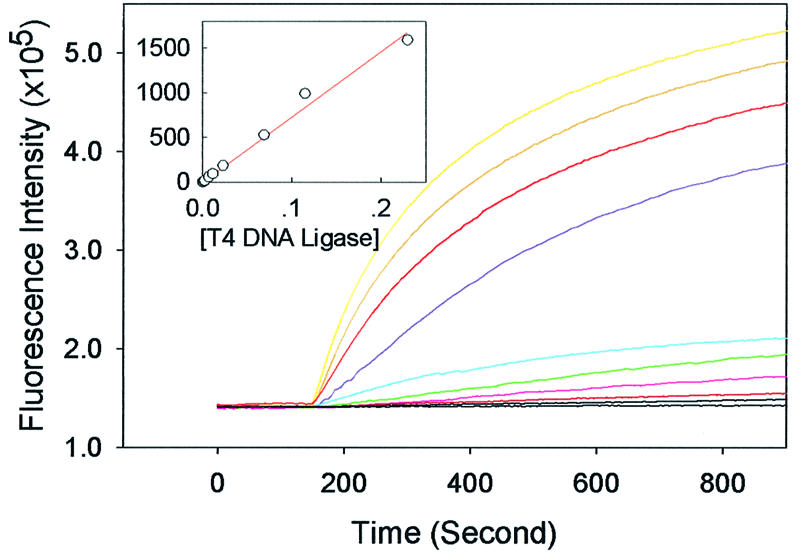
Ligation assay by T4 DNA ligase. Time scan curves of liga tion catalyzed by various concentrations of T4 DNA ligase. The curves from top to bottom are those obtained with different T4 DNA ligase concentrations: 2.3, 0.23, 0.115, 6.9 × 10⁻², 2.3 × 10⁻², 1.2 × 10⁻², 6.9 × 10⁻³, 2.3 × 10⁻³, 1.2 × 10⁻³ and 2.3 × 10⁻⁴ U/ml. (Insert) The initial ligation velocity is plotted as a function of the concentration of T4 DNA ligase.
V = 7.27 × 10⁴C 1
where V is initial ligation velocity represented by fluorescence enhancement every second, and C is the concentration of T4 DNA ligase represented in U/ml. This relationship shows that ligation kinetics obey the Michaelis–Menten equation. To determine the detection limit of this assay, the enhancement of fluorescence intensity in 10 min was used after ligation started. We determined that the concentration detection limit for T4 DNA ligase was 2.3 × 10⁻⁴ U/ml (based on three times higher fluorescence intensity than the background noise). A lower detection limit could be reached by optimizing ligation conditions such as increasing the concentration of substrates or prolonging the ligation time.
CONCLUSION
In summary, we have developed a novel bioassay for real-time monitoring of nucleic acids ligation using MB DNA probes. The MB used in this assay is designed in such a way that its loop sequence is complementary to the product of the ligation process. Since a MB can be used for real-time monitoring of DNA hybridization, this assay can be used in homogeneous solution for real-time monitoring of ligation reaction and its kinetics. The effects of five different external factors and of mismatches on ligation have been investigated. The major advantages of this MB-based ligation assay are its speed, simplicity, ultrasensitivity, excellent specificity, convenience and the ability to perform real-time monitoring of homogeneous solution. This method provides a platform for studying a wide variety of nucleic acids ligation processes and other nucleic acid interactions.
Acknowledgments
ACKNOWLEDGEMENTS
This work was partially supported by the National Key Basic Research Program (2002CB513100), Key Project of Natural Science Foundation of People’s Republic of China (20135010), Leading Teacher Foundation of China Education Ministry (2000-65), Oversea Youth Scholar Co-research Foundation of People’s Republic of China (20028506), Key Project of Hunan Province Technology Plan (03SSY1006) and Natural Science Foundation of Hunan Province (00GKY1011, 01JJY2012).
REFERENCES
- 1.Lindahl T. and Wood,R.D. (1999) Quality control by DNA repair. Science, 286, 1897–1905. [DOI] [PubMed] [Google Scholar]
- 2.Wilson D.M. III and Larry,H.T. (1997) Life without DNA repair. Proc. Natl Acad. Sci. USA, 94, 12754–12757. [DOI] [PMC free article] [PubMed] [Google Scholar]
- 3.Lehman I.R. (1974) DNA ligase: structure, mechanism, and function. Science, 186, 790–797. [DOI] [PubMed] [Google Scholar]
- 4.Doherty A.J. and Suh,W.S. (2000) Structural and mechanistic conservation in DNA ligases. Nucleic Acids Res., 28, 4051–4058. [DOI] [PMC free article] [PubMed] [Google Scholar]
- 5.Odell M. and Shuman,S. (1999) Footprinting of chlorella virus DNA ligase bound at a nick in duplex DNA. J. Biol. Chem., 274, 14032–14039. [DOI] [PubMed] [Google Scholar]
- 6.Doherty A.J. and Dafforn,T.R. (2000) Nick recognition by DNA ligases. J. Mol. Biol., 296, 43–56. [DOI] [PubMed] [Google Scholar]
- 7.Sriskanda V. and Shuman,S. (1998) Specificity and fidelity of strand joining by chlorella virus DNA ligase. Nucleic Acids Res., 26, 3536–3541. [DOI] [PMC free article] [PubMed] [Google Scholar]
- 8.Landegren U., Kaiser,R., Sanders,J. and Hood,L. (1988) A ligase-mediated gene detection technique. Science, 241, 1077–1080. [DOI] [PubMed] [Google Scholar]
- 9.Vos P., Hogers,R., Bleeker,M., Reijans,M., Lee,T., Hornes,M., Frijters,A., Pot,J., Peleman,J., Kuiper,M. and Zabeau,M. (1995) AFLP: a new technique for DNA fingerprinting. Nucleic Acids Res., 23, 4407–4414. [DOI] [PMC free article] [PubMed] [Google Scholar]
- 10.Monib Z., Takamori,N., Gregg,N., Timothy,M., Philip,P. and Francis,B. (1999) Ligase-based detection of mononucleotide repeat sequences. Nucleic Acids Res., 27, e40. [DOI] [PMC free article] [PubMed] [Google Scholar]
- 11.Beaudry D. and Perreault,J.P. (1995) An efficient strategy for the synthesis of circular RNA molecules. Nucleic Acids Res., 23, 3064–3066. [DOI] [PMC free article] [PubMed] [Google Scholar]
- 12.Kinoshita Y., Nishigaki,K. and Husimi,Y. (1997) Fluorescence-, isotope- or biotin-labeling of the 5′-end of single-stranded DNA/RNA using T4 RNA ligase. Nucleic Acids Res., 25, 47–48. [DOI] [PMC free article] [PubMed] [Google Scholar]
- 13.Tong J., Barany,F. and Cao,W. (2000) Ligation reaction specificities of an NAD+-dependent DNA ligase from the hyperthermophile Aquifex aeolicus. Nucleic Acids Res., 28, 1447–1454. [DOI] [PMC free article] [PubMed] [Google Scholar]
- 14.Chen X.C., Hentz,N.G., Hubbard,F., Meier,T.I., Sittampalam,S. and Zhao,G. (2002) Development of a fluorescence resonance energy transfer assay for measuring the activity of Streptococcus pneumoniae DNA ligase, an enzyme essential for DNA replication, repair, and recombination. Anal. Biochem., 309, 232–240. [DOI] [PubMed] [Google Scholar]
- 15.Deborah L.S., Zhang,X., Lu,P. And Gewirtz,A.M. (1998) Real time detection of DNA-RNA hybridization in living cell. Proc. Natl Acad. Sci. USA, 95, 11538–11543. [DOI] [PMC free article] [PubMed] [Google Scholar]
- 16.Tyagi S. and Kramer,F.R. (1996) Molecular beacons: probes that fluoresce upon hybridization. Nat. Biotechnol., 14, 303–308. [DOI] [PubMed] [Google Scholar]
- 17.Fang X., Li,J.J., Perlette,J., Tan,W. and Wang,K. (2000) Molecular beacons: novel fluorescent probes. Anal. Chem., 72, 747A–753A. [DOI] [PubMed] [Google Scholar]
- 18.Bonnet G., Krichevsky,O. and Libchaber,A. (1998) Kinetics of conformational fluctuations in DNA hairpin-loops. Proc. Natl Acad. Sci. USA, 95, 8602–8606. [DOI] [PMC free article] [PubMed] [Google Scholar]
- 19.Bonnet G., Tyagi,S., Libchaber,A. and Kramer,F.R. (1999) Thermodynamic basis of the enhanced specificity of structured DNA probes. Proc. Natl Acad. Sci. USA, 96, 6171–6176. [DOI] [PMC free article] [PubMed] [Google Scholar]
- 20.Tsourkas A. Behlke,M.A. Rose,S.D. and Bao,G. (2003) Hybridization kinetics and thermodynamics of molecular beacons. Nucleic Acids Res., 31, 1319–1330. [DOI] [PMC free article] [PubMed] [Google Scholar]
- 21.Tyagi S., Bratu,D.P. and Kramer,F.R. (1998) Multicolor molecular beacons for allele discrimination. Nat. Biotechnol., 16, 49–53. [DOI] [PubMed] [Google Scholar]
- 22.Chen W., Martinez,G. and Mulchandani,A. (2000) Molecular beacons: a real-time polymerase chain reaction assay for detecting Salmonella. Anal. Biochem., 280, 166–172. [DOI] [PubMed] [Google Scholar]
- 23.Li J.J., Fang,X.H., Schuster,S.M. and Tan,W. (2000) Molecular beacons: a novel approach to detect protein–DNA interactions. Int. Ed. Engl. Int. Edn English, 39, 1049–1052. [DOI] [PubMed] [Google Scholar]
- 24.Zhang P., Beck,T. and Tan,W. (2001) Design of a molecular beacon DNA probe with two fluorophores. Int. Ed. Engl. Int. Edn English, 40, 402–405. [DOI] [PubMed] [Google Scholar]
- 25.Li J.J., Geyer,R. and Tan,W. (2000) Using molecular beacons as a sensitive fluorescence assay for enzymatic cleavage of single-strand DNA. Nucleic Acids Res., 28, e52. [DOI] [PMC free article] [PubMed] [Google Scholar]
- 26.Brown T., Kennard,O., Kneale,G. and Rabinovich,D. (1985) High-resolution structure of a DNA helix containing mismatched base pairs. Nature, 315, 604–606. [DOI] [PubMed] [Google Scholar]
- 27.Pritchard C.E. and Southern,E.M. (1997) Effects of base mismatches on joining of short oligodeoxynucleotides by DNA ligases. Nucleic Acids Res., 25, 3403–3407. [DOI] [PMC free article] [PubMed] [Google Scholar]
- 28.Lehninger A.L., Nelson,D.L. and Cox,M.M. (1993) Principles of Biochemistry. Worth Publishers, New York, NY. [Google Scholar]