Abstract
Methylmercury (MeHg) is a ubiquitous environmental contaminant that preferentially targets the developing nervous system. Variable outcomes of prenatal MeHg exposure within a population point to a genetic component that regulates MeHg toxicity. We therefore sought to identify fundamental MeHg tolerance genes using the Drosophila model for genetic and molecular dissection of a MeHg tolerance trait. We observe autosomal dominance in a MeHg tolerance trait (development on MeHg food) in both wild-derived and laboratory-selected MeHg-tolerant strains of flies. We performed whole-genome transcript profiling of larval brains of tolerant (laboratory selected) and nontolerant (control) strains in the presence and absence of MeHg stress. Pairwise transcriptome comparisons of four conditions (+/−selection and +/−MeHg) identified a “down-down-up” expression signature, whereby MeHg alone and selection alone resulted in a greater number of downregulated transcripts, and the combination of selection + MeHg resulted in a greater number of upregulated transcripts. Functional annotation cluster analyses showed enrichment for monooxygenases/oxidoreductases, which include cytochrome P450 (CYP) family members. Among the 10 CYPs upregulated with selection + MeHg in tolerant strains, CYP6g1, previously identified as the dichlorodiphenyl trichloroethane resistance allele in flies, was the most highly expressed and responsive to MeHg. Among all the genes, Turandot A (TotA), an immune pathway–regulated humoral response gene, showed the greatest upregulation with selection + MeHg. Neural-specific transgenic overexpression of TotA enhanced MeHg tolerance during pupal development. Identification of TotA and CYP genes as MeHg tolerance genes is an inroad to investigating the conserved function of immune signaling and phase I metabolism pathways in MeHg toxicity and tolerance in higher organisms.
Keywords: methylmercury, MeHg, cytochrome P450, Turandot, immune pathways, stress response, alternative models
Exposure to methylmercury (MeHg) in the human population is primarily through intake of dietary saltwater and freshwater fish. MeHg is the most toxic form of mercury because of its ability to distribute rapidly within biological tissues and its pleiotropic effects in disrupting cellular function. It has long been understood that MeHg preferentially targets the developing nervous system and that the unborn fetus and young children are at greatest risk from exposure. Nonetheless, there is considerable biological variability in the outcomes of MeHg exposure as seen in both animal and human studies (Huang et al., 2007; Yasutake and Hirayama, 1988). Although several factors can contribute to this variability, including age, gender, and other environmental factors, it has been acknowledged that genetic background may largely influence different responses to MeHg between individuals within a population (NRC, 2000). However, additional studies using unbiased genetic approaches are needed to elucidate the mechanisms of MeHg tolerance and susceptibility.
One hypothesis is that tolerance/susceptibility to MeHg toxicity is dictated by the cellular levels of protective pathways, e.g., glutathione (GSH) and associated antioxidant enzymes and that damage results once these protective mechanisms are overwhelmed by MeHg (Kaur et al., 2006; Shanker et al., 2005). It is therefore reasonable to predict that populations and individuals in a population will vary in their genetic makeup that regulates expression of protective pathways against MeHg. This is supported by one study that correlates polymorphisms in GSH-related genes with methylmercury retention (Custodio et al., 2004) and thus reinforces the notion that susceptibility to MeHg might be dictated by genetic disposition. A complementary hypothesis would be that variability exists in the response to MeHg stress. Although some individuals may respond favorably by upregulating expression of protective pathway genes, others might not, or worse, show a decrease in protective pathway expression with MeHg insult. Aside from GSH, the cellular mechanisms that combat MeHg toxicity are not fully understood. As well, it is unclear how individual pathways contribute to MeHg toxicity outcomes in the context of the whole organism.
Several studies have shown that tolerance to environmental stressors such as temperature and oxidative stress can be identified as a genetically heritable trait (Morgan and Mackay, 2006; Wang et al., 2006). However, very few studies have investigated the genetic basis for MeHg toxicity in a multicellular organism. In studies initially aimed at investigating the toxicity of a number of organometals in a Drosophila model, Ramel and Magnusson (1986) demonstrated a large strain-dependent variability in resistance to MeHg, which was also seen with mercury chloride, cadmium chloride, triethyl lead, and trimethyl tin. Importantly, these previous studies showed no significant correlation between strains and tolerance for multiple metal compounds, indicating that unique genetic mechanisms of tolerance exist for MeHg versus other organometals (Magnusson and Ramel, 1986). These investigators also demonstrated that selection of flies on MeHg food gives rise to a highly tolerant population (Magnusson and Ramel, 1986). Furthermore, crosses between tolerant and susceptible wild-derived fly lines reveal dominance in the MeHg tolerance trait in the offspring (Magnusson and Ramel, 1986). Thus, these earlier studies solidify the notion that resistance to MeHg toxicity is a trait that can be conferred by a unique set of genes relative to other stress resistance traits. This earlier work took place over two decades ago, prior to the sequencing of the fly genome and the advent of modern molecular approaches, such as whole-genome transcript profiling and transgenic overexpression (e.g., Gal4 > UAS).
In this study, we have built upon the initial observations of Ramel and Magnusson (Magnusson and Ramel, 1986) and used the Drosophila model to identify candidate genes that support MeHg tolerance. We have confirmed that considerable genetic variation in tolerance to MeHg exists in natural populations and that tolerance is transmitted as an autosomal dominant trait. With MeHg-tolerant strains that we generated through laboratory selection, we executed whole-genome transcript profiling to identify profiles of gene expression that correlate with MeHg tolerance. Through functional annotation cluster analyses, and transgenic expression, we were able to identify the cytochrome P450 (CYP) gene family and Turandot A (TotA), an immune pathway–regulated humoral response gene, as MeHg tolerance genes. Additional MeHg tolerance candidate genes are highlighted by the data set.
MATERIALS AND METHODS
Fly lines.
Wild-derived isolines were derived from various geographic locations (maintained by the D. Rand Lab, Brown University, and obtained form Ary Hoffman [University of Melbourne] and Paul Schmidt [University of Pennsylvania]). Samples spanning the east coast of Australia were used from latitude 15.5 [HF and HG lines] and latitude 42.8 [Sorell]). Two collections spanning the east coast of North America were also used: Florida (RIH, latitude 25.3) and Maine (BF, latitude 44.1). Each of the lines was maintained as an inbred stock from a single wild female. Additional lines include standard Canton S and w1118 laboratory strains, Elav-Gal4 (P{GawB}elavC155; #458 Bloomington Drosophila Stock Center), c754-Gal4 (Hrdlicka et al., 2002) (Bloomington #6984, fat body and larval brain expression), and UAS-TotA (w;UAS-TotA (41a); gift from Dan Hultmark, Umeå University, Sweden). Flies were maintained at 25°C on a standard preparation of cornmeal, molasses, and agar medium with yeast. Crosses were performed between virgin females and males of the desired parental lines.
Selection for MeHg tolerance.
MeHg was administered through additions to food preparations. Methylmercury chloride (MeHg; Aldrich #442534) stock solutions (50mM) were prepared in dimethyl sulfoxide (DMSO) and used such that final concentrations of DMSO never exceeded 0.1%. Food consisted of a cornmeal, molasses, and agar mixture (Jazz Mix AS153; Fisher Scientific) prepared in batches and distributed in culture vials or in bottles. MeHg was added to the warm food mixture before it solidified. Control experiments were executed with an equivalent dose of DMSO to that of the experimental.
The founder “synthetic” natural population was derived by pooling over 100 individual strains and allowing interbreeding for over 20 generations. Included in this founder population were the 47 wild isolines from Australia, Florida, and Maine. Selection was done by placing ∼300 adult flies from the founder population on 50 ml of MeHg-containing food in bottle cultures. Controls for the selection process were done in parallel with ∼300 adult flies from the founder population using food lacking MeHg (but containing an equivalent amount of solvent DMSO). Flies were allowed to mate and lay eggs for 3–4 days and were then discarded. Flies that successfully eclosed from this laying were carried over to the next bottle of MeHg (or control) food within the first 3 days of eclosion. At the end of selection, six new strains were established: three replicate control (nonselected and nontolerant) lines were derived by culturing on “zero” MeHg (E0, F0, and H0) and three replicate selection (tolerant) lines were derived by culturing on MeHg food (E20, F20, and H20). The three MeHg-tolerant strains were isolated by incrementally increasing MeHg in the food after three generations at each concentration (5, 7.5, 10, 12.5, 15, 17.5, and 20μM). The final control (nonselected) strains and MeHg-tolerant selected strains were maintained on standard cornmeal/molasses food with yeast. Selection pressure was maintained in the E20, F20, and H20 lines every 8–10 generations by rearing for 2 generations on 15μM MeHg food.
MeHg tolerance assays.
MeHg tolerance was determined by the rate of eclosion of flies reared from the larval stage on various concentrations of MeHg food. First instar larvae were transferred to food vials containing different concentrations of MeHg (or DMSO control) in batches of 50 larvae per vial. The numbers of adult flies that successfully develop and eclose were scored on day 13. Eclosion was expressed as percent of the initial number of larvae placed in the vial. A minimum of three replicates for each strain at each concentration of MeHg was performed (150 larvae total), and data were expressed as the mean and SD. In the instance of the TotA overexpression study, where eclosion rate did not distinguish an effect, a developmental delay end point was determined by scoring the progression of larvae to the “dark” pupal stage, indicating near-complete metamorphosis.
Transcript profiling by Affymetrix microarray.
Transcript analysis was performed on total RNA harvested from the brains of wandering third instar larvae. This tissue included the optic lobes, supra- and subesophageal, thoracic, and abdominal ganglia and was devoid of any other imaginal tissue (e.g., eye, wing, or leg disc). For each sample, 60 brains were isolated and pooled and total RNA extracted. Determinations were done on each of the E0, F0, H0, E20, F20, and H20 strains both “on” and “off” MeHg. Treatments were done by rearing larvae on food containing control (DMSO) or MeHg. MeHg treatments were 15μM in the food as this concentration showed the greatest differential between nontolerant and tolerant strains in eclosion assays. Total RNA samples were prepared using the RNeasy Mini Kit (Qiagen). RNA (> 10 μg) was then processed for GeneChip analysis by the Microarray Facility at the University of Vermont. RNA purity and integrity was validated using a 2100 Bioanylizer (Agilent, Palo Alto, CA) prior to processing for chip analysis. Oligonucleotide microarray analysis of RNA expression levels was performed using the GeneChip Drosophila Genome 2.0 Array (Affymetrix Inc., Santa Clara, CA) according to manufacturer’s protocols. This GeneChip is based on Drosophila Genome Annotation release 3.1 and comprises 18,880 probe sets. The Nugen Ovation system v.2 with SPIA RNA amplification was employed to convert 50 ng of total RNA to complementary DNA (cDNA). This isothermal RNA amplification system produces 5–12 μg of antisense cDNA targets that is followed by several steps to produce sense strand cDNA to be fragmented, biotinylated, and hybridized to the GeneChip. After purification and fragmentation, biotinylated cDNA targets were hybridized to the GeneChip for 16 h at 45°C. Hybridized arrays were washed and stained with streptavidin-phycoerythrin, followed by sequential incubations with biotin-coupled polyclonal antistreptavidin antibody and streptavidin-phycoerythrin as a fluorescent amplification step. After staining, arrays were scanned on a 3000-7G Scanner (Affymetrix Inc.) and probe intensity data collected for further analysis.
Raw GeneChip data included a collection of images, one for each probe and chip. Each image is summarized using Affymetrix GCOS software by one probe intensity. The Robust Multichip Average probe set summary statistic of Speed et al. (Bolstad et al., 2003) was calculated using the Bioconductor (Gentleman et al., 2004) Affy package provided by the authors (Bolstad et al., 2003).
Linear modeling was performed using the Bioconductor Limma package, which implements the method of Smyth et al. (2004, 2005). Smyth’s method borrows information across genes to improve inference based on small sample sizes. The model included terms associated with the culture (E0, F0, H0, E20, F20, or H20), selection (S0 or S20), and MeHg (0 or 15μM) as well as a Selection:MeHg interaction. p values were adjusted using the method of Benjamin and Hochberg (1995), which controls the false discovery rate.
A set of genes judged differentially expressed was identified based on a false discovery rate < 0.05 and analyzed in the context of Gene Ontology Annotation (Camon et al., 2004) using the DAVID 2.0 functional annotation tool (http://david.abcc.ncifcrf.gov/home.jsp) (Dennis et al., 2003).
Quantitative real-time PCR.
Quantitative real-time PCR (qPCR) was done using the same RNA samples that were submitted for microarray analyses. Total RNA was treated with DNAse (Ambion), and cDNA was made by using Superscript II (Invitrogen). The cDNA was used to do qPCR using SYBR-Green JumpStart Taq ReadyMix (Sigma) on an ABI PRISM 7500 Fast Sequence Detection System (Applied Biosciences). Gene expression levels were determined by the comparative CT method (Livak and Schmittgen, 2001). Primer sequences used for the qPCR of various genes can be found in Supplementary table 1.
qPCR was used to determine TotA and CYP6g1 expression in tolerant and nontolerant wild lines in the presence and absence of MeHg exposure. First instar larvae were exposed to control or MeHg (15μM) food as described above. Total RNA was isolated from 25 brains of each strain under each treatment. qPCR was run as described above. Fold change of expression in response to MeHg was expressed for each strain using the comparative CT method.
Transgenic overexpression of TotA.
The Gal-4/UAS system was used (Brand and Perrimon, 1993) for the transgenic overexpression of TotA. Approximately 30 UAS-TotA male flies were mated with 80 virgin female Elav-Gal4 flies (EG4 > TotA) or c754-Gal4 flies (c754G4 > TotA). First instar larvae from this mating were assayed for eclosion on MeHg food as described above. Control crosses were made between Elav-Gal4 or c754-Gal4 virgin females and w1118 males (EG4 > 1118 and c754 > 1118). Successful development was scored as the number of flies that eclosed. Alternatively, successful development was scored as the number of flies that reached or surpassed the “dark pupae” stage of development. Expression of TotA in EG4 > 1118 and EG4 > TotA larvae brains, and in c754G4 > 1118 and c754G4 > TotA whole larvae, was determined by qPCR.
RESULTS
MeHg Tolerance in Wild Strains
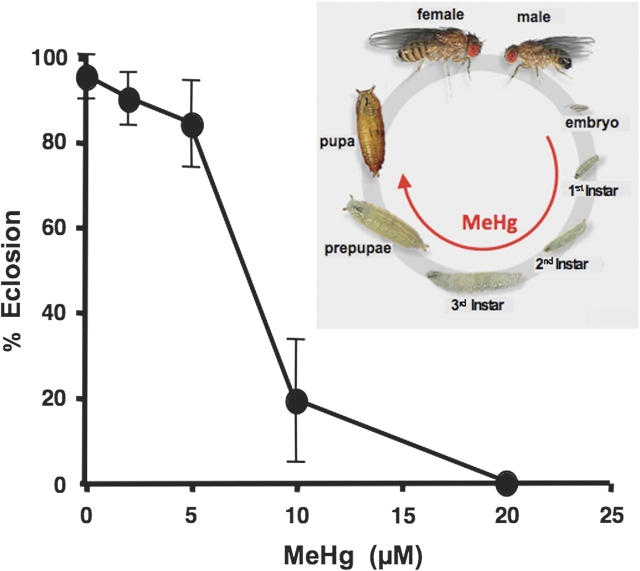
Throughout this study, tolerance to MeHg was determined by quantifying eclosion of larvae reared on various concentrations of MeHg in the food medium (Fig. 1, inset). To determine the relative MeHg tolerance among several wild-derived strains of flies, we first assessed MeHg tolerance in the standard Canton S strain. We observed a sharp decrease in eclosion rate with increases in MeHg concentration and an ∼50% lethal concentration (LC50) of 7.5μM MeHg (Fig. 1). Complete lethality in the Canton S strain was observed with 20μM MeHg.
FIG. 1.
Effect of MeHg exposure on eclosion of Canton S flies. Eclosion of Canton S flies was determined with first instar larvae placed on indicated concentration of MeHg in food (bars = SD of three trials, n = 150). Fifty percent eclosion occurred at ∼7.5μM MeHg. Assays performed with MeHg exposure during the larval to adult stages of the life cycle (inset).
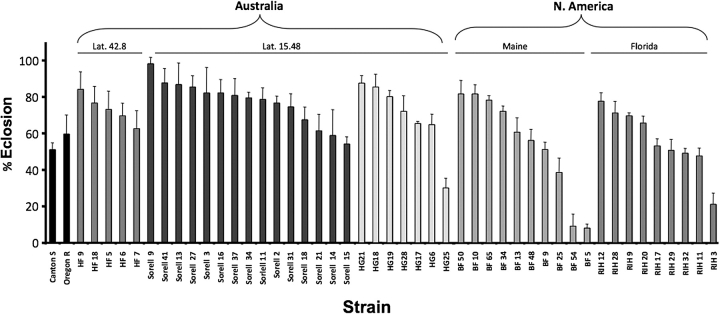
We next assayed MeHg tolerance in 47 individual strains from various geographic locations in North America and Australia (see “Materials and Methods” section). Each strain, descended from a single female, had been maintained as an inbred line for more than 20 generations. Results of the eclosion assay demonstrate that there are significantly different levels of MeHg tolerance between strains (Fig. 2). As exemplified by the BF and RIH lines, there is a wide range of tolerance among lines derived from a single geographic region. We further analyzed the variance in tolerance trait by doing a pairwise comparison of the most and least tolerant lines from each geographic region. Eclosion was assessed on various concentrations of MeHg food. A significant difference in MeHg tolerance is seen between the HF7/HF9, Sorell9/Sorell15, RIH12/RIH11, BF50/BF54, and HG21/HG25 strains (Supplementary figure 1). These data further confirm that natural variation in MeHg tolerance has a significant genetic component and can be determined with confidence via this assay system.
FIG. 2.
MeHg tolerance of wild strains derived from various geographic regions. Forty-seven isolines from the indicated geographical region, plus Canton S and Oregon R strains, were assayed. Eclosion assays were performed with first instar larvae on 7.5μM MeHg food (bars = SD of three trials, n = 150).
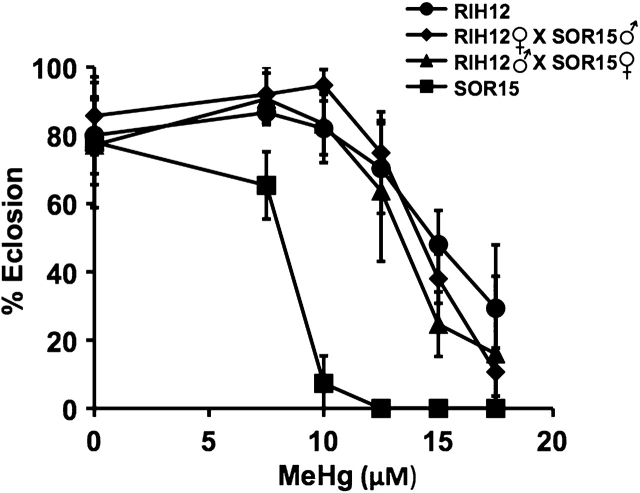
To determine transmission of the tolerance trait to the F1 generation, we performed matings between tolerant and susceptible wild-derived strains. These were done in two reciprocal crosses to reveal basic patterns of dominance and chromosomal inheritance. Reciprocal crosses were done with the most tolerant (RIH12) and the least tolerant (Sorrel15) strains identified previously by eclosion assays on various concentrations of MeHg food (see Supplementary figure 1). The F1 progeny from the RIH12 male × Sorell15 female were seen to be as tolerant as the parent RIH12 line (Fig. 3). Likewise, the F1 progeny from the RIH12 female × Sorell15 male were as tolerant as the RIH12 strain. These results indicate that MeHg tolerance is a dominant trait in the RIH12 line. If the dominant allele(s) is (are) localized predominantly on the X chromosome, we would expect F1 males of the respective reciprocal crosses to differ in tolerance. This was not observed with the RIH12 and Sorrel15 wild strains (data not shown), indicating that the tolerance trait is autosomal dominant. Additional reciprocal crosses of laboratory-selected tolerant and nontolerant flies show the same profile of autosomal dominance of MeHg tolerance (see below).
FIG. 3.
Transmission of the tolerance trait in the progeny of wild strains. Eclosion assays were performed as in Fig. 1 using the indicated tolerant (RIH12) and non-tolerant (Sorell15 and Sor15) parental strains of wild flies. Larvae assayed were derived from the parent lines or the crosses indicated in the inset.
Experimental Selection for the MeHg Tolerance Trait
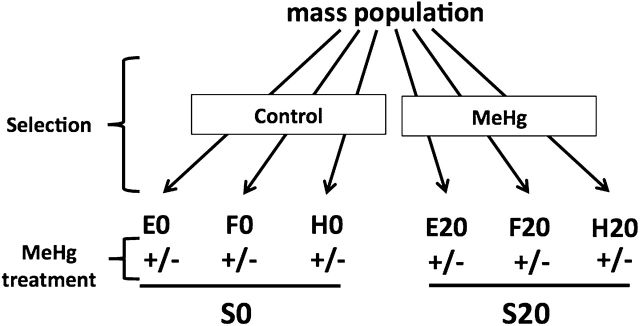
To obtain additional lines of MeHg-tolerant flies, we performed a selection experiment starting with a “synthetic” natural mass population of flies (see “Materials and Methods” section). Included in this founding population were the 47 wild lines tested above. Six novel strains were established from this population: three replicate control (nonselected and nontolerant) lines were derived by culturing on “zero” MeHg (E0, F0, and H0) and three replicate selection (tolerant) lines were derived by culturing on MeHg food (E20, F20, and H20; note that MeHg was incrementally increased to a final concentration of 20μM [see “Materials and Methods” section]). Each line was cultured more than 20 generations and maintained as separate populations in culture bottle(s).
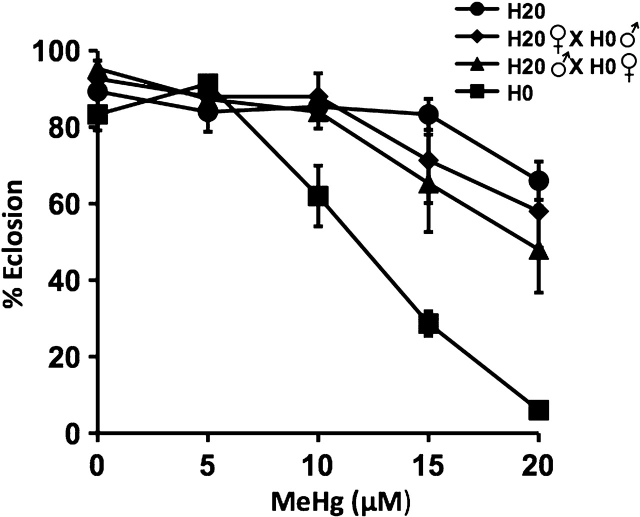
Selection resulted in robust MeHg tolerance as determined by eclosion assays. The LC50 for the H0 (control) flies was ∼12μM MeHg with near-complete lethality at 20μM MeHg (Fig. 4). In the H20 strain, LC50 was greater than 20μM MeHg (Fig. 4). A similar high degree of MeHg tolerance was seen in the accompanying E20 and F20 lines relative to the E0 and F0 controls (Supplementary figure 2).
FIG. 4.
Transmission of the tolerance trait in the progeny of laboratory-selected strains. Eclosion assays were performed as in Fig. 1 using the indicated tolerant (H20) and nontolerant (H0) parental strains of laboratory-selected flies (see Fig. 5). Larvae assayed were derived from the parent lines or the crosses indicated in the inset.
We further tested transmission of the tolerance trait to the F1 generation by performing reciprocal crosses in the H0/H20 pair as described above for the wild strains. Analogous to the wild strains, a pattern of autosomal dominance for the MeHg tolerance trait was seen in the F1 generation of the H20 × H0 line crosses (Fig. 4). It is of note that the laboratory-selected strains exhibited a more robust MeHg tolerance than the wild-derived tolerant strains, which suggests some heterosis for tolerance in the synthetic strains compared with inbred strains (compare RIH12 and H20 in Figs. 3 and 4, respectively).
Transcript Profiling of MeHg Tolerance in the Developing Nervous System
The large tolerance difference between the three selection strains and three control strains is ideal for exploring the genetic basis of the MeHg tolerance trait. With the goal of identifying candidate MeHg tolerance genes, we have taken the approach of whole-genome transcript profiling using Affymetrix GeneChips. Our overall hypothesis is that MeHg tolerance is conferred by differences in transcription levels of genes that act individually, or in concert, to avert the toxicity of MeHg. It is predicted that MeHg tolerance can arise by numerous possible combinations of transcript levels. Therefore, a simple pairwise comparison of steady state transcript levels of three replicates of tolerant and nontolerant fly strains is not anticipated to distinguish differentially expressed MeHg tolerance genes from differential expression because of natural variation between two strains. We therefore tested the transcriptional response to the stressor (MeHg) by measuring transcript levels in tolerant and nontolerant lines both “on” and “off” MeHg following an experimental design seen in Figure 5. This factorial design (+/−selection and +/−MeHg exposure) would allow us to dissect the interaction between evolved and induced responses to MeHg tolerance. In addition, we restricted our analysis to transcripts in the third instar larval brain. Our rationale for investigating this tissue is the preferential susceptibility of developing neural tissue for MeHg toxicity (Clarkson and Magos, 2006).
FIG. 5.
Experimental design to study the transcript profiling of MeHg tolerance. Replicate selection and control strains were derived by rearing a starting population on either MeHg or control food (see “Materials and Methods” section) to generate six new lines (E0, F0, and H0 nontolerant; E20, F20, and H20 tolerant). Treatments for transcript profiling were done by feeding larvae of each of these lines (± 15μM MeHg, see “Materials and Methods” section). The nontolerant and tolerant groupings are referred to as S0 and S20, respectively.
The set of 12 GeneChips met Affymetrix quality criteria based on presence calls, scale factors, background, and 3′:5′ ratios. The probe set × sample expression matrix exhibited a treatment effect (p = 0.002) based on a robust nonparametric method (unweighted multiresponse permutation procedure, Mielke and Berry, 2007, based on the Euclidean distance function). Parametric methods sufficed to identify genes differentially expressed for four of five contrasts investigated at a false discovery threshold of 0.05 (data not shown).
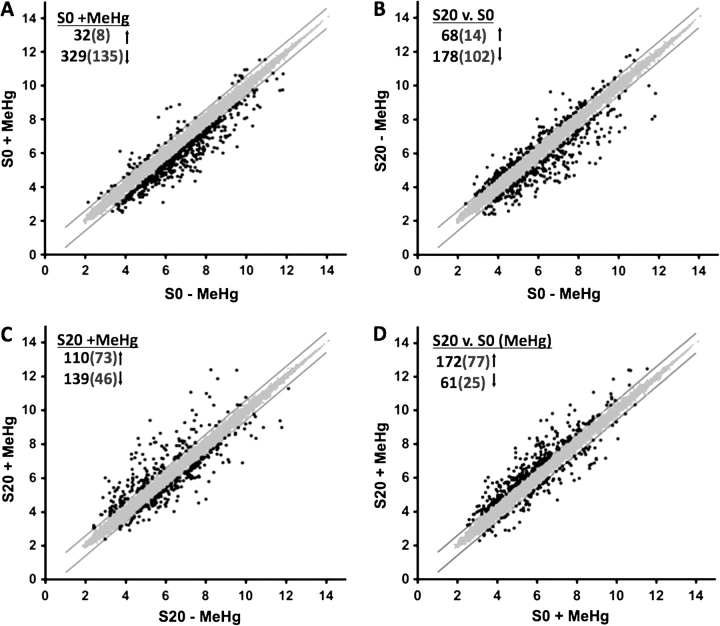
To simplify discussion of the microarray results, the following nomenclature was adopted: S0 pertains to the grouping of the three nonselected strains (E0, F0, and H0) and S20: the grouping of the three selection line replicates (E20, F20, and H20) (see Fig. 5). Four pairwise comparisons were made with the data set: (1) S0 in the presence versus absence of MeHg (S0 + MeHg), (2) S20 versus S0 in the absence of MeHg (S20 vs. S0), (3) S20 in the presence versus absence of MeHg (S20 + MeHg), and (4) S20 versus S0 in the presence of MeHg (S20 vs. S0, MeHg). We first assessed the global changes under each of these pairwise comparisons using the criteria of ≥ 1.5-fold change with a p value of ≤ 0.05. The fold change values of these genes are presented in Supplementary table 3. The overall transcript changes are represented in scatter plots in Figure 6. We find that MeHg exposure to the S0 strains results in a change in 361 transcripts with over 90% of these being downregulated (Fig. 6A). Comparison of basal expression in the S20 versus the S0 strains shows a change in 246 transcripts, with the majority (72%) downregulated because of selection in the S20 (Fig. 6B). MeHg exposure in the S20 strains shows 249 transcripts change; however, 44% of these are upregulated (Fig. 6C). Expression levels between the S20 and S0 strains in the presence of MeHg stress show 233 transcripts differ with a majority (74%) of these genes being upregulated in the S20 strain compared with the S0 strain (Fig. 6D). Thus, relative to the nonselected population (S0), we observe an overall trend in the transcript profile we describe as “down-down-up,” i.e., “down” by MeHg exposure, “down” by selection, and “up” by selection + MeHg exposure.
FIG. 6.
Global changes in transcripts with selection and MeHg exposure. Scatter plots illustrating the pairwise comparisons of the entire probe set intensity data using the criteria of ≥ 1.5-fold change (black dots, 1.5-fold boundary marked by solid lines) and p ≤ 0.05. (Axes values are log2 of probe intensity.) (A) MeHg exposure to S0 strain leads to differential expression of 362 transcripts with the majority (90%) downregulated. (B) Basal expression in the S20 versus S0 strains shows a change in 246 transcripts and majority of them (72%) are downregulated in the S20 because of selection. (C) MeHg exposure in S20 strains shows differential expression of 249 transcripts with 44% upregulated. (D) S20 versus S0 upon MeHg exposure shows differential expression of 233 transcripts with 74% showing upregulation. (Values in the parentheses are differential expression with ≥ twofold change and p value ≤ 0.05.).
The highly polarized pattern of this expression profile is even more apparent when a more stringent threshold of twofold change is applied (values in parentheses in Fig. 6). Relative to basal expression in S0, MeHg treatment results in 94% of transcripts downregulated (Fig. 6A) and selection gives 88% of transcripts downregulated (Fig. 6B). In contrast, MeHg treatment of the S20 strains gives 61% of transcripts upregulated (Fig. 6C) and more than 75% of transcripts upregulated compared with the S0 strains under MeHg stress (Fig. 6D). This global change in transcript profile indicates that MeHg tolerance is likely conferred by a preferential upregulation of expression of a distinct set of genes.
Unexpectedly, we find that of the 110 genes that are upregulated by MeHg exposure in the S20 group, nearly half of these (52 genes [47%]) are downregulated by MeHg exposure in the control S0 group (Fig. 7A). Furthermore, of these same 110 genes upregulated by MeHg in the S20 group, more than half of these (63 genes [57%]) are downregulated by the selection process (i.e., S20 vs. S0 in the absence of MeHg, Fig. 7B). Forty-nine genes are shared between these sets of downregulated genes, indicating that alleles of these genes in the S0 group that respond to MeHg with downregulation are replaced by alleles that constitutively express at lower levels as a result of selection in the S20 group. Even more striking is the apparent “reversal” of transcriptional response to MeHg that distinguishes the nonselected versus selected alleles of these 49 genes. This polarized transcriptional response presents an effective screening tool for these alleles in wild populations.
FIG. 7.
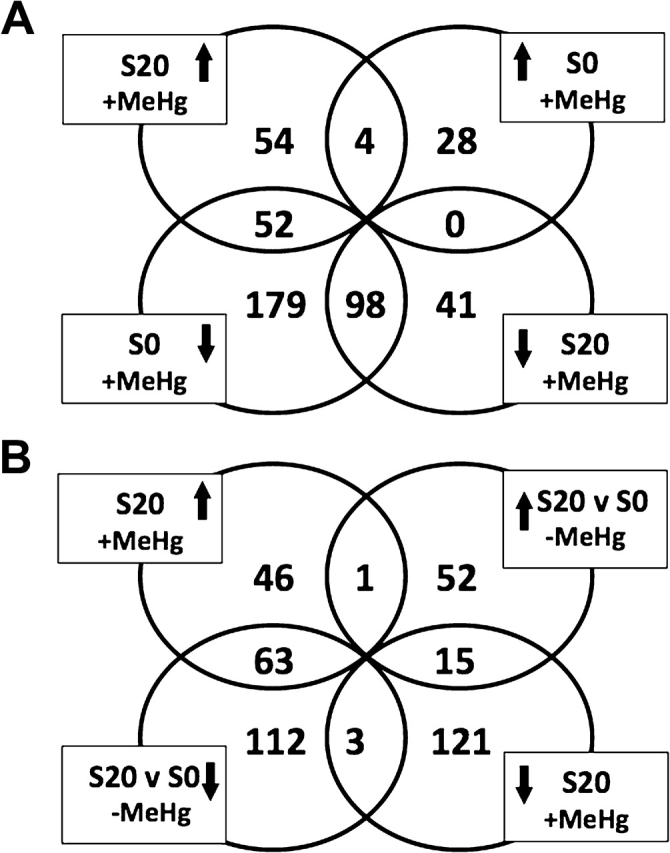
Overlap of transcript changes in S20 and S0 strains in the presence and absence of MeHg. (A) Comparison of S20 treated with MeHg and S0 treated with MeHg. Of the 110 genes upregulated in S20 upon MeHg exposure, 52 are otherwise downregulated in S0 treated with MeHg. (B) Comparison of S20 treated with MeHg and S20 versus S0 (no MeHg). Of the 110 genes that are upregulated in S20 upon MeHg stress, 63 are otherwise downregulated by selection.
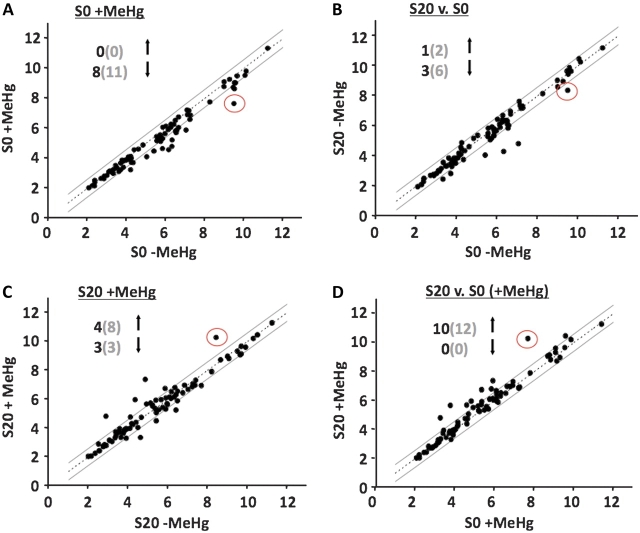
In an attempt to identify candidate genes associated with the MeHg tolerance trait, we performed an annotation cluster analysis of the 233 genes that show differential expression between S20 versus S0 with MeHg present using DAVID (Dennis et al., 2003). This analysis showed a highly significant enrichment for the monooxygenase/oxidoreductase functional category (Supplementary table 2, enrichment 4.01, p < 5.3 × 10⁻¹¹). Numerous CYP genes contribute to this score. In addition, this enrichment score was maintained within the group of 172 upregulated transcripts alone (data not shown). CYPs form a superfamily of genes that are ubiquitous enzymes central to phase I metabolism of a wide variety of xenobiotics. We therefore investigated the changes of expression in the CYP family of genes. In Drosophila, there are 90 CYP genes with 84 of these represented by probes on the Affymetrix Genome 2 chip. The overall changes in CYP transcript levels under the four pairwise comparisons can be seen in Figure 8. Ten CYP genes are upregulated in S20 versus S0 in the presence of MeHg (≥ 1.5-fold change, p value of ≤ 0.05, Fig. 8D). No CYPs are downregulated in this comparison. In contrast, only downregulation of CYPs is seen with the S0 strain in the presence of MeHg (Fig. 8A). As well, the S20 strain shows downregulated CYP expression compared with S0 in the absence of MeHg (Fig. 8B). With MeHg treatment of the S20 strain, four CYPs are upregulated and three are downregulated (Fig. 8C). Thus, the overall trend of transcript changes seen in the CYP family of genes adheres to the down-down-up profile elucidated above.
FIG. 8.
Overall changes in CYP transcripts. Scatter plots illustrating the pairwise comparisons of the CYP family probe set intensity data using the criteria of ≥ 1.5-fold change (boundary marked by solid lines) and a p value of ≤ 0.05. (Axes values are log2 of probe intensity.) (A) MeHg exposure to S0 strains leads to differential expression of eight transcripts with all being downregulated. (B) Basal expression in the S20 versus S0 strains shows a change in four transcripts and majority of them are downregulated. (C) MeHg exposure in S20 strains shows differential expression of seven transcripts with a majority being upregulated. (D) S20 versus S0 both with MeHg exposure shows differential expression of 10 transcripts with all being upregulated. CYP6g1 (red circle) is the most highly expressed and the strongest responder to selection + MeHg exposure. (Values in the parentheses are total number of CYP probes with ≥ 1.5-fold change irrespective of p value.).
Of the 10 upregulated CYP genes, CYP6g1 shows the maximum fold change. In the S20 group, CYP6g1 is upregulated 3.8-fold by MeHg and 6.2-fold in S20 versus S0 (+ MeHg) (Fig. 8C and 8D and Supplementary table 3). In the S0 group, CYP6g1 is knocked down 3.5-fold by MeHg (Fig. 8A and Supplementary table 3). CYP6g1 is also expressed 2.1-fold lower in the S20 lines relative to the S0 strain without MeHg exposure (Fig. 8B and Supplementary table 3); however, the latter does not reach the < 0.05 significance level (p = 0.067). Thus, CYP6g1 transcript levels follow the overall down-down-up profile. The fact that CYP6g1 is the most highly expressed CYP undergoing change in expression makes it a good candidate for validating the array data using qPCR and also for probing for the polarized expression pattern in response to MeHg among wild-derived tolerant and nontolerant fly lines.
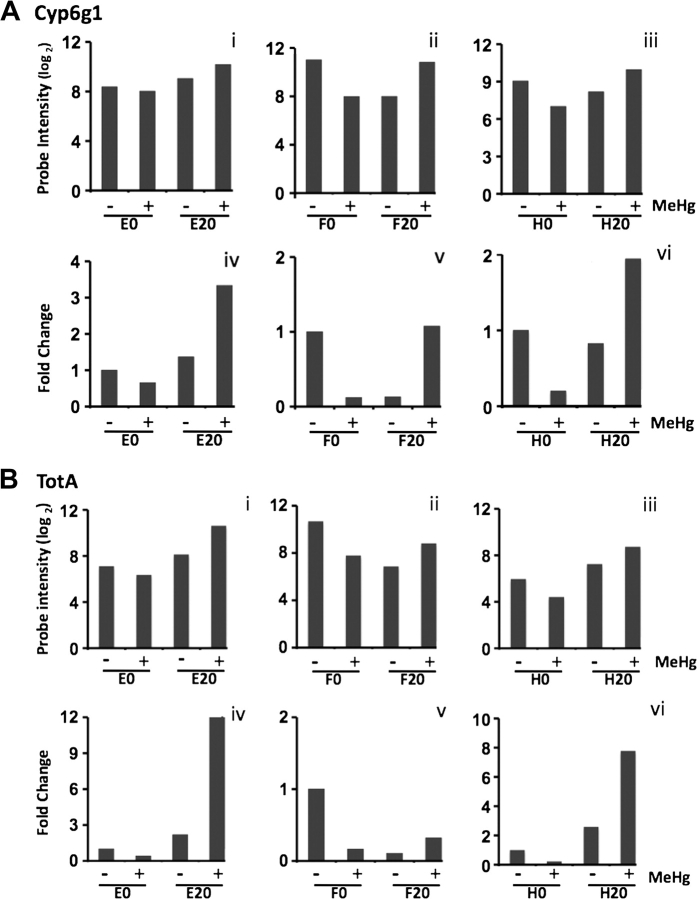
To validate the microarray data using qPCR, we selected genes to analyze by the criteria of (1) overall robust upregulation of expression in the S20 strain and (2) adherence to the overall trend of down-down-up expression profile. In addition, we considered whether functional annotation was available for the genes and whether they were functionally associated with stress response. The list of genes analyzed and the bulk of the qPCR results can be seen in the Supplementary figures 3A–H. Shown here are results for two genes, CYP6g1 and TotA, the latter being the most highly upregulated gene with selection + MeHg. Each of the three strains within each group (S0 and S20) were analyzed for microarray probe intensity (expressed in log2 scale) and compared with qPCR signal (expressed as fold change relative to the control strain). For simplicity, pairwise comparison of E0/E20, F0/F20, and H0/H20 are presented despite each strain being raised independently of each other and comparisons of, e.g., E0 with F20 or E0 and H20 are equally relevant. (It should be noted that statistical characterization of the selection process [e.g., S0 vs. S20] accounted for all pairwise comparisons of individual selected and nonselected strains [see “Materials and Methods” section].) For CYP6g1, the overall trend of down-down-up can be seen in the probe intensity data (Fig. 9A). A strong correlation between the microarray data and qPCR analyses is apparent with both CYP6g1 and TotA. TotA exhibits a slightly varied profile across the three replicates. Comparison of E0/E20 and H0/H20 demonstrates the exceptionally high upregulation of TotA in the selection + MeHg (Figs. 9Biv and 9Bvi). Although comparison of F0/F20 adheres to the down-down-up profile, it demonstrates a lower relative expression in the F20 with MeHg (Fig. 9Bv). This latter comparison is largely influenced by the unusually high basal expression of TotA in the F0 line (see the microarray probe intensity; see Fig. 9Bii). Nonetheless, in all cases, the nonselected strains respond to MeHg with downregulation of CYP6g1 and TotA, whereas the selected strains respond to MeHg with an upregulation of these two genes. Strong agreement of the probe intensity and qPCR expression level was seen across eight additional genes, thus confirming the overall validity of the microarray results (Supplementary figures 3A–H). As well, the profile of “down” in the nonselected strains and “up” in the selected strains in response MeHg is seen for all these genes (Supplementary figures 3A–H).
FIG. 9.
Validation of microarray data by qPCR. Microarray probe intensity (log2) of Cyp6g1 (Ai–iii) and TotA (Bi–iii) with (+) and without (−) MeHg exposure (15μM). Relative transcript levels (fold change relative to −selection/−MeHg) of Cyp6g1 (Aiv–vi) and TotA (Aiv–vi) determined by qPCR using the same RNA samples used for the microarray.
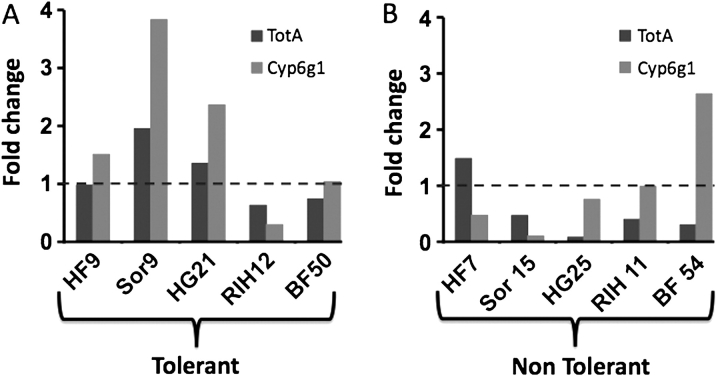
To confirm that laboratory selection yielded isolation of relevant tolerance genes, we asked whether CYP6g1 and TotA expression in wild-derived nontolerant and tolerant strains shows a similar “down” versus “up” response to MeHg. We analyzed transcript levels of TotA and CYP6g1 in the larval brains of five tolerant lines and five susceptible lines from the isolines lines analyzed in Figure 2. In three of the five tolerant strains (HF9, Sorrel9, and HG21) CYP6g1 expression is seen to increase upon MeHg exposure (Fig. 10A). TotA expression is also increased in two of these lines (Sorrel9 and HG21) and unchanged in a third (HF9) (Fig. 10A). In contrast, CYP6g1 and TotA expression is repressed in three and four of the nontolerant strains, respectively, in response to MeHg exposure (Fig. 10B). As a whole, the data support the general trend that MeHg tolerance is positively correlated with the direction of change in expression of CYP6g1 and TotA in response to MeHg exposure.
FIG. 10.
Relative transcript levels of TotA and Cyp6g1 in wild-derived tolerant and nontolerant strains. The fold change of TotA and CYP6g1 expression determined by qPCR upon exposure to 15μM MeHg in larval brains is shown. Five tolerant (A) and nontolerant (B) strains were analyzed and presented. (No-change level indicated by dotted line.).
Induction of MeHg Tolerance with TotA Overexpression
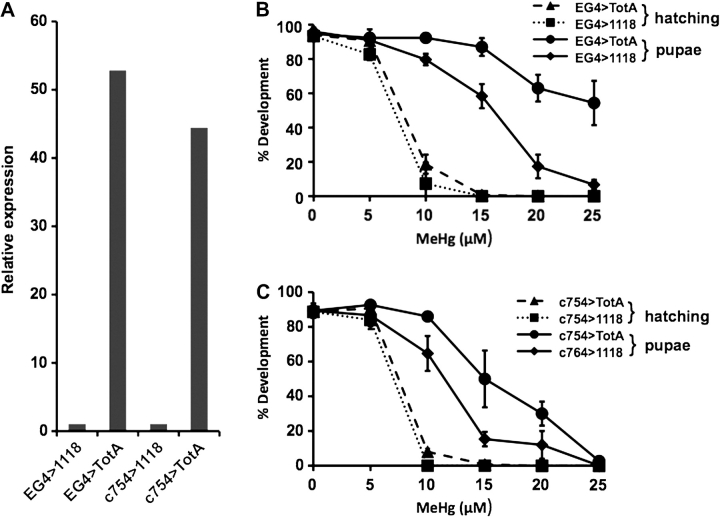
Transcriptional profiling results suggest that upregulated expression of a limited cohort of genes is capable of inducing MeHg tolerance. To test the possibility that individual genes in this cohort are capable of invoking MeHg tolerance, we turned our attention to TotA, which shows the greatest relative upregulation (9.2-fold) with selection + MeHg (Supplementary table 3). TotA is a previously described humoral response gene that is turned on in response to a number of stressors, including heat shock and bacterial infection (Ekengren and Hultmark, 2001). TotA expression in metal toxicity has not been investigated nor has the functional activity of TotA been described. However, TotA overexpression has been shown to increase longevity of flies exposed to heat stress (Ekengren and Hultmark, 2001). We therefore tested whether TotA can functionally support MeHg tolerance. Using the conventional Gal4-UAS system of gene expression (Brand et al., 1994), we overexpressed TotA specifically in the nervous system using crosses of the elav-Gal4 neural-specific driver and UAS-TotA responder (EG4 > TotA). Control crosses employed the standard w1118 laboratory strain in place of the UAS responder (EG4 > 1118). Expression of TotA in the larval brain was enhanced more than 50-fold with the EG4 > TotA combination compared with control crosses (Fig. 11A). Development and eclosion of TotA overexpressing larvae was then assayed. We observed no significant increase in the rate of eclosion of adults in the EG4 > TotA flies as compared with the EG4 > 1118 flies (Fig. 11B, dotted/dashed lines), indicating that TotA alone does not induce robust MeHg tolerance. However, we observed that a significant fraction of the EG4 > TotA larvae progressed to a late stage of pupal development as determined by formation of dark pupae in the vials. Extracting these pupae from their cases revealed that normal metamorphosis had occurred as determined by the presence of complete adult eye, wing, and bristles structures (data not shown). In contrast, the EG4 > 1118 larvae showed a marked deficit in development of the pupae (i.e., higher proportion of “white” incompletely metamorphosed pupae). When scored as the number of larvae reaching or surpassing the dark pupae stage, the data demonstrate significantly enhanced MeHg tolerance in the TotA overexpressing flies (Fig. 11B, solid lines). To confirm this effect, we examined TotA expression by an additional Gal4 driver line. Using the c754Gal4 driver that expresses predominantly in the fat body of the larvae (Hrdlicka et al., 2002), we observe a similar overexpression of TotA (∼45-fold, Fig. 11A). As well, tolerance to MeHg was observed through the greater number of dark pupae that resulted at the 10 to 20 μM Melts Treatments (Fig. 11C). Together, these data demonstrate an activity for TotA in mechanisms of MeHg tolerance.
FIG. 11.
Transgenic expression of TotA induces MeHg tolerance. (A) Relative levels of TotA expression (by qPCR) under Gal4-driven expression in the nervous system (EG4 > TotA) or whole larvae (c754G4 > TotA) compared with controls (EG4 > 1118 and c754G4 > 1118, respectively). (B–C) Developmental tolerance to MeHg determined in TotA overexpressing larvae. Tolerance was determined by eclosion (dashed/dotted lines) or completion of development to the dark pupal stage (solid lines). TotA expression was driven in the nervous system (EG4 > TotA, B) or in the fat bodies (c754G4 > TotA, C) and development compared with controls (EG4 > 1118 and c754G4 > 1118, respectively) (bars = SD of three determinations, n = 150).
Additional Candidate MeHg Tolerance Genes
Analysis of functional annotation clusters identified few additional clusters with significant enrichment scores among the 233 genes that change in the S20 versus S0 (+ MeHg) comparison. The next most significant cluster contained glycoproteins/secreted/signal peptide proteins with an enrichment score of 3.69 (p < 2.4 × 10⁻⁷) (Supplementary table 2). A notable gene in this group is persephone (up 2.1-fold), a serine protease that is responsible for activation of the Toll pathway in an antifungal defense mechanism in flies (Ashok, 2009). It is interesting to note that 14 genes are allocated to a cluster of defense response/humoral response/immune response, which carries a low enrichment score (enrichment 1.87, p = 2.0 × 10⁻⁴) (Supplementary table 2). Nonetheless, in this group are genes of note, particularly persephone, thor, serpent, GSH S-transferase D3 (GSTD3), and UDP-glucoronysyltransferase (ugt86Di). Thor (up 1.5-fold) is a eukaryotic initiation factor 4E-binding protein (4E-BP) also involved in antibacterial humoral response and response to oxidative stress (Levitin et al., 2007). Serpent (up 1.9-fold) is a transcriptional regulator that controls hematopoeisis (Waltzer et al., 2002).
GSTD3 and ugt86Di are both proteins that function in phase II xenobiotic metabolism. GSTs and UGTs cooperate with the phase I activity of CYPs by conjugating xenobiotics with small molecules that aid in clearance from the cell (Smart and Hodgson, 2008). There are 21 GST family members represented on Affymetrix Drosophila Genome 2.0 GeneChips. Two GST members GSTE3 and GSTD3 are upregulated 2.3- and 1.6-fold, respectively (p < 0.005), in selection + MeHg (Supplementary table 3). A third GST (GSTE7) is upregulated 1.6-fold with marginal significance (p = 0.068, Supplementary table 3). ugt86Di is one of 18 UDP-glycosyltransferases represented on the Affymetrix GeneChip and is upregulated fourfold with selection + MeHg (Supplementary table 3). However, a second UGT (ugt86Dd) is downregulated 1.7-fold in the same comparison (Supplementary table 3). It is interesting to note that the elevated expression of GSTD3, GSTE3, and GSTE7 is also maintained in the S20 strains compared with the S0 strains in the absence of MeHg (Supplementary table 3), indicating that these genes are selected for a higher steady state expression.
An additional candidate identified by its adherence to the down-down-up profile is alcohol dehydrogenase (ADH). ADH shows 4.8-fold lower expression in S20 than S0 without MeHg and 3.0-fold lower expression in S0 when treated with MeHg (Supplementary table 3). S20 treated with MeHg results in a 2.8-fold upregulation of ADH and accounts for an overall 1.8-fold higher expression of ADH in the selection + MeHg comparison (Supplementary table 3).
Several additional potential candidates showing transcriptional change with selection and MeHg exposure were identified and are summarized in tables presented in Supplementary table 3.
DISCUSSION
Few studies have investigated a genetic basis for MeHg toxicity in a multicellular organism. Here, we have exploited the power of a small organism model, Drosophila, in a toxicogenomic approach to characterizing mechanisms of MeHg toxicity. Using wild-derived and laboratory-selected Drosophila strains, we have demonstrated that MeHg tolerance is an autosomal-dominant trait, in complete agreement with studies initially carried out by Magnusson and Ramel (1986). Furthermore, we have identified several potential MeHg tolerance gene candidates by virtue of the profile of transcript changes across the whole genome in response to MeHg alone, selection alone, and selection + MeHg, respectively. Remarkably, we found that MeHg tolerance corresponded with gene expression changes that were predominantly upregulated in response to MeHg stress. The most salient candidates among these are the TotA gene and CYP gene family members, the former proving to be functional in inducing MeHg tolerance in our model.
Global Transcript Changes Define a MeHg Tolerance Signature
We observe an unexpected down-down-up profile in global expression changes of transcripts. It is therefore interesting to speculate the generality of the down-down-up response in stress response among tolerant and nontolerant individuals. One possible explanation for this profile is that resistance may be costly, so selection for resistance may impose a cost that is opposite to what one gets under exposure to the stressor (MeHg). In short, flies that maintain a high level of expression when it is not needed will not be favored under selection culture. In contrast, naive flies that maintain a low less costly level of expression, and can mount a rapid induction of expression for resistance, will be favored by selection.
To our knowledge, this is the second study to assess the whole transcriptome in flies under the individual and combined effects of stressors and selection for tolerance. Sorensen et al. (2005, 2007) performed whole-genome expression analyses of heat-resistant and control strains of flies under normal and heat-shock conditions. Genes identified as critically involved in the heat resistance trait did not show a corollary down-down-up profile. However, fundamental differences in experimental design between our study and that of Sorensen et al. (2005, 2007) may preclude a relevant comparison. For instance, we opted to examine transcript expression exclusively in the nervous system in contrast to the whole-organism transcript analyses performed by Sorensen et al. (2005, 2007). Nonetheless, both approaches have proven to identify a discrete set of candidate genes involved in a complex stress response.
A Potential Role for TotA in MeHg Tolerance
TotA showed the most robust upregulation with selection + MeHg and also confers MeHg tolerance with transgenic overexpression in flies. TotA is a humoral response factor with no obvious homologue in humans. However, TotA is characterized as a definitive downstream target of the JAK/STAT pathway in response to septic injury in flies (Agaisse et al., 2003). TotA expression is highly responsive to levels of Relish (a Nf-κB homologue) and the MAPK kinase kinase, Mekk1, two conserved pathways for immune signaling and environmental stress response, respectively (Agaisse et al., 2003; Brun et al., 2006). Our overexpression results highlight the potential activity of TotA to resist MeHg toxicity. TotA is one of eight Tot family members that encode proteins of 11–14 kDa. Interestingly, of the seven Tot genes identified on the microarrays, only TotA shows transcriptional response to either, or both, selection and MeHg, supporting the notion that TotA is uniquely engaged in conferring MeHg tolerance. TotA is preferentially expressed in the late larval through the pupal stages in normal development (Ekengren and Hultmark, 2001), consistent with the idea that it functions during these developmental stages to support eclosion. One possibility is that MeHg acts to diminish TotA expression in normal flies, thus the upregulation of TotA in response to MeHg in tolerant flies is a compensatory mechanism to sustain normal development. Although the function of TotA, and its regulation by MeHg, remains to be resolved, the fact that TotA is a robust responder to immune signaling pathways implicates these pathways as MeHg targets. Several studies point to the effects of mercury and methylmercury on immune system function (Belles-Isles et al., 2002; NRC, 2000; Shenker et al., 2002). The robust response of TotA transcription in MeHg tolerance selection seen here presents an inroad to investigate the highly conserved JAK/STAT, Nf-kB, and MEKK signaling pathways as MeHg targets in flies and translates the findings to higher organisms.
Elevated CYP Gene Expression Implicated in MeHg Tolerance
A notable finding is the upregulated expression of CYP genes with Selection + MeHg. CYPs are known for their role in biotransformation of xenobiotics, particularly in drug metabolism. CYPs carry out phase I (functionalization) reactions, which precede phase II (conjugating) reactions, the latter being executed by a variety of enzyme classes, including GSTs and UGTs (Iyanagi, 2007; Smart and Hodgson, 2008). CYP6g1, the most highly expressed CYP with selection + MeHg, presents an interesting MeHg tolerance candidate. A single allele of CYP6g1 has been identified as the dichlorodiphenyl trichloroethane (DDT) resistance (DDT-R) gene in Drosophila (Daborn et al., 2002). Initial characterization of this allele correlated DDT-R with unusually high expression of CYP6g1 compared with DDT-susceptible strains (Daborn et al., 2002). Further characterization of CYP6g1 has demonstrated its ability to confer resistance to several classes of pesticides (Daborn et al., 2007), suggesting that it metabolizes a broad range of xenobiotics. Additional Drosophila CYPs are able to confer pesticide resistance with overexpression (Daborn et al., 2007), including CYP12d1, which is also upregulated by selection + MeHg in our model. The potential role for CYPs in MeHg resistance in an organism has not been explored. Biochemical evidence indicates that MeHg is effective in degrading and inhibiting CYP activity in liver microsomes (Lucier et al., 1973). Thus, the tolerance trait seen here may reflect a compensatory upregulation of CYP expression with MeHg exposure. On the other hand, early investigations of MeHg metabolism in rodents and primates have established that biotransformation resulting in demethylation of MeHg occurs in vivo, particularly in kidney and liver (Norseth and Clarkson, 1970). This is supported by the documented activity of liver microsomes (containing CYP activity) to demethylate MeHg in vitro (Suda and Hirayama, 1992). Although transition of MeHg to inorganic Hg++ has been interpreted to be unfavorable for the brain, it may be beneficial for ultimate clearance of mercury via excretion in the kidney. These unresolved biochemical studies together with our genetic evidence warrant a more in-depth investigation of the specific activity of CYPs in the context of MeHg tolerance and susceptibility.
Additional MeHg Tolerance Candidates
We see that several other enzymes related to xenobiotic metabolism are upregulated with selection + MeHg. These include the phase I enzyme ADH and the phase II enzymes GSTs and UGTs. As with the CYPs, a potential role for ADH and UGTs in MeHg tolerance has not been investigated. However, it is well known that GSH complexes with MeHg and mediates its excretion (Ballatori and Clarkson, 1983). The role of GST in supporting MeHg excretion has been suggested by association of a human GST polymorphism (GSTP1) with higher MeHg retention in erythrocytes (Custodio et al., 2004; Schlawicke Engstrom et al., 2008). In previous studies, we have demonstrated that overexpression of GCLc, a component of the GSH synthesis enzyme, in Drosophila embryos enhances tolerance to MeHg (Rand et al., 2009). Recent studies have highlighted the GST pathway in tolerance to other metals. Interestingly, one such study has utilized mapping (via chromosomal segregation and microsatellite marker–based recombination) of an arsenic tolerance trait in Drosophila as means to elucidate the role of GSH synthesis pathway (Ortiz et al., 2009). Overall, our data reinforce existing evidence that conventional enzymes in xenobiotic metabolism are functional in MeHg tolerance.
We have intentionally focused on transcripts that follow the down-down-up expression profile with the rationale that these genes are the most robust responders to selection and exposure to MeHg. Other profiles of expression within the data set likely contribute to the tolerance trait. For example, 48 genes show elevated expression because of selection alone, but these genes do not respond to MeHg exposure in either the S0 or the S20 lines. MeHg tolerance may ensue from constitutive expression of these genes, and further analysis of these candidates is warranted. Functional annotation analysis does not indicate a significant enrichment group among these 48 genes (data not shown). We predict that additional genetic approaches, e.g., using quantitative trait loci (QTL) analyses, will be required to narrow this pool to the most relevant MeHg tolerance candidates.
MeHg Tolerance Is Independent of Transcript Changes in Conventional Stress Genes
One finding of interest is the lack of change in known stress response genes that have previously been shown to respond to MeHg. For example, metallothionein (Mtn) genes have been shown to respond to and alleviate MeHg toxicity in a number of in vitro and in vivo models (Gonzalez et al., 2005; Leiva-Presa et al., 2004; Yao et al., 1999, 2000). We find no significant change in expression levels of all four Mtn genes because of MeHg exposure or selection in this data set. It is also of note that there is no significant upregulation in the heat-shock proteins (Hsp) under selection + MeHg exposure. Rather, Hsp68 responds to MeHg exposure in the S0 and S20 groups by more than 1.5-fold reduction (see Supplementary table 3). This is in contrast to our own expression data in Drosophila embryos where MeHg exposure gives pronounced upregulation of Hsp70Ba and Hsp70Ab genes (Bland and Rand, 2006). Although it has been widely demonstrated that Hsps are often upregulated in response to a diverse set of stressors, it has also been shown that selection for heat-shock resistance results in an undifferentiated expression of heat-shock genes in response to heat shock between selected and nonselected flies (Nielsen et al., 2006). In addition, expression of some heat-shock responsive genes is known to be transient, spiking soon after induction of stress but resolving to baseline expression at later time points (Sorensen et al., 2005). Our samples are taken after a chronic exposure and thus the window of dynamic Hsp expression may be missed in this analysis. Nonetheless, these data indicate that the MeHg tolerance trait in our system is not supported by sustained elevation of Hsp induction with MeHg stress.
Considerations for Future Toxicogenomic Approaches
Alternative methods for establishing mixing of genetic information in founder populations may prove more optimal than that we have employed here. Other methods include concerted mating schemes of individual lines as has been done with mouse strains (e.g., A × B, C × D, … , Y × Z for the first round, then F1(A × B) × F1(Y × Z), F1(C × D) × F1(W × X), etc.). In this study, we have opted to use an available founder population that had been derived through an interbreeding mass population. Our goal was to maximize the number of alleles present in the population. Thus, starting with > 100 wild lines, and assuming that many of the loci are still segregating variation within each line, many more than 100 alleles per locus will be present, providing a broad base of variation from which to select. Also, the large number of founding lines provides many different haplotypes of variation across each chromosomal region and reduces initial linkage disequilibrium in the source population. Coupled with more than 20 generations of recombination in a swarm in the laboratory, this provides a diverse population with low linkage problems and allows individual loci to respond to selection independently rather than merely hitchhiking along with linked loci.
We have investigated MeHg tolerance with a transcriptome profiling approach. Additional power for identifying tolerance genes can be rendered through conventional QTL analyses and through expression QTLs (eQTLs). In these approaches, several recombinant inbred lines of flies (or mice) are characterized for a tolerance phenotype and loci that affect the trait are effectively mapped (MacKay, 2001). QTL analyses have the advantage of assuming no a priori class of genes to be identified in a genome-wide scan. eQTLs have the added power of identifying master regulatory regions of the genome that control gene expression in relation to the trait (Ruden et al., 2009). Such approaches are well suited for analyses of complex traits, e.g., thermotolerance and heat stress response. The eQTL approach has proven highly effective in identifying coregulated genes in lead toxicity in flies, many of which are classified as neural developmental genes (Ruden et al., 2009). We predict that combined transcriptome and QTL approaches will prove even more highly tuned to identifying genes underlying complex behavioral and toxicological traits. At present, Drosophila present the most pragmatic model to execute these studies. We predict that the toxicology community will benefit greatly from adopting such uniquely powerful alternative model approaches.
In summary, in this study we have identified candidate genes for a MeHg tolerance trait using Drosophila. Transcriptional response patterns point to TotA and CYPs (CYP6g1) as the most prominent candidates. We have identified several additional potential tolerance genes by virtue of their robust upregulated expression with selection + MeHg exposure. Furthermore, we have demonstrated the utility of exploiting Drosophila for whole-genome approaches to identifying genes acting in MeHg tolerance mechanisms.
SUPPLEMENTARY DATA
Supplementary data are available online at http://toxsci.oxfordjournals.org/.
FUNDING
National Institute of Environmental Health Science R01-ES015550 awarded to M.D.R.
Supplementary Material
Acknowledgments
We wish to thank Tim Hunter and Scott Tighe of the Microarray Facility at the University of Vermont for excellent execution of the GeneChip analyses. We thank Julie Dragon for discussions of probe set analysis. We thank members of the Rand Lab, Julie Dao and Greg Engel, for review and discussion of the data and the manuscript. We thank Rebecca Kriepke for technical assistance. We are grateful to Dan Hultmark (Umeå University, Sweden) for the generous sharing of UAS-TotA flies.
References
- Agaisse H, Petersen UM, Boutros M, Mathey-Prevot B, Perrimon N. Signaling role of hemocytes in Drosophila JAK/STAT-dependent response to septic injury. Dev. Cell. 2003;5:441–450. doi: 10.1016/s1534-5807(03)00244-2. [DOI] [PubMed] [Google Scholar]
- Ashok Y. Drosophila toll pathway: the new model. Sci. Signal. 2009;2(52):jc1. doi: 10.1126/scisignal.252jc1. [DOI] [PubMed] [Google Scholar]
- Ballatori N, Clarkson TW. Biliary transport of glutathione and methylmercury. Am. J. Physiol. 1983;244:G435–G441. doi: 10.1152/ajpgi.1983.244.4.G435. [DOI] [PubMed] [Google Scholar]
- Belles-Isles M, Ayotte P, Dewailly E, Weber JP, Roy R. Cord blood lymphocyte functions in newborns from a remote maritime population exposed to organochlorines and methylmercury. J. Toxicol. Environ. Health. 2002;65:165–182. doi: 10.1080/152873902753396794. [DOI] [PubMed] [Google Scholar]
- Benjamin Y, Hochberg Y. Controlling the false discovery rate: a practical and powerful approach to multiple testing. J. R. Stat. Soc. 1995;B57:289–300. [Google Scholar]
- Bland CE, Rand MR. Methylmercury induces activation of Notch signaling. Neurotoxicology. 2006;27:982–991. doi: 10.1016/j.neuro.2006.04.005. [DOI] [PubMed] [Google Scholar]
- Bolstad BM, Irizarry RA, Astrand M, Speed TP. A comparison of normalization methods for high density oligonucleotide array data based on variance and bias. Bioinformatics. 2003;19:185–193. doi: 10.1093/bioinformatics/19.2.185. [DOI] [PubMed] [Google Scholar]
- Brand AH, Manoukian AS, Perrimon N. Ectopic expression in Drosophila. Methods Cell Biol. 1994;44:635–654. doi: 10.1016/s0091-679x(08)60936-x. [DOI] [PubMed] [Google Scholar]
- Brand AH, Perrimon N. Targeted gene expression as a means of altering cell fates and generating dominant phenotypes. Development. 1993;118:401–415. doi: 10.1242/dev.118.2.401. [DOI] [PubMed] [Google Scholar]
- Brun S, Vidal S, Spellman P, Takahashi K, Tricoire H, Lemaitre B. The MAPKKK Mekk1 regulates the expression of Turandot stress genes in response to septic injury in Drosophila. Genes Cells. 2006;11:397–407. doi: 10.1111/j.1365-2443.2006.00953.x. [DOI] [PubMed] [Google Scholar]
- Camon E, Magrane M, Barrell D, Lee V, Dimmer E, Maslen J, Binns D, Harte N, Lopez R, Apweiler R. The Gene Ontology Annotation (GOA) Database: sharing knowledge in Uniprot with Gene Ontology. Nucleic Acids Res. 2004;32:D262–D266. doi: 10.1093/nar/gkh021. [DOI] [PMC free article] [PubMed] [Google Scholar]
- Clarkson TW, Magos L. The toxicology of mercury and its chemical compounds. Crit. Rev. Toxicol. 2006;36:609–662. doi: 10.1080/10408440600845619. [DOI] [PubMed] [Google Scholar]
- Custodio HM, Broberg K, Wennberg M, Jansson JH, Vessby B, Hallmans G, Stegmayr B, Skerfving S. Polymorphisms in glutathione-related genes affect methylmercury retention. Arch. Environ. Health. 2004;59:588–595. doi: 10.1080/00039890409603438. [DOI] [PubMed] [Google Scholar]
- Daborn PJ, Lumb C, Boey A, Wong W, Ffrench-Constant RH, Batterham P. Evaluating the insecticide resistance potential of eight Drosophila melanogaster cytochrome P450 genes by transgenic over-expression. Insect Biochem. Mol. Biol. 2007;37:512–519. doi: 10.1016/j.ibmb.2007.02.008. [DOI] [PubMed] [Google Scholar]
- Daborn PJ, Yen JL, Bogwitz MR, Le Goff G, Feil E, Jeffers S, Tijet N, Perry T, Heckel D, Batterham P, et al. A single p450 allele associated with insecticide resistance in Drosophila. Science. 2002;297:2253–2256. doi: 10.1126/science.1074170. [DOI] [PubMed] [Google Scholar]
- Dennis G, Jr, Sherman BT, Hosack DA, Yang J, Gao W, Lane HC, Lempicki RA. DAVID: Database for Annotation, Visualization, and Integrated Discovery. Genome Biol. 2003;4:P3. [PubMed] [Google Scholar]
- Ekengren S, Hultmark D. A family of Turandot-related genes in the humoral stress response of Drosophila. Biochem. Biophys. Res. Commun. 2001;284:998–1003. doi: 10.1006/bbrc.2001.5067. [DOI] [PubMed] [Google Scholar]
- Gentleman RC, Carey VJ, Bates DM, Bolstad B, Dettling M, Dudoit S, Ellis B, Gautier L, Ge Y, Gentry J, et al. Bioconductor: open software development for computational biology and bioinformatics. Genome Biol. 2004;5:R80. doi: 10.1186/gb-2004-5-10-r80. [DOI] [PMC free article] [PubMed] [Google Scholar]
- Gonzalez P, Dominique Y, Massabuau JC, Boudou A, Bourdineaud JP. Comparative effects of dietary methylmercury on gene expression in liver, skeletal muscle, and brain of the zebrafish (Danio rerio) Environ. Sci. Technol. 2005;39:3972–3980. doi: 10.1021/es0483490. [DOI] [PubMed] [Google Scholar]
- Hrdlicka L, Gibson M, Kiger A, Micchelli C, Schober M, Schock F, Perrimon N. Analysis of twenty-four Gal4 lines in Drosophila melanogaster. Genesis. 2002;34:51–57. doi: 10.1002/gene.10125. [DOI] [PubMed] [Google Scholar]
- Huang LS, Myers GJ, Davidson PW, Cox C, Xiao F, Thurston SW, Cernichiari E, Shamlaye CF, Sloane-Reeves J, Georger L, et al. Is susceptibility to prenatal methylmercury exposure from fish consumption non-homogeneous? Tree-structured analysis for the Seychelles Child Development Study. Neurotoxicology. 2007;28:1237–1244. doi: 10.1016/j.neuro.2007.08.009. [DOI] [PMC free article] [PubMed] [Google Scholar]
- Iyanagi T. Molecular mechanism of phase I and phase II drug-metabolizing enzymes: implications for detoxification. Int. Rev. Cytol. 2007;260:35–112. doi: 10.1016/S0074-7696(06)60002-8. [DOI] [PubMed] [Google Scholar]
- Kaur P, Aschner M, Syversen T. Glutathione modulation influences methyl mercury induced neurotoxicity in primary cell cultures of neurons and astrocytes. Neurotoxicology. 2006;27:492–500. doi: 10.1016/j.neuro.2006.01.010. [DOI] [PubMed] [Google Scholar]
- Leiva-Presa A, Capdevila M, Cols N, Atrian S, Gonzalez-Duarte P. Chemical foundation of the attenuation of methylmercury(II) cytotoxicity by metallothioneins. Euro. J. Biochem. FEBS. 2004;271:1323–1328. doi: 10.1111/j.1432-1033.2004.04039.x. [DOI] [PubMed] [Google Scholar]
- Levitin A, Marcil A, Tettweiler G, Laforest MJ, Oberholzer U, Alarco AM, Thomas DY, Lasko P, Whiteway M. Drosophila melanogaster Thor and response to Candida albicans infection. Eukaryot. Cell. 2007;6:658–663. doi: 10.1128/EC.00346-06. [DOI] [PMC free article] [PubMed] [Google Scholar]
- Livak KJ, Schmittgen TD. Analysis of relative gene expression data using real-time quantitative PCR and the 2(-Delta Delta C(T)) Method. Methods. 2001;25:402–408. doi: 10.1006/meth.2001.1262. [DOI] [PubMed] [Google Scholar]
- Lucier GW, Matthews HB, Brubaker PE, Klein R, McDaniel OS. Effects of methylmercury on microsomal mixed-function oxidase components of rodents. Mol. Pharmacol. 1973;9:237–246. [PubMed] [Google Scholar]
- MacKay TFC. Quantitative trait loci in Drosophila. Nat. Rev. Genet. 2001;2:11–20. doi: 10.1038/35047544. [DOI] [PubMed] [Google Scholar]
- Magnusson J, Ramel C. Genetic variation in the susceptibility to mercury and other metal compounds in Drosophila melanogaster. Teratog., Carcinog. Mutagen. 1986;6:289–305. doi: 10.1002/tcm.1770060405. [DOI] [PubMed] [Google Scholar]
- Mielke PW, Berry KJ. Permutation Methods: A Distance Function Approach. 2nd ed. New York: Springer series in statistics. Springer; 2007. [Google Scholar]
- Morgan TJ, Mackay TF. Quantitative trait loci for thermotolerance phenotypes in Drosophila melanogaster. Heredity. 2006;96:232–242. doi: 10.1038/sj.hdy.6800786. [DOI] [PubMed] [Google Scholar]
- National Research Council (NRC) Toxicological Effects of Methylmercury. 2000. Health Effects of Methylmercury. (Committee on the Toxicological Effects of Methylmercury and National Research Council), Chapter 5, p. 158. National Academy Press, Washington, DC. [Google Scholar]
- Nielsen MM, Sorensen JG, Kruhoffer M, Justesen J, Loeschcke V. Phototransduction genes are up-regulated in a global gene expression study of Drosophila melanogaster selected for heat resistance. Cell Stress Chaperones. 2006;11:325–333. doi: 10.1379/CSC-207.1. [DOI] [PMC free article] [PubMed] [Google Scholar]
- Norseth T, Clarkson TW. Studies on the biotransformation of 203Hg-labeled methyl mercury chloride in rats. Arch. Environ. Health. 1970;21:717–727. doi: 10.1080/00039896.1970.10667325. [DOI] [PubMed] [Google Scholar]
- Ortiz JG, Opoka R, Kane D, Cartwright IL. Investigating arsenic susceptibility from a genetic perspective in Drosophila reveals a key role for glutathione synthetase. Toxicol. Sci. 2009;107:416–426. doi: 10.1093/toxsci/kfn192. [DOI] [PMC free article] [PubMed] [Google Scholar]
- Rand MD, Dao JC, Clason TA. Methylmercury disruption of embryonic neural development in Drosophila. Neurotoxicology. 2009;30:794–802. doi: 10.1016/j.neuro.2009.04.006. [DOI] [PMC free article] [PubMed] [Google Scholar]
- Ruden DM, Chen L, Possidente D, Possidente B, Rasouli P, Wand L, Lu L, Garfinkel MD, Hirsch HVB, Page GP. Genetical toxicogenomics in Drosophila identifies master-modulatory loci that are regulated by developmental exposure to lead. Neurotoxicology. 2009;30:898–914. doi: 10.1016/j.neuro.2009.08.011. [DOI] [PMC free article] [PubMed] [Google Scholar]
- Schlawicke Engstrom K, Stromberg U, Lundh T, Johansson I, Vessby B, Hallmans G, Skerfving S, Broberg K. Genetic variation in glutathione-related genes and body burden of methylmercury. Environ. Health Perspect. 2008;116:734–739. doi: 10.1289/ehp.10804. [DOI] [PMC free article] [PubMed] [Google Scholar]
- Shanker G, Syversen T, Aschner JL, Aschner M. Modulatory effect of glutathione status and antioxidants on methylmercury-induced free radical formation in primary cultures of cerebral astrocytes. Brain Res. Mol. Brain Res. 2005;137:11–22. doi: 10.1016/j.molbrainres.2005.02.006. [DOI] [PubMed] [Google Scholar]
- Shenker BJ, Pankoski L, Zekavat A, Shapiro IM. Mercury-induced apoptosis in human lymphocytes: caspase activation is linked to redox status. Antioxid. Redox Signal. 2002;4:379–389. doi: 10.1089/15230860260196182. [DOI] [PubMed] [Google Scholar]
- Smart R, Hodgson E. Structure Mechanism, and Regulation of Cytochromes P450. In: Smart R, Hodgson E, editors. Molecular and Biochemical Toxicology. Hoboken, NJ: John Wiley and Sons; 2008. p. 147. [Google Scholar]
- Smyth G. Limma: Linear Models for Microarray Data. In: Gentleman R, Carey VJ, Huber W, Irizarry R, Dudoit S, editors. Bioinformatics and Computational Biology Solutions Using R and Bioconductor. New York: Springer; 2005. pp. 397–420. [Google Scholar]
- Smyth GK. Linear models and empirical Bayes methods for assessing differential expression in microarray experiments. Stat. Appl. Genet. Mol. Biol. 2004;3 doi: 10.2202/1544-6115.1027. art 3. [DOI] [PubMed] [Google Scholar]
- Sorensen JG, Nielsen MM, Kruhoffer M, Justesen J, Loeschcke V. Full genome gene expression analysis of the heat stress response in Drosophila melanogaster. Cell Stress Chaperones. 2005;10:312–328. doi: 10.1379/CSC-128R1.1. [DOI] [PMC free article] [PubMed] [Google Scholar]
- Suda I, Hirayama K. Degradation of methyl and ethyl mercury into inorganic mercury by hydroxyl radical produced from rat liver microsomes. Arch. Toxicol. 1992;66:398–402. doi: 10.1007/BF02035129. [DOI] [PubMed] [Google Scholar]
- Waltzer L, Bataille L, Peyrefitte S, Haenlin M. Two isoforms of Serpent containing either one or two GATA zinc fingers have different roles in Drosophila haematopoiesis. EMBO J. 2002;21:5477–5486. doi: 10.1093/emboj/cdf545. [DOI] [PMC free article] [PubMed] [Google Scholar]
- Wang Y, Pot D, Kachman SD, Nuzhdin SV, Harshman LG. A quantitative trait locus analysis of natural genetic variation for Drosophila melanogaster oxidative stress survival. J. Hered. 2006;97:355–366. doi: 10.1093/jhered/esl009. [DOI] [PubMed] [Google Scholar]
- Yao CP, Allen JW, Aschner M. Metallothioneins attenuate methylmercury-induced neurotoxicity in cultured astrocytes and astrocytoma cells. Ann. N. Y. Acad. Sci. 1999;890:223–226. doi: 10.1111/j.1749-6632.1999.tb07997.x. [DOI] [PubMed] [Google Scholar]
- Yao CP, Allen JW, Mutkus LA, Xu SB, Tan KH, Aschner M. Foreign metallothionein-I expression by transient transfection in MT-I and MT-II null astrocytes confers increased protection against acute methylmercury cytotoxicity. Brain Res. 2000;855:32–38. doi: 10.1016/s0006-8993(99)02211-8. [DOI] [PubMed] [Google Scholar]
- Yasutake A, Hirayama K. Sex and strain differences of susceptibility to methylmercury toxicity in mice. Toxicology. 1988;51:47–55. doi: 10.1016/0300-483x(88)90079-0. [DOI] [PubMed] [Google Scholar]
Associated Data
This section collects any data citations, data availability statements, or supplementary materials included in this article.


