Abstract
Background
The natural history of heterogeneous atherosclerotic plaques and the role of local hemodynamic factors throughout their development are unknown. We performed a serial study to assess the role of endothelial shear stress (ESS) and vascular remodeling in the natural history of coronary atherosclerosis.
Methods and Results
Intravascular ultrasound-based 3D reconstruction of all major coronary arteries (n=15) was serially performed in-vivo in five swine, 4, 11, 16, 23 and 36 weeks after induction of diabetes and hyperlipidemia. The reconstructed arteries were divided into 3mm-long segments (n=304). ESS was calculated in all segments at all time points using computational fluid dynamics. Vascular remodeling was assessed at each time point in all segments containing significant plaque, defined as maximal intima-media thickness (maxIMT)≥0.5mm, at week 36 (n=220). Plaque started to develop at week 11 and progressively advanced towards heterogeneous, multifocal lesions at all subsequent time points. Low ESS promoted the initiation and subsequent progression of plaques. The local remodeling response changed substantially over time and determined future plaque evolution. Excessive expansive remodeling developed in regions of very low ESS, further exacerbated the low ESS and was associated with the most marked plaque progression. The combined assessment of ESS, remodeling, and plaque severity enabled the early identification of plaques that evolved to high-risk lesions at week 36.
Conclusions
The synergistic effect of local ESS and the remodeling response to plaque formation determines the natural history of individual lesions. Combined in-vivo assessment of ESS and remodeling may predict the focal formation of high-risk coronary plaque.
Keywords: coronary atherosclerosis, remodeling, endothelial shear stress, natural history
Introduction
Atherosclerosis is a systemic disease with multifocal heterogeneous manifestations.1 Because multiple plaques at different stages of progression and variable morphology typically coexist within the same patient or even artery,2 it would be invaluable to characterize and risk-stratify each individual plaque in vivo. Increasing attention has focused on the in vivo identification of high-risk plaques most likely to rupture and cause an acute coronary event. Although previous evidence exists on the heterogeneous nature of atherosclerotic disease, there have not been previous in vivo studies to characterize the natural history of atherosclerosis, and to determine the factors responsible for the heterogeneity of plaque development. As a result, no widely accepted method to prospectively identify high-risk plaque in vivo is available at present.
The focal distribution and heterogeneity of plaques, despite the exposure of the entire vasculature to the same systemic risk factors, has been attributed to the effect of local hemodynamic forces. Endothelial shear stress (ESS) critically determines the regional localization of atherosclerosis and the evolution of individual lesions.1,3,4 However, previous studies were often limited by the use of only two time points to assess natural history,5-7or by the lack of animal models of human-like coronary atherosclerosis.8 Currently, there are no data prospectively assessing the role of ESS in the continuum of atherosclerosis manifestations nor the progression of heterogeneous advanced plaques over multiple time points.
The vascular remodeling response to the development of plaque is an essential component of atherosclerotic disease and strongly influences the composition of the individual plaque and its ultimate clinical presentation.9,10 Little is currently known about the natural course of the wall's remodeling response to local plaque, the dynamic interplay between remodeling and the changing local hemodynamic environment, and the impact of the nature of remodeling on future plaque growth.
The objective of the present study was dual. First, we sought to perform a serial intravascular ultrasound (IVUS) study of the natural history of coronary atherosclerosis and to determine the role of ESS throughout the natural course of developing lesions, utilizing a diabetic porcine model that can develop human-like advanced plaques.3,11 We further investigated the evolution of the vascular remodeling response to plaque, and the association of remodeling with local ESS and subsequent plaque progression. Second, we hypothesized that in vivo assessment of local ESS, plaque and remodeling characteristics may predict the heterogeneity of plaque development and the formation of high-risk plaque at an early stage of its development. Early identification of coronary lesions likely to evolve to a rupture-prone phenotype may enable the appropriate application of a focused systemic treatment or highly selective local prophylactic intervention to avert an adverse clinical outcome.
Methods
A detailed description of the methods is presented in the online-only Data Supplement. Briefly, five male Yorkshire swine aged 12-14 weeks were rendered diabetic by injection of streptozotocin (50mg/kg in 0.1mol/L Na-citrate daily for 3 days) and were fed a high-fat diet containing 1.5% cholesterol and 15% lard supplemented with sucrose.11 Intracoronary vascular profiling utilizing IVUS and angiography, as described previously,12 was serially performed in vivo on each of the animals' major epicardial coronary arteries at weeks 4, 11, 16, 23 and 36 after induction of diabetes and initiation of high-fat diet (Figure 1S in the online-only Data Supplement). The experimental protocol was approved by the Harvard Medical School Institutional Animal Care and Use Committee. All measurements were made blind to animal age.
Vascular profiling for the assessment of local ESS
Vascular profiling used a methodology previously described and validated in vivo.3,4,12,13 Each 3D reconstructed artery was divided at week 36 into 3mm-long segments along its entire length. To locate the segments in IVUS investigations at multiple time points, two to three readily visible side branches were identified and used as reference markers for accurate comparison of the same segments over time. ESS at the lumen surface of the 3-dimensional reconstructed artery was calculated at all time points as the product of blood viscosity and the gradient of blood velocity at the wall. Mean ESS was calculated in each segment at all time points.
Assessment of plaque severity and plaque progression by IVUS
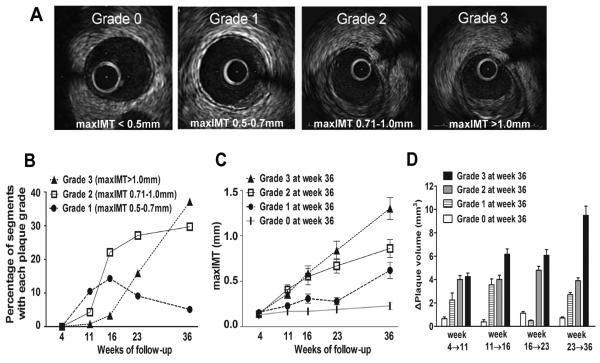
Atherosclerotic plaque severity over time was estimated in each segment of the 3D reconstructed arteries by maximum intima-media thickness (maxIMT) assessed by IVUS. To account for possible circumferential and longitudinal variations of plaque thickness, the 30° arch with the greatest average IMT was identified around each 3D reconstructed segment's circumference and represented the maxIMT of the segment at each time point. Plaque severity was categorized as not significant (grade 0; <0.5mm), minor (grade 1; 0.5-0.7mm), intermediate (grade 2; 0.71-1.0mm), and severe (grade 3; >1.0mm) (Figure 1A). The progression of plaque severity between consecutive time points was assessed by the relative change of maxIMT (%ΔmaxIMT) according to the following equation:
Figure 1.
A, Representative examples of each grade of plaque severity. Segments were categorized according to maxIMT by IVUS into 4 grades of plaque severity: grade 0 (<0.5mm), grade 1 (0.5-0.7mm), grade 2 (0.71-1.0mm) and grade 3 (>1.0mm). B, Evolution of plaque severity over time. C, Evolution of maxIMT at all preceding time points in segments which resulted in each grade of plaque severity at week 36. D, Change of plaque volume (ΔPV) during the four consecutive intervals of follow-up in segments culminating in each grade of plaque severity at week 36.
Plaque progression between consecutive time points was assessed by change of plaque (intima-media) volume (ΔPV). We calculated the plaque volume (PV) of each 3mm-long 3D reconstructed segment as the sum of plaque volumes contained between all consecutive end-diastolic IVUS frames that were included in each 3mm-long segment. The plaque volume contained between each two consecutive end-diastolic IVUS frames was in turn computed as the product of plaque area multiplied by the distance between each two consecutive frames.
Plaque burden (%) was calculated for each segment at all time points according to the following equation:
Assessment of vascular remodeling
The nature of the remodeling response to plaque growth was assessed over time in each arterial segment that contained significant plaque at final week 36, defined as maxIMT≥0.5mm by IVUS. Remodeling was assessed in these segments at each time point by comparing the local remodeling behavior of each individual segment with the global remodeling response of the entire artery, as previously described.3,14 We identified three patterns of vascular remodeling: (a) excessive expansive remodeling, (b) compensatory expansive remodeling, and (c) constrictive remodeling.
Identification of high-risk plaque by IVUS
High-risk plaques were characterized by IVUS at week 36. We considered plaques with maximal severity and excessive expansive remodeling at week 36 to represent the lesions with the highest risk of rupture, consistent with previous human IVUS15 and histopathology studies2,9,16, as well as our previous IVUS and histopathology results utilizing the same diabetic, hyperlipidemic swine model.3 Accordingly, segments with the combination of grade 3 plaque (maxIMT>1.0mm) and excessive expansive remodeling at week 36 comprised the subpopulation of high-risk plaques.
Determination of a risk score for the prediction of high-risk plaque
A composite risk score was employed at weeks 11, 16 and 23, for the prediction of the formation of high-risk plaques at week 36. Risk score points were assigned to each of the following variables: local ESS, plaque severity and the vascular remodeling pattern, using an arbitrary grading system summarized in Table 1. The grading system was developed using categorical versions of all included variables. Plaque severity was categorized into four grades based on maxIMT by IVUS, as described above. ESS was categorized into three grades: <1.0 Pa, 1.0-1.5 Pa and >1.5 Pa. The vascular remodeling pattern was categorized as excessive expansive, compensatory and constrictive. The predictive risk score was assessed for each segment at weeks 11, 16 and 23 as the sum of all points at each time point.
Table 1.
Grading system for the assessment of the Predictive Risk Score.
| Plaque severity | ESS | Vascular remodeling | |||
|---|---|---|---|---|---|
| Category | Points | Category | Points | Category | Points |
| Grade 0 | 0 | >1.5 Pa | 0 | Constrictive | 0 |
| Grade 1 | 1 | 1.0-1.5 Pa | 1 | Compensatory | 1 |
| Grade 2 | 2 | <1.0 Pa | 2 | Excessive expansive | 2 |
| Grade 3 | 3 | ||||
Statistical analyses
Statistical analyses were performed using SPSS version 17.0 (SPSS Inc., Chicago, IL) or STATA version 10.1. Continuous variables are summarized as mean ± standard error of the mean (SEM) and categorical variables as actual numbers and percentages. Correlation between two continuous variables was measured with the Pearson r correlation coefficient. For analyses with a continuous dependent and a categorical independent variable, analysis of variance was used. Since observations were not statistically independent, the animal was specified as a random effect to account for the clustering of arteries within animals. The method of Scheffe was used to adjust for multiple comparisons of data.17 Linear regression was employed when there were both continuous independent and dependent variables. The Huber White Sandwich estimator was used to correct for the clustering of arteries within animals.18 Logistic regression was used to examine the association between the risk score at weeks 11, 16, or 23 and plaque status defined as high-risk versus all other lesions at week 36. First, separate bivariate analyses examining the effect of each score were conducted, and second, a multivariate model with the best set of predictors was also developed. Given the hierarchical data structure, 95% confidence intervals were adjusted with the Huber White Sandwich Estimator. Findings were considered statistically significant at the 0.05 level.
The authors had full access to and take responsibility for the integrity of the data. All authors have read and agree to the manuscript as written.
Results
Fifteen coronary arteries from five pigs were serially profiled (left anterior descending, n=5; left circumflex, n=5; right coronary artery, n=5). The mean time-averaged total cholesterol and blood glucose during follow-up were 728±161 mg/dL and 265±53 mg/dL, respectively.
I. Assessment of plaque severity and plaque progression over time
Plaque started to develop at week 11 and progressively evolved to more advanced grades, leading to marked heterogeneity at all subsequent time points. The frequency of grade 1 plaques peaked at week 16 and subsequently decreased, with a parallel increase in the frequency of grade 2 and 3 plaques, suggesting the transition of minor to more advanced lesions (Figure 1B). We investigated the association of individual plaque severity at follow-up with the corresponding plaque severity at earlier time points. There was a strong correlation of maxIMT of individual segments at week 36 with maxIMT at week 23 (r=0.72, p<0.001) and week 16 (r=0.57, p<0.001) and a moderate correlation with maxIMT at week 11 (r=0.39, p<0.001). We focused on segments with each grade of plaque severity at week 36 and assessed their evolution throughout their natural history. We observed non-uniform patterns of progression rate, such that segments with severe (grade 3) plaque at week 36, had on average higher maxIMT at weeks 16 and 23 and higher plaque progression (ΔPV) during all consecutive time intervals, compared to segments that eventually developed less severe, or no plaque at week 36 (Figures 1 C, 1D). These results indicate that arterial segments culminating in the most severe plaque persistently exhibited more marked progression throughout their evolution. Of note, total cholesterol did not significantly differ in segments that culminated in each grade of plaque at week 36 (p=0.19).
II. Pro-atherogenic effect of low ESS over time
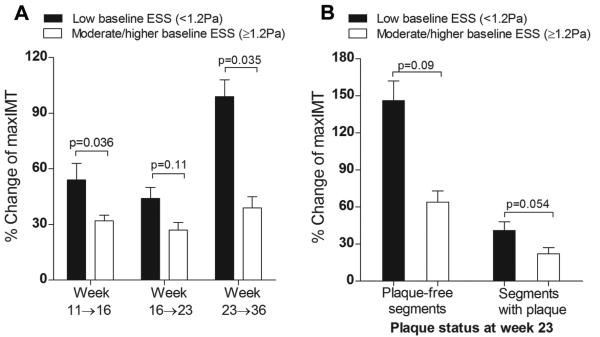
To assess the pro-atherogenic effect of ESS throughout the evolution of minor lesions to heterogeneous, advanced plaques, all segments (n=304) were categorized based on low ESS (<1.2 Pa) or moderate/higher ESS (≥ 1.2 Pa) at each time point, as previously reported.4 Segments exposed to low ESS at weeks 11, 16 and 23 exhibited greater subsequent progression of plaque severity (%ΔmaxIMT) compared to segments with moderate/higher ESS (Figure 2A). To investigate the pro-atherogenic effect of low ESS in relation to the presence of significant plaque, we focused on week 23, on the basis that almost half of all segments (n=147 of 304, 48.4%) already contained significant plaque (maxIMT≥0.5mm) at that time point. Higher progression of plaque severity in response to low ESS compared to moderate/higher ESS occurred in segments free of significant plaque at week 23 (p=0.09), as well as in segments with significant plaque by IVUS at that time point (p=0.054) (Figure 2B).
Figure 2.
A, Progression of plaque severity, assessed by relative change of maxIMT (%Δmax IMT) between consecutive time points in relation to baseline ESS. Segments exposed to low ESS (<1.2Pa) at weeks 11, 16 and 23 exhibited greater relative increase of maxIMT between weeks 11→16, 16→23 and 23→36, respectively, compared to segments with moderate/higher baseline ESS (≥1.2 Pa). B, Progression of plaque severity following week 23 was more marked in segments of low vs. moderate/higher ESS at week 23, both in plaque-free segments (maxIMT<0.5mm) and in segments that already contained significant plaque (maxIMT≥0.5mm) at this time point.
III. Assessment of vascular remodeling over time
Vascular remodeling response to plaque was determined at all time points in all segments that contained significant plaque at week 36 (maxIMT≥0.5mm; n=220, 72.4% of all segments). There was marked heterogeneity of remodeling patterns: at each time point, the majority of segments exhibited compensatory expansive remodeling, ranging between 70-80% over time, while the rest were almost equally divided between an excessive expansive (10-17%) and constrictive phenotype (10-15%) (Figure 3A). The remodeling response of each individual segment also exhibited remarkable heterogeneity throughout its evolution, such that segments did not consistently manifest the same remodeling pattern over time but often evolved through different patterns (Figure 3B). Although in general the proportion of segments with each remodeling type remained relatively stable over time, the specific segments within each category changed very substantially. The majority (73-86%) of segments initially displaying compensatory remodeling remained with that remodeling pattern over time. A large proportion (26-56%) of initially excessively expansive remodeled segments remained with the same remodeling pattern, although a substantial proportion (40-74%) evolved towards a more compensatory pattern. The majority (75-85%) of constrictively remodeled segments at each time point developed compensatory remodeling over time and only a small minority (14-22%) remained constrictive or developed constriction by 36 weeks. Individual remodeling trajectories of segments that culminated in compensatory, excessive expansive or constrictive remodeling are detailed in Figures 3C, 3D and 3E, respectively.
Figure 3.
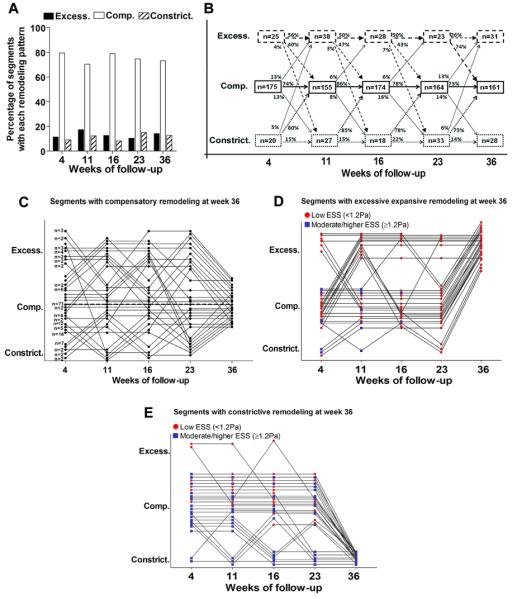
A, Frequency of the three remodeling patterns over time in segments that developed significant plaque (maxIMT≥0.5mm) by week 36 (n=220). B, Individual segments often evolved through different remodeling patterns throughout their natural history. The majority of segments with compensatory remodeling remained with that remodeling pattern over time. Only a small minority of segments with either excessive expansive, or constrictive remodeling at week 4, continued to exhibit the same remodeling pattern throughout their evolution. C, Individual remodeling trajectories of segments that culminated in compensatory remodeling at week 36 (n=161). Each dot represents an individual segment, or a group of segments that followed the same trajectory of remodeling evolution, as denoted by the number next to dots at week 4. Seventy one segments (44%) followed a trajectory of continuous compensatory remodeling throughout their evolution (dotted line). D, E, Individual remodeling trajectories of segments that culminated in excessive expansive remodeling (n=31) (D) and constrictive remodeling (n=28) (E) at week 36. Each dot represents an individual segment. Red dots denote low ESS (<1.2Pa), while blue dots represent moderate/higher ESS (≥1.2 Pa) for any segment at any given time point.
We assessed the progression of plaque burden in segments that developed each remodeling pattern at week 36. Lesions culminating in constrictive remodeling had on average plaque burden 62±6.1% at week 36, whereas the plaque burden at week 36 for segments with compensatory, or excessive expansive remodeling at week 36 was 48.3±5.2% and 41.8±4.4%, respectively (Figure 2S in the online-only Data Supplement). These results indicate the highly dynamic nature of the remodeling response to individual lesions, and the relation between the gradually increasing plaque burden and the ultimate pattern of the wall's remodeling response to advanced plaque.
IV. Association of vascular remodeling with local ESS
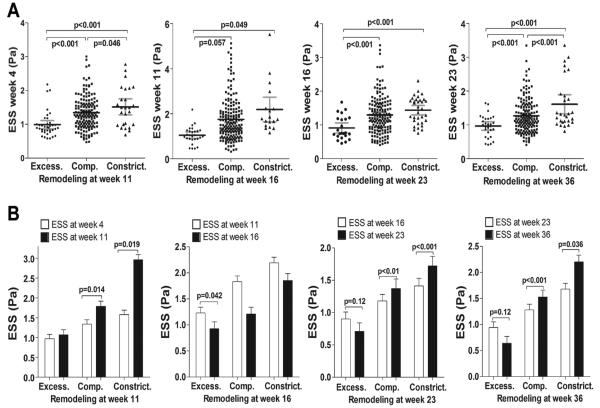
We evaluated the ESS environment that preceded each remodeling phenotype, and the effect of remodeling on local ESS, for all intervals between each two consecutive time points. At each time point excessive expansive remodeling developed in regions of lower ESS at the immediately preceding time point compared to segments that developed compensatory or constrictive remodeling (Figure 4A).
Figure 4.
A, Local ESS at weeks 4, 11, 16 and 23 in segments categorized by the remodeling pattern at the immediately following time point, i.e. week 11, 16, 23 and 36, respectively. At all time points, segments with excessive expansive remodeling had significantly lower preceding ESS compared to segments with compensatory or constrictive remodeling. B, Impact of each remodeling pattern on local ESS. For segments with each remodeling pattern at all time points, local ESS at any given time point of remodeling assessment is compared to the local ESS at the immediately preceding time point. ESS generally tended to further decrease in segments with excessive expansive remodeling, and increased in segments with compensatory, or constrictive remodeling.
ESS generally decreased in segments with excessive expansive remodeling compared to each preceding time point. In segments where plaque progression resulted in compensatory or constrictive remodeling, however, ESS generally tended to increase in relation to the preceding ESS (Figure 4B).
V. Association of the nature of remodeling with subsequent plaque progression
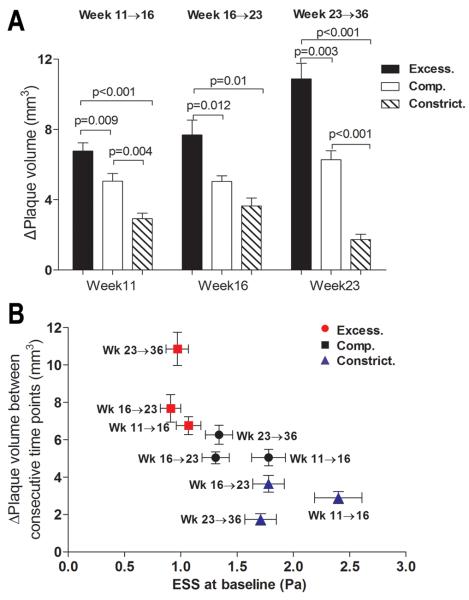
We further assessed the impact of each remodeling pattern on the rate of subsequent plaque progression. Plaques with excessive expansive remodeling at any time point throughout their evolution tended to have more marked subsequent progression, as assessed by change of plaque volume (ΔPV) (Figure 5). Plaque progression tended to be more moderate in segments with compensatory remodeling, and even more attenuated in constrictive lesions, particularly at later time points.
Figure 5.
A, Plaque progression, assessed by change in plaque volume (ΔPV), between consecutive time points, in relation to the baseline remodeling pattern. B, Plaque progression (ΔPV) for segments with each baseline remodeling pattern plotted against baseline ESS, for time intervals week 11→16, week 16→23 and week 23→36. Horizontal and vertical lines represent S.E.M. of ESS and ΔPV, respectively.
VI. Identification and prediction of high-risk plaque based on low ESS, plaque severity and excessive expansive remodeling
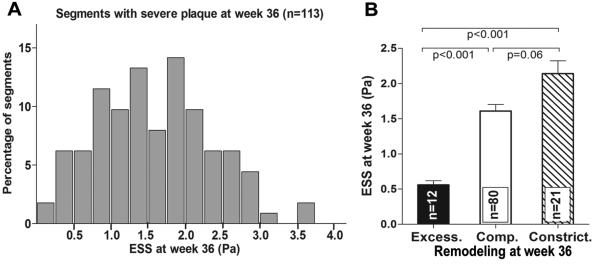
We focused on the subpopulation of severe plaques with maxIMT>1.0mm at week 36 (n=113 of 304, 37.2%). Shear stress in severe plaques exhibited significant heterogeneity at week 36, ranging from very low to physiologic to high (Figure 6A). Only a minority of these severe plaques (12 of 113, 10.6% of severe plaques, 3.9% of all segments) displayed excessive expansive remodeling and these plaques likely represent the highest-risk lesions, in that the pathophysiologic stimulus for ongoing severe inflammation and EEM degradation remained prominent.3 These excessively remodeled, high-risk severe lesions had on average lower ESS (Figure 6B) and larger plaque volume compared to severe plaques with compensatory or constrictive remodeling (40.1±3.5 vs. 29.9±2.9 vs. 24.2±2.3 mm3, p=0.002 and p<0.001, respectively) at week 36.
Figure 6.
A, Frequency distribution of ESS in segments with severe plaque at week 36, defined as maxIMT>1.0mm by IVUS. B, ESS at week 36 in segments with severe plaque and excessive expansive (excess.), compensatory (comp.) or constrictive remodeling (constrict.) at week 36.
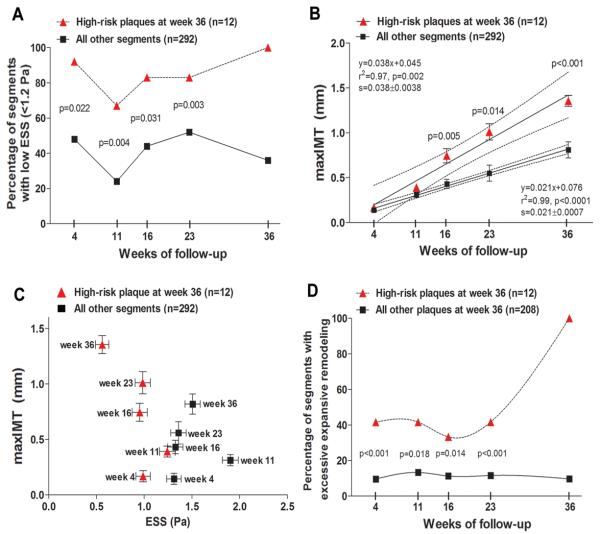
Furthermore, these high-risk lesions at week 36 had been more frequently exposed to low ESS (Figure 7A) and exhibited greater plaque severity (Figure 7B, 7C) at all preceding time points compared to all other segments throughout their evolution. These high-risk plaques also had a higher frequency of excessive expansive remodeling over time compared to all other segments that developed significant plaque (maxIMT≥0.5mm) by week 36 (Figure 7D).
Figure 7.
A, Percentage of segments with low ESS (<1.2 Pa) over time in segments that culminated in high-risk plaque at week 36, defined as the combination of maxIMT>1.0mm and excessive expansive remodeling at week 36, vs. all other coronary segments. B, maxIMT over time in segments that culminated in high-risk plaque at week 36, vs. all other segments. Dashed lines represent 95% CI for the regression lines. The slopes of the two regression lines (0.038±0.0038 vs. 0.021±0.0007) are significantly different (p<0.0001). C, maxIMT at each time point plotted against ESS at the same time point in segments that culminated in high-risk plaque at week 36, vs. all other coronary segments. Values are presented as mean±SEM. D, Percentage of segments with excessive expansive remodeling over time in segments that culminated in high-risk plaque at week 36, vs. all other segments with significant plaque (maxIMT≥0.5mm) at week 36.
VII. Prediction of high-risk plaque based on the combined assessment of preceding ESS, plaque severity and vascular remodeling
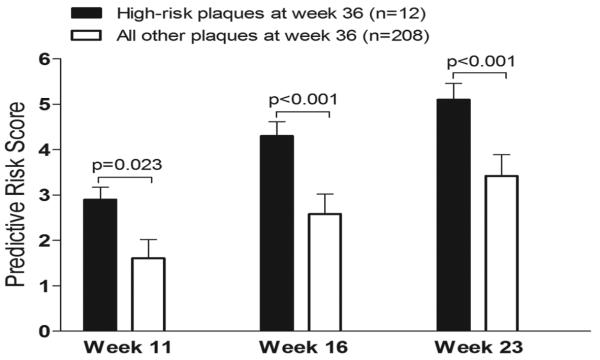
We investigated the prognostic value of the combined assessment of ESS, plaque severity, and remodeling pattern at preceding points, for the early identification of high-risk plaque at final follow-up. Segments that culminated in high-risk plaque at week 36, as defined above (n=12), had higher values of the risk score at preceding weeks 11, 16 and 23, compared to all other segments that had developed significant plaque (maxIMT≥0.5mm) at week 36 (Figure 8). On multivariable analysis the risk score at week 16 (OR=2.81, CI: 2.24-3.52, p<0.0001) and week 23 (OR=2.01, CI: 1.34-3.01, p<0.001) independently predicted high-risk plaques at week 36.
Figure 8.
Association of the predictive risk score at preceding time points with status of plaque at week 36. Segments that culminated in high-risk plaque at week 36 displayed higher values of the risk score at preceding weeks 11, 16 and 23 compared to all other segments that developed significant plaque (maxIMT≥0.5mm) at week 36.
Discussion
The present study systematically explored in vivo the natural history of coronary atherosclerosis and arterial remodeling, as assessed by vascular profiling, in an animal model that develops human-like focal advanced lesions.3,11 Our major finding is that a complex interplay among plaque progression, wall remodeling response, and corresponding changes of local ESS synergistically determined the future vascular behavior of developing lesions. Low ESS was associated with the early initiation, as well as the ongoing progression of focal plaque. Vascular remodeling was a highly dynamic, temporally changing response to local plaque formation. Regions of very low ESS resulted in plaques with excessive expansive remodeling, which further exacerbated the low ESS environment and augmented subsequent plaque progression. Conversely, lesions with compensatory, or with constrictive, remodeling were characterized by amelioration of the adverse low ESS stimulus and a trend towards less marked further growth. A small subpopulation of coronary segments was exposed to a progressively worsening stimulus of low ESS throughout their evolution, and ultimately evolved to presumed highest-risk plaques. These high-risk lesions could be identified in vivo at earlier stages of their natural history by the combined assessment of local ESS, plaque thickness, and vascular remodeling.
Different patterns of plaque progression
We observed that plaques developed focally, independently of each other, and displayed remarkable heterogeneity at all time points. Specific coronary regions remained spared of atherosclerosis, while other regions progressively developed variable disease manifestations, despite the exposure to comparable systemic atherogenic risk factors. Segments that evolved towards the most severe plaques were persistently characterized by more advanced severity and more accelerated plaque progression throughout their natural history, compared to segments culminating in less severe, or no plaque. Assessment of plaque distribution and severity within the coronary vasculature at any time point may thus enable the prediction of regions where worsening subsequent plaque progression is more likely to occur.
Natural history of remodeling
Our results show remarkable heterogeneity of the remodeling response at each time point, ranging from constrictive to compensatory expansive to excessive expansive. Notably, individual plaques also evolved through a variety of remodeling patterns throughout their natural history, thus exhibiting a heterogeneous course, analogous to the dynamic nature of plaque progression itself. Although serial human IVUS studies have previously reported that the remodeling pattern of a lesion tends to remain relatively constant over time,5 these studies used only two time points of investigation, whereas our study employed five time points. Compensatory expansive remodeling was the predominant vascular response at all time points, and the majority of segments with compensatory remodeling remained in the same pattern at any subsequent stage. However, remarkable changes of remodeling patterns were observed during individual plaque progression, with the most common transitions occurring between compensatory and either excessive expansive, or constrictive remodeling. Overall, our findings indicate that the extent of vessel expansion or the development of constriction, and thereby the status of relative plaque stability or instability,9,10,15,16 may change in response to plaque growth. Although remodeling is influenced by genetics,19 the arterial wall dynamically responds to the progressing plaque and the accordingly changing local hemodynamic environment.
ESS and vascular remodeling determine the natural history of individual plaques
We serially investigated in vivo, for the first time, coronary arteries initially without plaque which progressively became severely atherosclerotic. We found that in the setting of systemic atherogenic risk factors low ESS, as determined by native arterial geometry, induces the initiation of atherosclerosis in originally plaque-free arterial regions; further, low ESS occurring in the setting of plaque-induced changes of the local hemodynamic environment also exacerbates additional growth in regions that already contain significant plaque. Low ESS elicits a molecular and cellular pro-atherogenic phenotype in intact endothelial cells, and continues to exert a pro-atherogenic effect at more advanced stages of atherosclerosis.1 The pro-atherogenic role of low ESS has been extensively evaluated in vitro and ex vivo20,21 and validated in vivo in either plaque-free animal,3,8 or minimally diseased human arteries.4,12,22 In keeping with the notion that the pro-atherogenic endothelial phenotype is reversible upon restoration of athero-protective flow conditions,23 our results indicate that local low ESS is critical in persistently promoting coronary plaque growth in the continuum of atherogenesis and atherosclerotic progression.
The nature of remodeling is a recognized determinant of plaque stability. Expansive remodeling is related to plaque vulnerability9,16 and unstable clinical presentation10,15,, whereas constrictive remodeling is considered to represent fibrocalcific, stable plaques.6,9,16 A novel finding of the present study is that the nature of remodeling is also related to subsequent plaque progression. Excessive expansive remodeling is associated with the most marked subsequent plaque progression, while constrictive remodeling attenuates further growth at all time points. To our knowledge, only one serial IVUS study has directly investigated the effect of remodeling on plaque progression, and found that baseline remodeling does not predict the rate of subsequent plaque growth.7 The seeming discrepancy with our results could be attributed to the use of only two time points of investigation in the previous study, differences in the definition and frequency of each remodeling pattern, and the use of statins, which are recognized regulators of plaque development and remodeling.6,24
The arterial wall remodeling response to plaque development is clearly a critical determinant of subsequent local ESS and, consequently, the magnitude of the ongoing atherogenic stimulus and the natural history of the individual lesion. One can conceptually speculate that in a susceptible arterial region, and with the synergistic effect of systemic risk factors, naturally occurring low ESS leads to local plaque formation essentially as an adaptive endothelial response to the detrimental local ESS conditions, in an effort to increase local ESS and thereby restore a more vasculoprotective environment. If the plaque encroaches on the lumen and thus increases local ESS, compensatory expansive remodeling response of the arterial wall may again normalize the low ESS stimulus and attenuate further plaque progression. If plaque forms in an extremely low ESS environment, the wall response may not be compensatory expansive remodeling, but excessive expansive remodeling instead, due to more intense local inflammation and disruption of the internal elastic laminae.3 This focal area of intense inflammation in turn further exacerbates the pro-atherogenic low ESS stimulus and establishes a vicious cycle promoting accelerated plaque growth and ultimate creation of high-risk plaque.
Constrictive vascular remodeling develops in regions of higher ESS and further increases the local ESS, thereby ameliorating the proatherogenic stimulus and attenuating the rate of additional plaque growth. The development of constrictive remodeling may not be causally related to the higher levels of ESS per se, but rather to the absence of a proinflammatory low ESS environment that would promote local inflammation, extracellular matrix degradation and vessel expansion.1,3 In this local hemodynamic setting, constrictive remodeling may either occurr persistently throughout the natural course of a developing lesion, or represent a late-stage phenomenon (Figure 3E). In either case, and relevant to the human autopsy findings first described by Glagov et al,25 our serial IVUS results demonstrate in a prospective manner that constrictive remodeling eventually developed in advanced lesions with an average plaque burden exceeding the 50% value, which in our experimental model of atherosclerosis may represent the threshold of the wall's capacity to further expand and accomondate the growing plaque (Supplementary Figure 2S).
In vivo assessment of low ESS and vascular remodeling for the identification and prediction of high-risk plaques
Although low ESS is a critical pathophysiologic factor leading to localized plaque initiation and progression to severe, highly inflamed lesions,3 the local ESS environment within which each severe plaque is located is remarkably heterogeneous. The vast majority of severe plaques reside in a physiologic ESS environment, likely related to the artery's previous remodeling response to normalize ESS. Only a minority of severe plaques are in either a low or a high ESS milieu. High-risk severe plaques with excessive expansive remodeling had been exposed to a persistently low local ESS throughout their natural history and continued to exhibit the lowest ESS values at an advanced stage of their evolution. The magnitude of low ESS is dose-dependently related to the intensity of local inflammation and the severity of high-risk plaque characteristics,3 and very low ESS in advanced lesions may thus represent an ongoing stimulus for more marked vessel expansion, worsening local inflammation and increased proclivity to rupture.
Our results indicate that the value of vascular profiling as a prognostic tool to risk-stratify early individual plaques lies in the persistence of an adverse local hemodynamic milieu in a small subpopulation of developing lesions. The integration of local ESS, plaque severity and the nature of vascular remodeling into one predictive risk score enabled the early identification of regions that subsequently evolved towards lesions with the considered highest risk of rupture. Vascular profiling may thus be used for the functional characterization of individual plaques and the prediction of their future vascular behavior at earlier stages of their natural history.
Study Limitations
The small population size is acknowledged as a limitation. The power of the study increased, however, by profiling the entire length of 15 arteries divided into 304 segments, at five consecutive time points.
The direct extrapolation of our results to humans may be limited because of the severe diabetic, hyperlipidemic conditions in our model. The combined risk score was developed employing an arbitrary grading system, and was not applied in an independent validation sample. The risk score aims to underscore the synergistic effect of local ESS, plaque severity and the wall's remodeling response as a critical determinant of the natural history of individual lesions in our experimental model. The applicability of this score has not been tested in humans, and remains to be determined in adequately powered clinical trials, currently underway.
ESS was averaged within a 3mm-long arterial segment. However, by dividing the arteries into relatively short segments, which exhibit homogeneity of ESS along their length, we eliminated the possible error of averaging.3
The assumption of steady-state coronary blood flow ignored phasic phenomena, but, as we previously demonstrated, using the average flow in steady flow calculations yields essentially the same values of ESS as calculating the average ESS from the phasic solution.13 The errors produced by the assumptions of Newtonian viscosity and rigid arterial walls were insignificant in the flow ranges observed in our study.
Although ESS is a continuous variable, analyses were performed by dichotomizing ESS as a categorical variable. Changes in ESS over time in relation to the remodeling response could in part be related to regression to the mean.
Conclusions
The present study provides insight into the natural history of coronary atherosclerosis, focusing on the mechanistic role of endothelial shear stress. Atherosclerosis-prone segments exposed to low ESS are the regions where plaque forms and progressively evolves. The remodeling response to local plaque formation may change over time, is determined by the preceding ESS milieu, and in turn dictates the subsequent progression rate of the individual lesion. Plaques with excessive expansive remodeling develop in regions of very low ESS, further augment the low ESS stimulus, and are characterized by more marked additional growth. In-vivo combined assessment of local ESS, plaque severity and vascular remodeling may enable the early identification of advanced plaques with the most intense ongoing pro-inflammatory stimulus and thereby the highest likelihood of rupture.
Clinical Perspective.
Knowledge of the natural history of atherosclerosis and of the determinants of heterogeneous atherosclerotic manifestations is a precondition for the early identification of coronary regions most likely to evolve to culprit lesions of acute coronary events. This experimental study indicates that the in vivo combined assessment of local low ESS, excessive expansive remodeling, and advanced plaque severity at earlier stages of the disease course may enable the prediction of lesions most likely to possess, or to acquire, a high-risk phenotype. Assessment of local hemodynamic and arterial wall characteristics might thereby be used as a clinical tool for individual plaque risk stratification and prognostication. Percutaneous coronary interventions are currently employed either in severely obstructive plaques causing myocardial ischemia, or in culprit lesions of acute coronary syndromes, the majority of which are minimally obstructive. Early in vivo identification of high-risk lesions before they actually become rupture-prone may guide the appropriate application of a focused systemic treatment or highly selective local prophylactic interventions to avert the thrombotic complications of coronary plaque rupture. A large-scale, human natural history study, currently underway (PREDICTION Trial), may confirm the applicability of evaluating shear stress and arterial wall morphology to predict the development of lesions that cause new coronary events.
Supplementary Material
Acknowledgments
We are grateful to Michelle Lucier and Gail MacCallum for their invaluable technical assistance.
Funding sources
This work was supported by grants from the Novartis Pharmaceuticals Inc. (to P.H.S. and C.L.F.), Boston Scientific Inc. (to P.H.S. and C.L.F.), the George D. Behrakis Research Fellowship (to K.C.K. and Y.S.C.); the Hellenic Heart Foundation; the Alexander S. Onassis Public Benefit Foundation; the Hellenic Harvard Foundation; the AG. Leventis Foundation; the Hellenic Atherosclerosis Society (to Y.S.C.), and the NIH R01 GM 49039 (to E.R.E.).
Footnotes
Disclosures
None.
This is a PDF file of an unedited manuscript that has been accepted for publication. As a service to our customers we are providing this early version of the manuscript. The manuscript will undergo copyediting, typesetting, and review of the resulting proof before it is published in its final citable form. Please note that during the production process errors may be discovered which could affect the content, and all legal disclaimers that apply to the journal pertain.
References
- 1.Chatzizisis YS, Coskun AU, Jonas M, Edelman ER, Feldman CL, Stone PH. Role of endothelial shear stress in the natural history of coronary atherosclerosis and vascular remodeling: molecular, cellular and vascular behavior. J Am Coll Cardiol. 2007;49:2379–2393. doi: 10.1016/j.jacc.2007.02.059. [DOI] [PubMed] [Google Scholar]
- 2.Cheruvu PK, Finn AV, Gardner C, Caplan J, Goldstein J, Stone GW, Virmani R, Muller JE. Frequency and distribution of thin-cap fibroatheroma and ruptured plaques in human coronary arteries: a pathologic study. J Am Coll Cardiol. 2007;50:940–949. doi: 10.1016/j.jacc.2007.04.086. [DOI] [PubMed] [Google Scholar]
- 3.Chatzizisis YS, Jonas M, Coskun AU, Beigel R, Stone BV, Maynard C, Gerrity RS, Daley W, Rogers C, Edelman ER, Feldman CL, Stone PH. Prediction of the localization of high risk coronary atherosclerotic plaques on the basis of low endothelial shear stress: an intravascular ultrasound and histopathology natural history study. Circulation. 2008;117:993–1002. doi: 10.1161/CIRCULATIONAHA.107.695254. [DOI] [PubMed] [Google Scholar]
- 4.Stone PH, Coskun AU, Kinlay S, Popma JJ, Sonka M, Wahle A, Yeghiazarians Y, Maynard C, Kuntz RE, Feldman CL. Regions of low endothelial shear stress are sites where coronary plaque progress and vascular remodeling occurs in humans: an in-vivo serial study. Eur Heart J. 2007;28:705–710. doi: 10.1093/eurheartj/ehl575. [DOI] [PubMed] [Google Scholar]
- 5.von Birgelen C, Hartmann M, Mintz GS, Böse D, Eggebrecht H, Neumann T, Gössl M, Wieneke H, Schmermund A, Stoel MG, Verhorst PM, Erbel R. Remodeling index compared to actual vascular remodeling in atherosclerotic left main coronary arteries as assessed with long-term (> or =12 months) serial intravascular ultrasound. J Am Coll Cardiol. 2006;47:1363–1368. doi: 10.1016/j.jacc.2005.11.055. [DOI] [PubMed] [Google Scholar]
- 6.Schoenhagen P, Tuzcu EM, Apperson-Hansen C, Wang C, Wolski K, Lin S, Sipahi I, Nicholls SJ, Magyar WA, Loyd A, Churchill T, Crowe T, Nissen SE. Determinants of arterial wall remodeling during lipid-lowering therapy: serial intravascular ultrasound observations from the REVERSAL trial. Circulation. 2006;113:2826–2834. doi: 10.1161/CIRCULATIONAHA.105.585703. [DOI] [PubMed] [Google Scholar]
- 7.Sipahi I, Tuzcu EM, Moon KW, Nicholls SJ, Schoenhagen P, Zhitnik J. Do the extent and direction of arterial remodelling predict subsequent progression of coronary atherosclerosis? A serial intravascular ultrasound study. Heart. 2008;94:623–627. doi: 10.1136/hrt.2007.129965. [DOI] [PubMed] [Google Scholar]
- 8.Cheng C, Tempel D, van Haperen R, van der Baan A, Grosveld F, Daemen MJ, Krams R, de Crom R. Atherosclerotic lesion size and vulnerability are determined by patterns of fluid shear stress. Circulation. 2006;113:2744–2753. doi: 10.1161/CIRCULATIONAHA.105.590018. [DOI] [PubMed] [Google Scholar]
- 9.Varnava AM, Mills PG, Davies MJ. Relationship between coronary artery remodeling and plaque vulnerability. Circulation. 2002;105:939–943. doi: 10.1161/hc0802.104327. [DOI] [PubMed] [Google Scholar]
- 10.Okura H, Kobayashi Y, Sumitsuji S, Terashima M, Kataoka T, Masutani M, Ohyanagi M, Shimada K, Taguchi H, Yasuga Y, Takeda Y, Ohashi Y, Awano K, Fujii K, Mintz GS. Effect of culprit-lesion remodeling versus plaque rupture on three-year outcome in patients with acute coronary syndrome. Am J Cardiol. 2009;103:791–795. doi: 10.1016/j.amjcard.2008.11.030. [DOI] [PubMed] [Google Scholar]
- 11.Gerrity RG, Natarajan R, Nadler JL, Kimsey T. Diabetes-induced accelerated atherosclerosis in swine. Diabetes. 2001;50:1654–1665. doi: 10.2337/diabetes.50.7.1654. [DOI] [PubMed] [Google Scholar]
- 12.Stone PH, Coskun AU, Kinlay S, Clark ME, Sonka M, Wahle A, Ilegbusi OJ, Yeghiazarians Y, Popma JJ, Orav J, Kuntz RE, Feldman CL. Effect of endothelial shear stress on the progression of coronary artery disease, vascular remodeling, and instent restenosis in humans: in vivo 6-month follow-up study. Circulation. 2003;108:438–444. doi: 10.1161/01.CIR.0000080882.35274.AD. [DOI] [PubMed] [Google Scholar]
- 13.Coskun AU, Yeghiazarians Y, Kinlay S, Clark ME, Ilegbusi OJ, Wahle A, Sonka M, Popma JJ, Kuntz RE, Feldman CL, Stone PH. Reproducibility of coronary lumen, plaque, and vessel wall reconstruction and of endothelial shear stress measurements in vivo in humans. Catheter Cardiovasc Interv. 2003;60:67–78. doi: 10.1002/ccd.10594. [DOI] [PubMed] [Google Scholar]
- 14.Feldman CL, Coskun AU, Yeghiazarians Y, Kinlay S, Wahle A, Olszewski ME, Rossen JD, Sonka M, Popma JJ, Orav J, Kuntz RE, Stone PH. Remodeling characteristics of minimally diseased coronary arteries are consistent along the length of the artery. Am J Cardiol. 2006;97:13–16. doi: 10.1016/j.amjcard.2005.07.121. [DOI] [PubMed] [Google Scholar]
- 15.Schoenhagen P, Ziada KM, Kapadia SR, Crowe TD, Nissen SE, Tuzcu EM. Extent and direction of arterial remodeling in stable versus unstable coronary syndromes: an intravascular ultrasound study. Circulation. 2000;101:598–603. doi: 10.1161/01.cir.101.6.598. [DOI] [PubMed] [Google Scholar]
- 16.Burke AP, Kolodgie FD, Farb A, Weber D, Virmani R. Morphological predictors of arterial remodeling in coronary atherosclerosis. Circulation. 2002;105:297–303. doi: 10.1161/hc0302.102610. [DOI] [PubMed] [Google Scholar]
- 17.Scheffe H. The analysis of variance. Wiley; New York: 1959. pp. 55–89. [Google Scholar]
- 18.White H. A heteroskedasticity-consistent covariance matrix estimator and a direct test for heteroskedasticity. Econometrica. 1980;48:817–838. [Google Scholar]
- 19.Korshunov VA, Berk BC. Strain-dependent vascular remodeling: the “Glagov phenomenon” is genetically determined. Circulation. 2004;110:220–226. doi: 10.1161/01.CIR.0000134958.88379.2E. [DOI] [PubMed] [Google Scholar]
- 20.Malek AM, Alper SL, Izumo S. Hemodynamic shear stress and its role in atherosclerosis. JAMA. 1999;282:2035–2042. doi: 10.1001/jama.282.21.2035. [DOI] [PubMed] [Google Scholar]
- 21.Gimbrone MA, Jr., Topper JN, Nagel T, Anderson KR, Garcia- Cardena G. Endothelial dysfunction, hemodynamic forces, and atherogenesis. Ann N Y Acad Sci. 2000;902:230–239. doi: 10.1111/j.1749-6632.2000.tb06318.x. [DOI] [PubMed] [Google Scholar]
- 22.Wentzel JJ, Janssen E, Vos J, Schuurbiers JC, Krams R, Serruys PW, de Feyter PJ, Slager CJ. Extension of increased atherosclerotic wall thickness into high shear stress regions is associated with loss of compensatory remodeling. Circulation. 2003;108:17–23. doi: 10.1161/01.CIR.0000078637.21322.D3. [DOI] [PubMed] [Google Scholar]
- 23.Dewey CF, Jr, Bussolari SR, Gimbrone MA, Jr, Davies PF. The dynamic response of vascular endothelial cells to fluid shear stress. J Biomech Eng. 1981;103:177–185. doi: 10.1115/1.3138276. [DOI] [PubMed] [Google Scholar]
- 24.Chatzizisis YS, Jonas M, Beigel R, Coskun AU, Baker AB, Stone BV, Maynard C, Gerrity RG, Daley W, Edelman ER, Feldman CL, Stone PH. Attenuation of inflammation and expansive remodeling by valsartan alone or in combination with simvastatin in high-risk coronary atherosclerotic plaques. Atherosclerosis. 2009;203:387–394. doi: 10.1016/j.atherosclerosis.2008.07.032. [DOI] [PMC free article] [PubMed] [Google Scholar]
- 25.Glagov S, Weisenberg E, Zarins CK, Stankunavicius R, Kolettis GJ. Compensatory enlargement of human atherosclerotic coronary arteries. N Engl J Med. 1987;316:1371–1375. doi: 10.1056/NEJM198705283162204. [DOI] [PubMed] [Google Scholar]
Associated Data
This section collects any data citations, data availability statements, or supplementary materials included in this article.


