Abstract
An in vivo mutation assay has been developed based on flow cytometric enumeration of glycosylphosphatidylinositol (GPI) anchor–deficient rat erythrocytes. With this method, blood is incubated with anti-CD59-PE and SYTO 13 dye, and flow cytometry is used to score the frequency of CD59-negative erythrocytes. The experiments described herein were designed to define the kinetics of mutant erythrocyte appearance and disappearance from peripheral blood to support appropriate treatment and sampling designs for the assay. Wistar Han rats were treated with one of five prototypical mutagens: N-ethyl-N-nitrosourea (ENU); 7,12-dimethyl-1,2-benz[a]anthracene (DMBA); 4-nitroquinoline-1-oxide; benzo[a]pyrene; and N-methyl-N-nitrosourea. ENU and DMBA were also evaluated in Sprague Dawley rats. Animals were treated on three consecutive days (days 1–3) via oral gavage, and blood specimens were obtained on days −1, 4, 15, 30, 45, and 90 (and day 180 for ENU). A second endpoint of genotoxicity, the frequency of peripheral blood micronucleated reticulocytes, was measured on day 4. Each chemical induced micronuclei and the GPI anchor–deficient phenotype. Increased mutant cell frequencies were evident at day 15. Mutant reticulocyte frequencies remained relatively stable for some chemicals, but others peaked and then dropped significantly. The differences in kinetics observed are presumably related to the degree to which mutation occurs in hematopoietic stem cells versus more committed cells with limited self-renewal capacity. Collectively, the results suggest that enumerating GPI anchor–deficient erythrocytes is an efficient means of evaluating the in vivo mutagenic potential of chemicals. The kinetics and ease of scoring this blood-based endpoint suggest that integration into routine toxicology studies will be feasible.
Keywords: mutation, Pig-a gene, CD59, flow cytometry, genotoxicity, erythrocyte
The product of the X-linked Pig-a gene is essential for the synthesis of the glycosylphosphatidylinositol (GPI) anchor that links a specific subset of proteins to the cell surface (Kawagoe et al., 1994). For example, the antigens CD59, CD55, CD24, and CD48 are attached to the cytoplasmic membrane of hematopoietic cells via GPI anchors (Hernandez-Campo et al., 2007). Of the genes required to form GPI anchors, only Pig-a is located on the X chromosome. The gene’s single functional copy status, in combination with its essential role in GPI anchor synthesis, combines to make Pig-a an attractive reporter for in vivo mutation (Araten et al., 1999; Bryce et al., 2008; Chen et al., 2001; Miura et al., 2008a; Phonethepswath et al., 2008). Literature surrounding the etiology of the blood disease paroxysmal nocturnal hemoglobinuria supports this premise as GPI anchor–deficient clones have invariably been found to be bona fide PIG-A mutants (Nafa et al., 1998; Nishimura et al., 1999; Rosse and Ware, 1995). Additionally, Miura et al. (2008b) have sequenced the Pig-a gene in GPI anchor–deficient rat lymphocytes and demonstrated that in this case as well, the anchor–deficient phenotype is virtually equivalent to the mutant genotype.
This laboratory has previously described flow cytometric approaches for measuring in vivo mutation based on a GPI anchor–deficient phenotype (Bryce et al., 2008; Phonethepswath et al., 2008). Those proof-of-principle experiments focused on erythrocytes and were accomplished with both mouse and rat blood specimens. Miura et al. (2008a,b) and Dobrovolsky et al. (2009) successfully applied similar flow cytometric scoring strategies to the analysis of mutant phenotype rat erythrocytes and splenic lymphocytes.
Building on these initial data, we developed a simple two-fluorochrome method suitable for labeling and analyzing erythrocytes in rats and mice. The purpose of the current studies was to determine the kinetics by which mutant phenotype erythrocytes (RBCCD59−) and mutant phenotype reticulocytes (RETCD59−) enter and are eliminated from the circulation, monitoring a period of several months post-exposure to five prototype mutagens in two strains of rat. Dose levels were based on range-finding experiments that suggested that the exposures would be well tolerated and induce measurable increases in mutant phenotype cells. The results are discussed in relation to the feasibility of integrating Pig-a mutation measurements into routine toxicology studies.
MATERIALS AND METHODS
Reagents
Sesame oil, N-ethyl-N-nitrosourea (ENU; CAS. No. 759-73-9), 7,12-dimethyl-1,2-benz[a]anthracene (DMBA; CAS. No. 57-97-6), benzo[a]pyrene (B[a]P; CAS. No. 50-32-8), 4-nitroquinoline-1-oxide (4NQO; CAS. No. 56-57-5), and methylcellulose (CAS. No. 9004-67-5) were purchased from Sigma-Aldrich (St Louis, MO). N-methyl-N-nitrosourea (MNU; CAS. No. 684-93-5) was from Pfaltz & Bauer (Waterbury, CT). PBS (phenol red and divalent cation free) was from Mediatech, Inc. (Herndon, VA). Heparin solution and all reagents necessary to perform the micronucleus analyses as described herein were from In Vivo Rat MicroFlow PLUS Kits (v090203; Litron Laboratories, Rochester, NY). Lympholyte-Mammal cell separation reagent was purchased from CedarLane (Burlington, NC) (CAT. No. CL5110). Anti-rat CD59, clone TH9, was custom conjugated to phycoerythrin by BD Biosciences (San Jose, CA). SYTO 13 was purchased from Invitrogen (Carlsbad, CA) (CAT. No. S-7575).
Animals, Treatments, and Blood Collection
Experiments were conducted with the oversight of the University of Rochester's Institutional Animal Care and Use Committee. Male Wistar Han and Sprague Dawley rats were purchased from Charles River Laboratories (Wilmington, MA). Rodents were allowed to acclimate for approximately 1 week before treatment. Water and food were available ad libitum throughout the acclimation and experimental periods. Each treatment group consisted of five randomly selected rats age 7–8 weeks at the start of treatment. Experiments included a concurrent vehicle control group. All treatments were via oral gavage, 10 ml/kg body weight. Test articles were administered at approximately 24-h intervals on three consecutive days (days 1–3). ENU was administered in PBS (pH 6) at 20 and 40 mg/kg/day; DMBA was administered in sesame oil at 25 and 50 mg/kg/day; MNU was administered in PBS (pH 6) at 15 and 30 mg/kg/day; B[a]P was administered in sesame oil at 125 and 250 mg/kg/day; and 4NQO was suspended in dH2O with 0.5% (vol/vol) methyl cellulose and administered at 12.5 and 25 mg/kg/day.
Blood specimens were collected from each animal on days −1, 4, 15, 30, 45, and 90 (and 180 for ENU). Blood was obtained by nicking a lateral tail vein with a surgical blade after animals were warmed briefly under a heat lamp. Approximately 50–100 μl of free-flowing blood were collected directly into heparinized capillary tubes (Fisher Scientific; CAT. No. 22-260-950). Immediately upon collection, 30 μl of each blood specimen was transferred to tubes containing 100 μl heparin solution (500 units/ml PBS) where they remained at room temperature for less than 2 h, after which time, they were either immediately leukodepleted as described below or else stored at 4°C until leukodepletion occurred (within 1 h).
Cell Staining: Pig-a
Each whole blood/heparin specimen (130 μl) was layered on top of 3 ml room temperature Lympholyte solution. Specimens were centrifuged at 800 × g for 20 min to enrich for erythrocytes. The resulting supernatants were aspirated, and 300 μl PBS was gently added to each tube while taking care not to disturb the erythrocyte pellet. The PBS rinse solution was removed, and a second volume of PBS (300 μl/tube) was added as before. After removing the second rinse volume, 155 μl of PBS was added to each tube. Cells were resuspended with gentle pipetting, and 150 μl from each tube was transferred to new 15-ml polypropylene tubes containing 100 μl working anti-CD59-PE solution (3 parts stock antibody to 17 parts PBS + 2% fetal bovine serum). After incubating for 30 min on ice, each cell suspension was added to a new tube containing 10 ml PBS. After centrifugation and aspiration, pellets were resuspended with 1 ml nucleic acid dye solution (157nM SYTO 13, prepared in PBS). After incubating for 30 min at 37°C, samples were placed on ice until flow cytometric analysis (within approximately 2 h).
Instrument Calibration Standard: Pig-a
An instrument calibration standard was prepared on each day of analysis by creating a specimen with approximately 50% wild-type cells and 50% mutant-mimicking cells. The mutant-mimicking cells were generated from rat blood that was fractionated and stained with SYTO 13 as described above but was not incubated with anti-CD59-PE. Immediately before experimental samples were analyzed, equal volumes of these mutant-like RBCs were added to a tube of fully stained cells (SYTO 13 and anti-CD59-PE). The resulting instrument calibration standard provided sufficient numbers of RBCs that exhibited a full range of PE and SYTO 13 fluorescence intensities that were useful for optimizing photomultiplier tube (PMT) voltages and fluorescence compensation settings on a daily basis. The position of the CD59-negative cells also provided a rational approach for defining the vertical demarcation line that was used to distinguish mutant and wild-type cells.
Data Acquisition: Pig-a
A FACSCalibur flow cytometer (BD Biosciences) providing 488 nm excitation and running CellQuest Pro v5.2 software were used for these studies. For measurement of the frequency of RBCCD59− cells, data acquisition was triggered on the forward scatter parameter, and the fluidics rate was set to low. This facilitated efficient collection of 1 × 10⁶ RBCs per specimen (≤ 5 min). As these forward scatter–triggered analyses acquired 1 × 10⁶ RBCs per specimen, they also provided a means to measure the frequency of reticulocytes (RETs) in total RBCs.
For analyses where the frequency of RETCD59− was measured, the fluidics rate was medium and the data acquisition trigger was set on SYTO 13–associated fluorescence. This SYTO 13 threshold value was set sufficiently high such that the majority of red blood cells (i.e., mature erythrocytes that lack RNA) were eliminated from consideration. This strategy reduced file sizes and also allowed for a greater fluidics rate, making it feasible to evaluate between 0.3 × 10⁶ and 1 × 10⁶ RETs per specimen in 15–20 min.
Micronucleus Assay, Cell Staining, and Data Acquisition
Micronucleated reticulocyte (MN-RET) measurements were performed on day 4 blood specimens using a FACSCalibur flow cytometer providing 488 nm excitation. The necessary reagents and instructions for their use were from In Vivo Rat MicroFlow PLUS Kits as described in detail elsewhere (Dertinger et al., 2004; MacGregor et al., 2006; Torous et al., 2003). Kit-supplied malaria-infected erythrocytes served as biological standards and guided instrument settings on each day of analysis (Dertinger et al., 2000; Tometsko et al., 1993). The frequency of MN-RET was determined upon the acquisition of 20,000 CD71-positive RETs per blood sample unless cytotoxicity was extreme.
Calculations and Statistical Analyses
Calculations of frequency, average, SEM, and arcsin-square root transformations were performed with Excel Office X for Mac (Microsoft, Seattle, WA). All statistical tests described below used p < 0.05 to indicate significance.
Pig-a assay.
The frequency of mutant phenotype RBCs is expressed as the number of RBCCD59− per 1 million total RBCs. The frequency of mutant phenotype RETs is expressed as the number of RETCD59− per 1 million total RETs. For graphical presentations, each mutagen-treated group’s RET values are expressed as a percentage of the mean vehicle control value at that same time-point.
Pig-a data were analyzed with SAS (v 9.1) and Matlab (v 2008a). The primary endpoints included the frequency of RETs, the frequency of RETCD59−, and the frequency of RBCCD59− as measured by flow cytometry. The effect of treatment on each endpoint was considered at each individual time-point using the nonparametric Kruskal-Wallis test. When significance was reached, pairwise comparisons based on the Wilcoxon rank sum test were performed to further evaluate vehicle against each of the other treatment groups. Additionally, in order to assess the overall significance of treatment effect across time-points, the p values obtained either from the Kruskal-Wallis tests or from the Wilcoxon rank sum tests (days 4–90) were combined using Fisher’s combination method. The associated (overall) p value was computed for each endpoint using a permutation approach. This was done separately for each endpoint and for RBCCD59− and RETCD59− jointly. Finally, mixed effects models, including a random intercept that modeled the between-experiment variability, were used to describe values of the endpoints at baseline and to compute 95% confidence intervals for the mean measurement.
Micronucleus assay.
For each blood specimen, the proportion of MN-RET among RETs was transformed in Excel as follows: transformed data = asin(sqrt(proportion of MN-RET)). One-way ANOVA was used to evaluate the effect of treatment on these transformed MN-RET proportions (JMP software, v5.0 for Mac). If p < 0.05, each treatment group was compared to vehicle control using Dunnett’s multiple comparison t-test.
RESULTS
Pig-a staining strategy
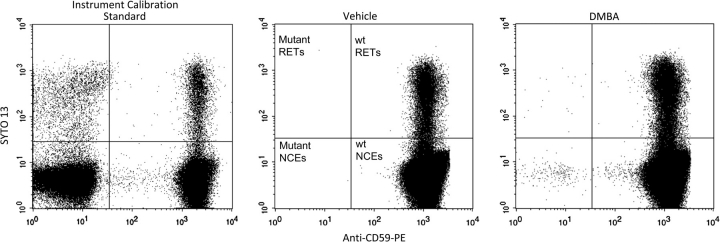
With minor modifications, our previously reported approach for scoring GPI anchor–deficient mouse erythrocytes using a simple two-color staining scheme (Phonethepswath et al., 2008) was found to be effective for rat blood. Figure 1 describes the gating logic that was used to restrict analyses to erythrocytes. This strategy was used to exclude any platelets and leukocytes that may have remained after the leukodepletion step. Fluorescence profiles of gated events (erythrocytes) are shown in Figure 2. The nucleic acid dye SYTO 13 was observed to resolve mature erythrocytes from RETs, while the anti-CD59-PE reagent provided more than two logs of fluorescent resolution between wild-type and GPI anchor–deficient erythrocytes. Data compiled from each of the 75 day −1 Wistar rat specimens (15 rats per study × five studies) are provided in Table 1. These data demonstrate consistent low spontaneous mutation frequency measurements, a critical requirement for this extremely rare event scoring application.
FIG. 1.
Three bivariate graphs illustrate the gating logic used for the mutant scoring application described herein. The strategy is used to restrict the mutation measurements depicted in Figure 2 to erythrocytes only. Left: Events must fall within a region that is designed to exclude subcellular debris and platelets. Middle: Events must fall within a region that accommodates mature erythrocytes and reticulocytes but excludes leukocytes based on their intense SYTO 13 fluorescence signal. Right: Events must fall within a region that excludes aggregates as well as cells that are coincident at the laser-stream intersect.
FIG. 2.
Bivariate plots of representative SYTO 13 versus anti-CD59-PE fluorescence profiles (gated events, i.e., erythrocytes). Left: Instrument calibration standard; mutant-mimicking cells were spiked into blood that was processed according to the standard protocol. This specimen provides enough events with a full range of fluorescence intensities to optimize PMT voltages and compensation settings. This calibration standard also provides a means for rationally and consistently setting the position of the vertical demarcation line that discriminates mutant versus nonmutant cells. Middle: Vehicle control rat blood; note the very low incidence of cells in the upper left and lower left quadrants. These anti-CD59-negative events are Pig-a mutant phenotype reticulocytes and mature erythrocytes, respectively. Right: Blood obtained 45 days after treatment with the mutagen DMBA. Note the elevated numbers of events that appear in the upper left and lower left quadrants, i.e., Pig-a mutant phenotype reticulocytes and mature erythrocytes, respectively.
TABLE 1.
Compilation of Wistar Han Predosing (Day −1) Specimens of 75 Individuals
| Variable | Mean | SD | SEM | Upper 95% confidence interval | Lower 95% confidence interval |
| %RET | 5.12 | 1.49 | 0.60 | 6.31 | 3.93 |
| RBCCD59− × 10−6 | 1.33 | 1.20 | 0.17 | 1.67 | 1.0 |
| RETCD59− × 10−6 | 3.13 | 3.13 | 0.48 | 4.09 | 2.18 |
Pig-a overview
The results of seven studies involving five mutagens are described below. RETCD59− and RBCCD59− frequencies were found to be significantly elevated (p < 0.05) for each of the five mutagenic chemicals at each of the dose levels studied. All p values are reported in a Supplemental material.
Wistar: N-ethyl-N-nitrosourea
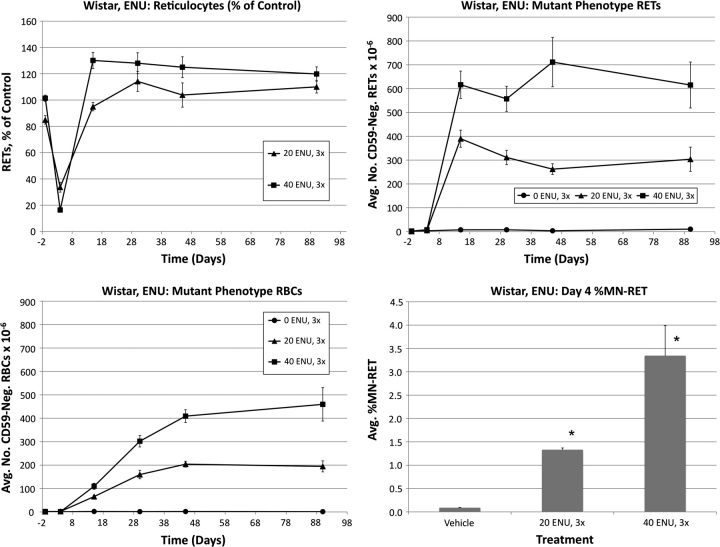
Frequencies of RETs, RETCD59−, RBCCD59− and MN-RET following treatment of Wistar rats with ENU are shown in Figure 3. Pronounced reductions of RET frequencies were evident for both ENU groups on day 4. The low-dose group returned to control levels by day 15, whereas a rebound response was evident at this time-point for the high dose as greater than control frequencies were observed.
FIG. 3.
Frequencies of RETs, RETCD59−, RBCCD59−, and MN-RET following treatment with ENU, Wistar rats. Upper left: Average reticulocytes values as a percentage of vehicle control as a function of time relative to treatments that occurred on days 1–3. Error bars are SEM. Upper right: Average mutant phenotype reticulocyte frequencies as a function of time. Error bars are SEM. Lower left: Average mutant phenotype erythrocyte frequencies as a function of time. Error bars are SEM. Lower right: Average MN-RET frequencies at day 4 as a function of dose. Error bars are SEM. Asterisks denote statistical significance, p < 0.05 (Dunnett’s test).
RETCD59− values rose rapidly, with essentially maximal values observed by day 15. This effect remained relatively stable through day 90. RBCCD59− frequencies increased in a dose-dependent manner by day 15 and appeared to stabilize by approximately day 45. Interestingly, even by day 90, the absolute frequency of RBCCD59− was moderately lower than that of RETCD59−.
As shown in Figure 3, ENU also caused significant cytogenetic damage, as evidenced by increased %MN-RET values.
Wistar: N-methyl-N-nitrosourea
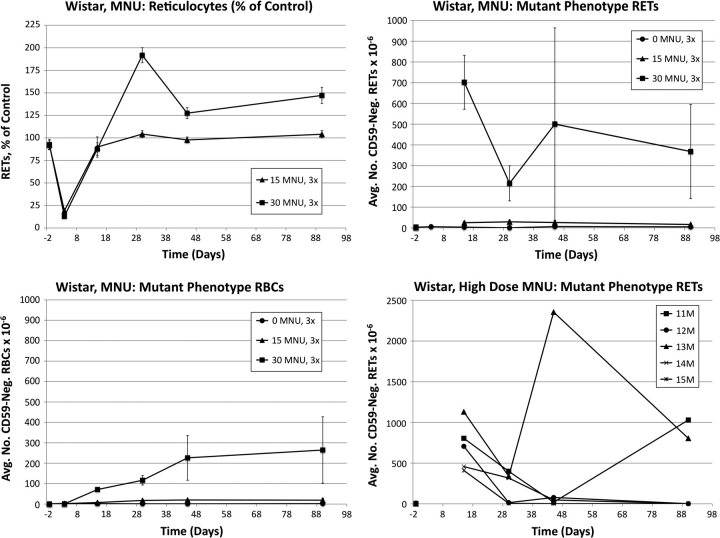
Frequencies of RETs, RETCD59−, RBCCD59− and MN-RET following treatment of Wistar rats with MNU are shown in Figure 4. MNU caused pronounced reductions of RET frequencies on day 4: 84 and 87% reduction for low- and high-dose groups, respectively. Whereas the low-dose group’s RET frequencies returned to control-like values for the remainder of the study, by day 30, the high-dose group overshot controls and remained significantly elevated through day 90.
FIG. 4.
Frequencies of RETs, RETCD59−, and RBCCD59− following treatment with MNU, Wistar rats. Data are formatted as in Figure 3, except that RETCD59− frequencies are not graphed for day 4 (too few RETs were acquired); also, the lower right panel does not portray micronucleus values but rather mutant phenotype reticulocyte values of individual animals in the high-dose group as a function of time.
At day 15, RETCD59− values were dramatically elevated in each animal that received the high dose of MNU (average ± SEM = 702 ± 130 × 10−6). While these frequencies were similar in magnitude to those observed for the high-dose group of ENU-treated animals, unlike ENU, the MNU-induced RETCD59− values fell considerably by day 30 in each of the five high-dose animals (215 ± 85 × 10−6). From this time-point forward, RETCD59− values were highly variable. As shown in the lower right panel of Figure 4, the majority of the rats in the high-dose group exhibited near-baseline RETCD59− values at the last two time-points (four of five rats near baseline at day 45 and three of five on day 90). In marked contrast to these rats, #13M’s RETCD59− frequency rose to an extremely high value on day 45 (2356 × 10−6) and remained elevated at day 90. Rat #11M was at baseline frequency at day 45 but increased significantly by day 90. Clonal expansion is the most likely explanation for the increased mutant frequencies in these two animals at the late time-points.
The mean RBCCD59− frequencies were observed to increase in a dose-dependent manner, and the effect of treatment was statistically significant at day 15 through day 45 for the high-dose group and at day 30 through day 45 for the low-dose group. Unlike ENU, the low MNU dose produced a minimal response compared to the high-dose group, despite the fact that dose spacing (1/2) for both agents was the same. The RBCCD59− response appeared to achieve a maximal value at about day 45.
While elevated MN-RET frequencies were noted in MNU-treated animals, CD71-positive RET frequencies were so low that quantitative analysis of micronuclei was deemed inappropriate.
Wistar: 7,12-dimethyl-1,2-benz[a]anthracene
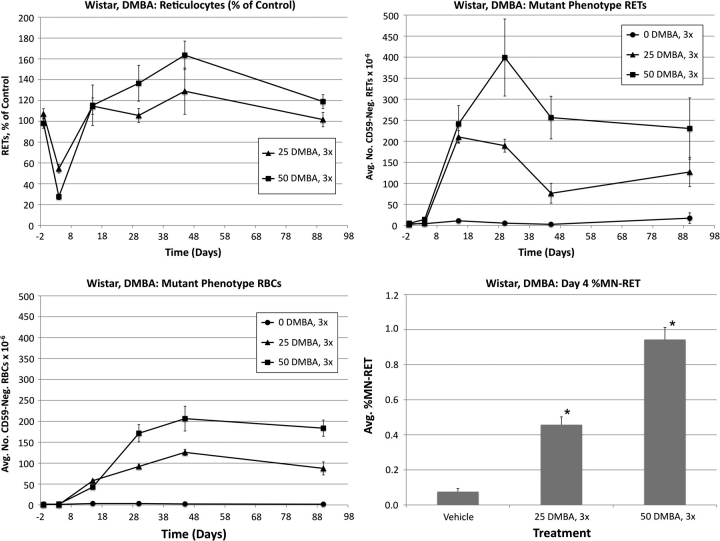
Frequencies of RETs, RETCD59−, RBCCD59−, and MN-RET following treatment of Wistar rats with DMBA are shown in Figure 5. Treatment with low and high doses of DMBA substantially reduced RET frequencies relative to controls. The low-dose group returned to control levels by day 15, whereas the high-dose group’s %RET values tended to remain modestly higher, although not significantly so.
FIG. 5.
Frequencies of RETs, RETCD59−, RBCCD59−, and MN-RET following treatment with DMBA, Wistar rats. Data are formatted as in Figure 3.
The low-dose group exhibited a maximal RETCD59− response on day 15, whereas the high-dose group did not peak until day 30. Regardless of DMBA dose, following a peak, a reduction to RETCD59− frequency was observed before a plateau became evident. Mean RBCCD59− frequencies were significantly elevated in treated animals on days 15–90. These increases were dose related at day 30 and onward. As with the other chemicals, DMBA-induced RBCCD59− frequencies reached a maximum at about day 45, remaining relatively constant thereafter.
As shown in Figure 5, DMBA also increased the frequency of MN-RET in a dose-dependent manner.
Wistar: 4-nitroquinoline-1-oxide
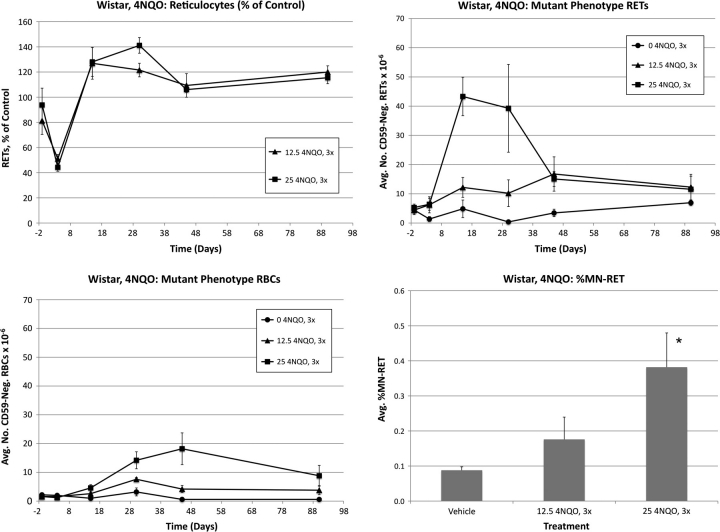
Frequencies of RETs, RETCD59−, RBCCD59−, and MN-RET following treatment of Wistar rats with 4NQO are shown in Figure 6. At day 4, mean RET values were significantly affected by both low and high 4NQO dose levels: 49 and 66% reduction relative to control, respectively. Both 4NQO treatment groups rebounded strongly and exhibited significantly elevated frequencies relative to control values on day 30.
FIG. 6.
Frequencies of RETs, RETCD59−, RBCCD59−, and MN-RET following treatment with 4NQO, Wistar rats. Data are formatted as in Figure 3.
As noted for the other chemicals, a maximal RETCD59− response occurred earlier than that observed for the total RBC cohort. Peak values were observed in the high-dose group on day 15, with a considerable reduction evident between days 30 and 45. Mean RBCCD59− frequencies exhibited significant treatment-related effects at day 15 and onward. 4NQO-induced RBCCD59− values reached a maximum on day 45, with a slight reduction thereafter.
The high dose of 4NQO was also observed to significantly increase the frequency of MN-RET.
Wistar: benzo[a]pyrene
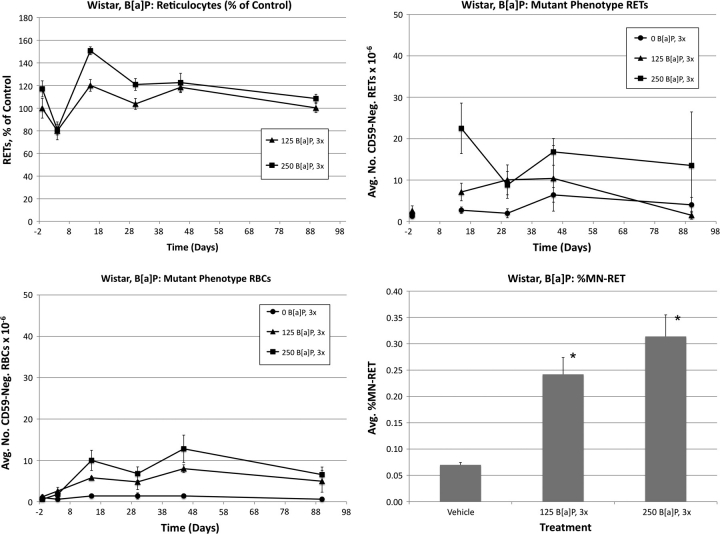
Frequencies of RETs, RETCD59−, RBCCD59−, and MN-RET following treatment of Wistar rats with B[a]P are shown in Figure 7. B[a]P treatments caused modest reductions to day 4 RET values that were not statistically significant (19 and 33%). Even so, both the low-dose and the high-dose groups exhibited significantly higher frequencies than controls at the day 15 time-point.
FIG. 7.
Frequencies of RETs, RETCD59−, RBCCD59−, and MN-RET following treatment with B[a]P, Wistar rats. Data are formatted as in Figure 3, except that RETCD59− frequencies are not graphed for day 4 (inadvertently too few RETs were acquired).
Mean RBCCD59− frequencies were significantly elevated in both B[a]P dose groups on days 15 and 45. Greater but more variable RETCD59− values were evident on day 15 for the high-dose group. Both doses of B[a]P significantly increased blood MN-RET values.
Sprague Dawley: N-ethyl-N-nitrosourea
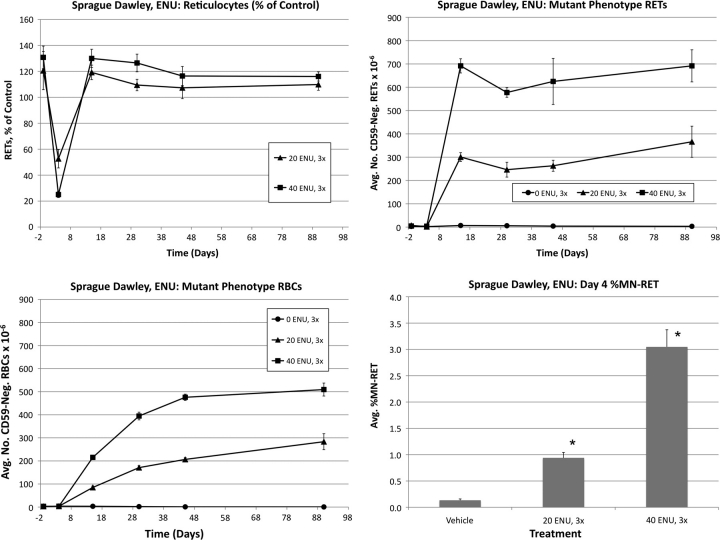
ENU was also studied in a second strain of rat (Sprague Dawley). The resulting data are shown in Figure 8. Both the magnitude and the kinetics of the RET, RBCCD59−, and RETCD59− responses are very similar to those observed for Wistar Han rats treated at the same dose levels. Low and high ENU dose levels increased day 4 MN-RET frequencies, but mean values were slightly lower than those observed for Wistar rats.
FIG. 8.
Frequencies of RETs, RETCD59−, RBCCD59−, and MN-RET following treatment with ENU, Sprague Dawley rats. Data are formatted as in Figure 3.
Sprague Dawley: 7,12-dimethyl-1,2-benz[a]anthracene
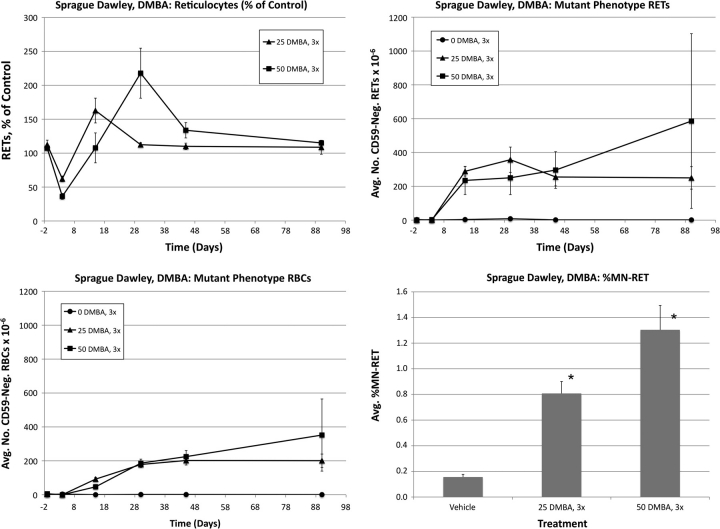
DMBA was also studied in a second strain of rat (Sprague Dawley). The resulting data are shown in Figure 9. The magnitudes of the RBCCD59−, RETCD59− and MN-RET responses were all fairly similar in Wistar and Sprague Dawley rats, but the kinetics of RETCD59− were somewhat different as Sprague Dawley did not show the same, pronounced, decreased frequency between days 30 and 45 that was observed in Wistar rats
FIG. 9.
Frequencies of RETs, RETCD59−, RBCCD59−, and MN-RET following treatment with DMBA, Sprague Dawley rats. Data are formatted as in Figure 3.
Persistence of increased mutant frequencies
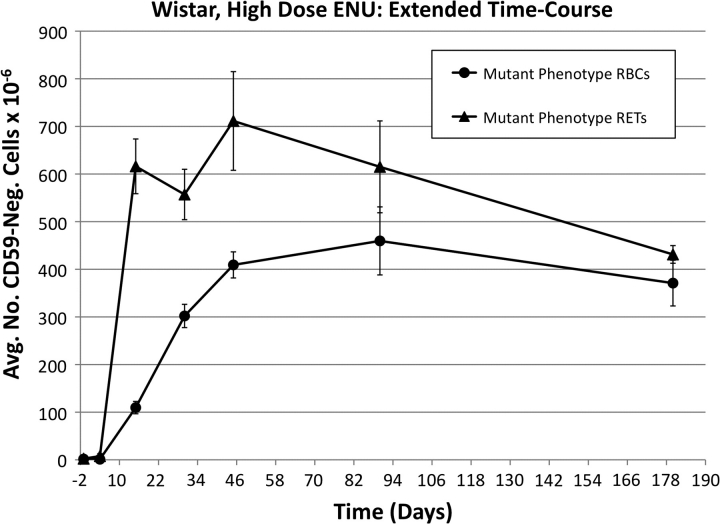
As the RBCCD59− and RETCD59− responses for ENU appeared relatively constant between the day 45 and 90 time-points, we extended the observation period of the animals in the high-dose group of Wistar rats to day 180 (6 months). As shown in Figure 10, the RBCCD59− response remained stable, while the mean RETCD59− frequency appeared to drop modestly between days 90 and 180 such that the RBCCD59− and RETCD59− frequencies were essentially the same at the terminal time-point.
FIG. 10.
Average mutant phenotype erythrocyte and mutant phenotype reticulocyte frequencies as a function of time after treatment with 40 mg ENU/kg/day for 3 days, Wistar rats. Error bars are SEM. Mutant frequencies remain highly elevated for 6 months, implying that hematopoietic stem cells are a major target of ENU mutation.
DISCUSSION
The kinetics data for five prototypical genotoxicants presented herein support the continued development and validation of Pig-a–based mutation assays. Each of the two rat strains studied showed robust mutation responses following treatment. In the case of ENU, the two strains' RETCD59− and RBCCD59− kinetics and yields were very similar. While the magnitude of high-dose DMBA mutation frequencies was similar across strains, the kinetics and also the degree to which low and high doses resolved themselves differed. Differences in metabolism between the two strains may explain this finding as DMBA requires metabolic activation to exert its mutagenic effect.
The simple, efficient, and minimally invasive in vivo mutation assay described herein complements the current regulatory emphasis on cytogenetic damage endpoints (U.S. Food and Drug Administration Office of Food Additive Safety, Redbook, 2000). The characteristics of this assay are also well suited to help fill two important technological gaps in risk assessment of genotoxic agents: (1) lack of a simple and inexpensive method for monitoring mutations in vivo, one of the key events in the multistep process of carcinogenesis and (2) the need for more quantitative methods to more accurately define dose-response curves over a wide range of doses as a function of time (Pottenger and Gollapudi, 2009). Furthermore, the kinetics and ease of sampling and scoring of this assay are favorable to integration of mutagenicity measurements into routine toxicology studies, including those conducted in nonrodent species. Additionally, as evidence mounts that cancer may be best understood as a stem cell disease (Bonnet and Dick, 1997; Dalerba et al., 2007; Dick, 2008; Reya et al., 2001), the value of genotoxicity endpoints that are capable of evaluating the effects of damage to stem cells becomes increasingly important.
Regarding this last point, it is noteworthy that mutant phenotype erythrocytes tended to persist for at least 90 days following acute treatments. The 6-month ENU data presented herein demonstrate that aberrant cell frequencies persist both in the most recently formed and in the short-lived fraction of erythrocytes (reticulocytes). Miura et al. (2009) also noted increased ENU-induced RBCCD59− frequencies up to 6 months after treatment. While it is not known how long a cohort of committed erythroid progenitors contribute to red cell production in vivo, these progenitors normally mature over a period of 7–14 days in vitro (Iscove and Sieber, 1975). In the setting of bone marrow transplantation, stable hematopoietic stem cell–derived blood cell synthesis is reestablished within 4–6 months (Jordan and Lemischka, 1990). These studies are consistent with the notion that only hematopoietic stem cells have the necessary longevity to continually produce new mutant erythrocytes for this period of time. A lesion at the level of the hematopoietic stem cell is also consistent with the observation of similar mutation frequencies by Miura et al. (2008b) both in RBCs and in splenic lymphocytes.
Given the short-term treatment schedule used herein, the maximum incidence of mutant reticulocytes was observed to occur within about 2 weeks, whereas approximately 45 days was required to reach the maximal RBCCD59− frequency. This latter value is in good agreement with that of Miura et al. (2009), who observed maximal effects at approximately 6 weeks. However, it should be emphasized that acute dosing is not necessarily a study design of choice. While this design was valuable for defining the kinetics and behavior of mutant phenotype cells in circulation, the data presented herein suggest that mutant cells will accumulate with repeat dosing, a scenario that would make protracted administration schedules a more sensitive format for detecting weak mutagens. This view is consistent with that of Miura et al. (2009), who showed that mutant frequencies induced by a high dose of ENU could be recapitulated by fractionating the same total dose over time. For integration with repeat dose study designs, the preferable target cell population is the RETs because the lag time from dosing to maximum induced frequency is much shorter than is the case with the RBC population. Indeed, data recently generated by our laboratory based on 28 consecutive days of exposure, with a day 29 blood harvest, suggest that this widely used toxicology study design is highly compatible with Pig-a mutation assessment when the primary endpoint is RETCD59− as opposed to RBCCD59− (manuscript in preparation).
It is interesting to compare the data from the ENU and MNU experiments. While these agents are both monofunctional alkylators that have a high affinity for oxygen atoms, their DNA adduct profiles differ considerably. Phosphotriesters and N7-G adducts are the first and second most common lesions induced by ENU, but the prevalence of these adducts is reversed in the case of MNU exposure (Beranek, 1990). Such physiochemical properties are likely responsible for the majority of the response differences we observed.
The ENU and MNU Pig-a results are also noteworthy because they support consideration of a flexible experimental design. Specifically, in the case of a positive result, whether the study design involves acute or protracted exposure, additional information may be gained by holding select animals for an extended period of time after treatment ceases. Although these two chemicals induced RETCD59− responses that were initially similar for the high-dose groups, the ENU response persisted, while the majority of MNU animals showed a reduction that achieved near-baseline values by day 45. This differential persistence presumably relates to the target cells being mutated. Thus, these data suggest that ENU mutates stem cells more effectively than MNU, whereas MNU predominately affects committed progenitor cells that have limited proliferative capacity. The significance of stem cell versus committed progenitor mutation requires further study but may become important for future risk assessment models, especially if data continue to support the importance of stem versus progenitor cell–derived leukemogenesis (Passague and Weissman, 2005). Of course, one caveat of the late time-point analyses is also evident in the MNU data set—as time passes, it is possible that mutant cell frequency can become driven by activation and expansion of mutant hematopoietic stem cells. A direct but rather resource-intense approach to address this concern would be to follow up an erythroid lineage response with analyses performed on lymphocytes from the same animals. By challenging lymphocytes to form colonies in the presence of the pore-forming toxin aerolysin (a high-affinity GPI ligand), it is possible to derive Pig-a gene sequence data (Miura et al., 2008b). We believe that more routine and practical solutions will allow one to effectively mitigate against occasional instances of clonal expansion/dominance; for instance, the collection of longitudinal data, an experimental design that would tend to highlight such occurrences.
More work is needed to fully understand the significance and merit of Pig-a–based mutation assays. For instance, in order to critically evaluate the sensitivity and specificity of the endpoint, it will be important to study additional mutagenic agents as well as nonmutagens tested to maximum tolerated doses. Data to date are encouraging and suggest that the assay may provide a cross-species endpoint with kinetics and blood-based characteristics that make it well suited for integration into routine toxicology and carcinogenicity studies.
SUPPLEMENTARY MATERIAL
Supplementary data are available online at http://toxsci.oxfordjournals.org/.
FUNDING
National Institutes of Health-National Institute of Environmental Health Sciences (1R44ES015940 to S.D.D.).
Supplementary Material
Acknowledgments
The contents are the sole responsibility of the authors and do not necessarily represent the official views of the institutions with which they are affiliated or of the National Institute of Environmental Health Sciences. The authors would like to thank Ron Fiedler, Robert Heflich, Vasily Dobrovolsky, George Douglas, and Daishiro Miura for many fruitful discussions. Litron has filed patent applications that relate to mutation measurements based on the GPI anchor deficiency phenotype as a means to quantify Pig-a gene mutation frequency.
References
- Araten DJ, Nafa K, Pakdeesuwan K, Luzzatto L. Clonal populations of hematopoietic cells with paroxysmal nocturnal hemoglobinuria genotype and phenotype are present in normal individuals. Proc. Natl. Acad. Sci. U.S.A. 1999;96:5209–5214. doi: 10.1073/pnas.96.9.5209. [DOI] [PMC free article] [PubMed] [Google Scholar]
- Beranek DT. Distribution of methyl and ethyl adducts following alkylation with monofunctional alkylating agents. Mutat. Res. 1990;231:11–30. doi: 10.1016/0027-5107(90)90173-2. [DOI] [PubMed] [Google Scholar]
- Bonnet D, Dick JE. Human acute myeloid leukemia is organized as a hierarchy that originates from a primative hematopoietic cell. Nat. Med. 1997;3:730–737. doi: 10.1038/nm0797-730. [DOI] [PubMed] [Google Scholar]
- Bryce SM, Bemis JC, Dertinger SD. In vivo mutation assay based on the endogenous pig-a locus. Environ. Mol. Mutagen. 2008;49:256–264. doi: 10.1002/em.20379. [DOI] [PubMed] [Google Scholar]
- Chen R, Eshleman JR, Brodsky RA, Medof ME. Glycophosphatidylinositol-anchored protein deficiency as a marker of mutator phenotypes in cancer. Cancer Res. 2001;61:654–658. [PubMed] [Google Scholar]
- Dalerba P, Cho RW, Clarke MF. Cancer stem cells: models and concepts. Annu. Rev. Med. 2007;58:267–284. doi: 10.1146/annurev.med.58.062105.204854. [DOI] [PubMed] [Google Scholar]
- Dertinger SD, Camphausen K, MacGregor JT, Bishop ME, Torous DT, Avlasevich S, Cairns S, Tometsko CR, Menard C, Muanza T, et al. Three-color labeling method for flow cytometric measurement of cytogenetic damage in rodent and human blood. Environ. Mol. Mutagen. 2004;44:427–435. doi: 10.1002/em.20075. [DOI] [PubMed] [Google Scholar]
- Dertinger SD, Torous DK, Hall NE, Tometsko CR, Gasiewicz TA. Malaria-infected erythrocytes serve as biological standards to ensure reliable and consistent scoring of microucleated erythrocytes by flow cytometry. Mutat. Res. 2000;464:195–200. doi: 10.1016/s1383-5718(99)00183-7. [DOI] [PubMed] [Google Scholar]
- Dick J. Stem cell concepts renew cancer research. Blood. 2008;112:4793–4807. doi: 10.1182/blood-2008-08-077941. [DOI] [PubMed] [Google Scholar]
- Dobrovolsky VN, Boctor SY, Twaddle NC, Doerge DR, Bishop ME, Manjanatha MG, Kimoto T, Miura D, Heflich RH, Ferguson SA. Flow cytometric detection of Pig-A mutant red blood cells using an erythroid-specific antibody: application of the method for evaluating the in vivogenotoxicity of methylphenidate in adolescent rats. Environ. Mol. Mutagen. 2009 doi: 10.1002/em.20519. (Forthcoming) doi: 10.1002/em.20519. [DOI] [PubMed] [Google Scholar]
- Hernandez-Campo PM, Almeida J, Matarraz S, de Santiago M, Luz Sanchez M, Orfao A. Quantitative analysis of the expression of glycosylphosphatidylinositol-anchored proteins during the maturation of different hematopoietic cell compartments of normal bone marrow. Cytometry. 2007;72B:34–42. doi: 10.1002/cyto.b.20143. [DOI] [PubMed] [Google Scholar]
- Iscove NN, Sieber F. Erythroid progenitors in mouse bone marrow detected by macroscopic colony formation in culture. Exp. Hematol. 1975;3:32–43. [PubMed] [Google Scholar]
- Jordan CT, Lemischka IR. Clonal and systemic analysis of long-term hematopoiesis in the mouse. Genes Dev. 1990;4:220–232. doi: 10.1101/gad.4.2.220. [DOI] [PubMed] [Google Scholar]
- Kawagoe K, Takeda J, Endo Y, Kinoshita T. Molecular cloning of murine Pig-a, a gene for GPI-anchor biosynthesis, and demonstration of interspecies conservation of its structure, function, and genetic locus. Genomics. 1994;23:566–574. doi: 10.1006/geno.1994.1544. [DOI] [PubMed] [Google Scholar]
- MacGregor JT, Bishop ME, McNamee JP, Hayashi M, Asano N, Wakata A, Nakajima M, Saito J, Aidoo A, Moore MM, et al. Flow cytometric analysis of micronuclei in peripheral blood reticulocytes: II. An efficient method of monitoring chromosomal damage in the rat. Tox. Sci. 2006;94:92–107. doi: 10.1093/toxsci/kfl076. [DOI] [PubMed] [Google Scholar]
- Miura D, Dobrovolsky VN, Kasahara Y, Katsuura Y, Heflich RH. Development of an in vivo gene mutation assay using the endogenous Pig-A gene: I. Flow cytometric detection of CD59-negative peripheral red blood cells and CD48-negative spleen T-cells from the rat. Environ. Mol. Mutagen. 2008a;49:614–621. doi: 10.1002/em.20414. [DOI] [PubMed] [Google Scholar]
- Miura D, Dobrovolsky VN, Kimoto T, Kasahara Y, Heflich RH. Accumulation and persistence of Pig-A mutant peripheral red blood cells following treatment of rats with single and split doses of N-ethyl-N-nitrosourea. Mutat. Res. 2009;677:86–92. doi: 10.1016/j.mrgentox.2009.05.014. [DOI] [PubMed] [Google Scholar]
- Miura D, Dobrovolsky VN, Mittelstaedt RA, Kasahara Y, Katsuura Y, Heflich RH. Development of an in vivo gene mutation assay using the endogenous Pig-A gene: II. Selection of Pig-A mutant rat spleen T-cells with proaerolysin and sequencing Pig-A cDNA from the mutants. Environ. Mol. Mutagen. 2008b;49:622–630. doi: 10.1002/em.20413. [DOI] [PubMed] [Google Scholar]
- Nafa K, Bessler M, Castro-Malaspina H, Jhanwar S, Luzzatto L. The spectrum of somatic mutations in the PIG-A gene in paroxysmal nocturnal hemoglobinuria includes large deletions and small duplications. Blood Cells Mol. Dis. 1998;24:370–384. doi: 10.1006/bcmd.1998.0203. [DOI] [PubMed] [Google Scholar]
- Nishimura J, Murakami Y, Kinoshita T. Paroxysmal nocturnal hemoglobinuria: an acquired genetic disease. Am. J. Hematol. 1999;62:175–182. doi: 10.1002/(sici)1096-8652(199911)62:3<175::aid-ajh7>3.0.co;2-8. [DOI] [PubMed] [Google Scholar]
- Passague E, Weissman IL. Leukemic stem cells: where do they come from? Stem Cell Rev. 2005;1:181–188. doi: 10.1385/SCR:1:3:181. [DOI] [PubMed] [Google Scholar]
- Phonethepswath S, Bryce SM, Bemis JC, Dertinger SD. Erythrocyte-based Pig-a gene mutation assay: demonstration of cross-species potential. Mutat. Res. 2008;657:122–126. doi: 10.1016/j.mrgentox.2008.08.011. [DOI] [PMC free article] [PubMed] [Google Scholar]
- Pottenger LH, Gollapudi BB. A case for a new paradigm in genetic toxicology testing. Mutat. Res. 2009;678:148–151. doi: 10.1016/j.mrgentox.2009.07.003. [DOI] [PubMed] [Google Scholar]
- Reya T, Morrison SJ, Clarke MF, Weissman IL. Stem cells, cancer, and cancer stem cells. Nature. 2001;414:105–111. doi: 10.1038/35102167. [DOI] [PubMed] [Google Scholar]
- Rosse WF, Ware RE. The molecular basis of paroxysmal nocturnal hemoglobinuria. Blood. 1995;86:3277–3286. [PubMed] [Google Scholar]
- Tometsko AM, Torous DK, Dertinger SD. Analysis of micronucleated cells by flow cytometry. 1. Achieving high resolution with a malaria model. Mutat. Res. 1993;292:129–135. doi: 10.1016/0165-1161(93)90140-u. [DOI] [PubMed] [Google Scholar]
- Torous DK, Hall NE, Murante FG, Gleason SE, Tometsko CR, Dertinger SD. Comparative scoring of micronucleated reticulocytes in rat peripheral blood by flow cytometry and microscopy. Tox. Sci. 2003;74:309–314. doi: 10.1093/toxsci/kfg143. [DOI] [PubMed] [Google Scholar]
- U.S. Food and Drug Administration Office of Food Additive Safety, Redbook. Toxicological Principles for the Safety Assessment of Food Ingredients. Washington, D.C: U.S. Food and Drug Administration; 2000. Available at: www.cfsan.fda.gov/guidance.html. Revised July 2007. Accessed December 10, 2009. [Google Scholar]
Associated Data
This section collects any data citations, data availability statements, or supplementary materials included in this article.


