

Abstract
Triclosan (5-chloro-2-(2,4-dichlorophenoxy)-phenol) is a chlorinated phenolic antibacterial compound found in consumer products. In vitro human pregnane X receptor activation, hepatic phase I enzyme induction, and decreased in vivo total thyroxine (T4) suggest adverse effects on thyroid hormone homeostasis. Current research tested the hypothesis that triclosan decreases circulating T4 via upregulation of hepatic catabolism and transport. Weanling female Long-Evans rats received triclosan (0–1000 mg/kg/day) by gavage for 4 days. Whole blood and liver were collected 24 h later. Total serum T4, triiodothyronine (T3), and thyroid-stimulating hormone (TSH) were measured by radioimmunoassay. Hepatic microsomal assays measured ethoxyresorufin-O-deethylase, pentoxyresorufin-O-deethylase (PROD), and uridine diphosphate glucuronyltransferase enzyme activities. The messenger RNA (mRNA) expression of cytochrome P450s 1a1, 2b1/2, and 3a1/23; UGTs 1a1, 1a6, and 2b5; sulfotransferases 1c1 and 1b1; and hepatic transporters Oatp1a1, Oatp1a4, Mrp2, and Mdr1b was measured by quantitative reverse transcriptase PCR. Total T4 decreased dose responsively, down to 43% of control at 1000 mg/kg/day. Total T3 was decreased to 89 and 75% of control at 300 and 1000 mg/kg/day. TSH did not change. Triclosan dose dependently increased PROD activity up to 900% of control at 1000 mg/kg/day. T4 glucuronidation increased nearly twofold at 1000 mg/kg/day. Cyp2b1/2 and Cyp3a1/23 mRNA expression levels were induced twofold and fourfold at 300 mg/kg/day. Ugt1a1 and Sult1c1 mRNA expression levels increased 2.2-fold and 2.6-fold at 300 mg/kg/day. Transporter mRNA expression levels were unchanged. These data denote important key events in the mode of action for triclosan-induced hypothyroxinemia in rats and suggest that this effect may be partially due to upregulation of hepatic catabolism but not due to mRNA expression changes in the tested hepatic transporters.
Keywords: mode of action, triclosan, thyroid disruption, glucuronyltransferase, sulfotransferase, hepatic transport
Triclosan is a chlorinated phenolic bacteriocide used as an active ingredient in personal care products, including soaps, toothpastes, toys, and clothing (Bhargava & Leonard, 1996; Dayan, 2007; McClanahan & Bartizek, 2002). Due to broad use, environmental fate, and transport, triclosan is an environmental contaminant (Kolpin et al., 2002; Paxeus, 1996). Triclosan contamination of effluents is one of several potential sources for human exposure, along with personal care product exposure (Allmyr et al., 2006; Sandborgh-Englund et al., 2006).
Triclosan is readily absorbed from the gastrointestinal tract and oral mucosa (Sandborgh-Englund et al., 2006). Triclosan has been detected in human breast milk, at levels ranging from 0 to 2100 μg/kg lipid (Adolfsson-Erici et al., 2002; Allmyr et al., 2006; Dayan, 2007), in serum (Allmyr et al., 2006; Hovander et al., 2002) and as triclosan metabolites in urine (Calafat et al., 2008; Wolff et al., 2007). These data demonstrate exposure in humans and underscore the importance of using models to assess any potential effects resulting from human triclosan exposure.
Laboratory studies have documented that triclosan disrupts thyroid systems in rats and frogs (Crofton et al., 2007; Veldhoen et al., 2006; Zorrilla et al., 2009). In vitro evidence also suggests that triclosan may be an antagonist (Ahn et al., 2008; Gee et al., 2008) or weak agonist (Houtman et al., 2004) of the estrogen receptor and/or a weak antagonist of the androgen receptor (Chen et al., 2007).
Adverse effects of triclosan on thyroid hormone (TH) homeostasis have been reported in rats and frogs. Short-term oral triclosan exposure resulted in hypothyroxinemia in weanling rats (Crofton et al., 2007). Stoker and colleagues reported that triclosan decreased T4 without significantly affecting thyroid-stimulating hormone (TSH) following a 31-day oral triclosan exposure (Zorrilla et al., 2009). Veldhoen et al. (2006) reported increased thyroid receptor β messenger RNA (mRNA) expression in Xenopus laevis XTC-2 cells when coexposed to T3 and accelerated hind limb development in vivo in Rana catesbeiana. The mode of action for thyroid disruption by triclosan is currently undefined.
Thyroid disruption may occur via several mechanisms, including disruption of TH synthesis via inhibition of thyroperoxidase or iodide uptake, binding to TH transport proteins, xenobiotic interactions with the TH receptor or TSH receptor, upregulation of iodothyronine deiodinases, and increases in TH clearance (Boas et al., 2006; Crofton, 2008, Capen, 1994). Evidence suggests that triclosan may upregulate hepatic catabolism of THs, a known key event in a mode of action leading to decreased THs (Crofton, 2008; Crofton & Zoeller, 2005; Hill et al., 1998; McClain et al., 1989). The initiating event in this mode of action is the activation of hepatic nuclear receptors (Barter & Klaassen, 1994; Crofton & Zoeller, 2005; Hill et al., 1998; Hood & Klaassen, 2000; McClain, 1989). Nuclear receptors (pregnane X receptor [PXR] and constitutive androstane receptor [CAR]) regulate hepatic catabolic and transport activity (Kretschmer & Baldwin, 2005), suggesting that potential agonism or antagonism of CAR/PXR results in downstream metabolic changes that affect serum TH levels. In PXR reporter assays, triclosan moderately activated human PXR relative to the prototypical inducer, rifampicin (Jacobs et al., 2005). Furthermore, triclosan increased Cyp2b1/2 and Cyp3a1 protein and enzymatic activity markers of cytochrome P450 (CYP) activity including pentoxyresorufin-O-deethylase (PROD), benzyloxyresorufin-O-debentylase, and ethoxyresorufin-O-deethylase (EROD) in hepatocytes in vitro and in hepatic microsomes ex vivo (Hanioka et al., 1996; Jinno et al., 1997; Zorrilla et al., 2009). Triclosan inhibited diiodothyronine (T2) sulfotransferases in rat and human hepatocytes in vitro, suggesting interference with TH sulfation (Wang & James, 2006; Wang et al., 2004). Available evidence suggests activation of hepatic nuclear receptors by triclosan, with subsequent upregulation of hepatic metabolism, which contributes to the maintenance of thyroid homeostasis (Capen, 1994; DeVito et al. 1999; Hill et al., 1998).
The current work tested the hypothesis that triclosan decreased serum T4 in vivo by upregulation of hepatic catabolism and altered expression of cellular transport proteins. A 4-day exposure weanling rat model was employed as this protocol has been used to characterize thyroid-disrupting chemicals (Craft et al., 2002; Crofton, 2004; Zhou et al., 2001) and demonstrates triclosan-induced hypothyroxinemia (Crofton et al., 2007) and hepatic enzyme induction (Hanioka et al., 1996). Serum total T4, T3, and TSH were measured. Cytochrome P450 markers of phase I metabolism were analyzed enzymatically and as mRNA expression levels by quantitative reverse transcriptase (qRT)-PCR. Uridine diphosphate glucuronyltransferase (UGT) activity and the expression of UGT and sulfotransferase (SULT) isoforms were also measured as indicators of phase II catabolic pathways. Finally, mRNA expression levels of several hepatic transporters were measured to determine the contribution of hepatic transport to the hypothesized mode of action for triclosan disruption of T4.
METHODS
Animals.
Long-Evans female rats (n = 120) at 21–23 days of age were obtained from Charles River Laboratories, Inc. (Raleigh, NC) and were allowed 2–4 days of acclimation in an American Association for Accreditation of Laboratory Animal Care–approved animal facility prior to treatment. Animals were housed two per plastic hanging cage (45 × 24 × 20 cm) with heat-sterilized pine shavings bedding (Northeastern Products Corp., Warrenton, NC). Colony rooms were maintained at 21 ± 2°C with 50 ± 10% humidity on a photoperiod of 12L:12D (0600 h–1800 h). Food (Purina Rodent Chow #5001) and water were provided ad libitum. Tap water (Durham, NC water) was filtered through sand, then through activated charcoal, and finally rechlorinated to 4–5 ppm Cl− before use in the animal facility. All animal procedures were approved in advance by the Institutional Animal Care and Use Committee of the National Health and Environmental Effects Research Laboratory of the U.S. Environmental Protection Agency (U.S. EPA).
The current work included hepatic tissue and serum samples from a previous publication (Crofton et al., 2007) that reported only serum T4, body weight, and liver weight values. The two experimental blocks from the previous study (Crofton et al., 2007) were combined with the additional block performed in the current study for T4 and hepatic enzyme assays; this yielded total sample sizes of 24, 8, 24, 24, 24, and 16 for the vehicle control 10, 30, 100, 300, and 1000 mg/kg/day, respectively. Only samples for the second block (n = 8/treatment group) were used for mRNA analyses; therefore, no tissue from the 1000 mg/kg/day group was used. Only samples for the third block were used for T3 and TSH analyses (n = 8/treatment group), so no tissue from the 10 mg/kg/day group was used.
Chemicals and treatment.
Triclosan (5-chloro-2-(2,4-dichlorophenoxy)phenol, CAS 3380-34-5, lot 06415CD) was obtained from Aldrich Chemical Company (St Louis, MO; Cat 524190-10G). Mass spectrometry, employed to analyze the triclosan sample, revealed 98.2% triclosan, 0.05% iso-triclosan, 0.12% 2,8-dichlorodibenzodioxin, and 0.1% 2,4,8-trichlorodibenzodioxin. The dosing solutions (0, 10, 30, 100, 300, and 1000 mg/kg/day) were prepared in corn oil (Sigma; lot 117K0127) and sonicated for 30 min at room temperature. The 1000 mg/kg/day dose precipitated within 24 h and was therefore sonicated daily before use. Dosing volume was 1.0 ml corn oil per kilogram body weight. Rats (27–29 days of age) were exposed via gavage for four consecutive days. Rats were randomly assigned to treatment groups to balance body weights at the start of dosing. Body weights were recorded, and dosing volumes were adjusted daily by weight. Approximately 24 h after the final treatment, rats were moved into a holding room, weighed, and acclimated for a minimum of 30 min. Trunk blood and liver were collected between 0900 h and 1100 h in an adjacent room with a separate air supply. Blood was collected into serum separator tubes (Becton Dickinson; 36-6154). Serum was obtained after clotting whole blood for 30 min on ice, followed by centrifugation at 1278× g at 4°C for 30 min. Livers were weighed and then quick frozen in liquid nitrogen. Serum and liver samples were stored at −80°C until analysis.
TH assays.
Serum total T4 and serum total T3 were measured in duplicate by standard solid-phase Coat-A-Count radioimmunoassay (RIA) kits (Siemens Medical Solutions Diagnostics, Los Angeles, CA). Serum TSH concentrations were analyzed in duplicates with a double antibody RIA method (Greenwood et al., 1963) with some modification (Zorrilla et al., 2009). The TSH RIAs were performed using materials supplied by the National Hormone and Pituitary Agency: iodination preparation (I-9-TSH), reference preparation (RP-3), and antisera (S-6-TSH). Iodination material was radiolabeled with 125I (Perkin Elmer, Shelton, CT). Assay variation was assessed using the multivalent control module (Siemens Medical Solutions Diagnostics; lot 021) to measure low, medium, and high total T4, T3, and TSH values before and after measuring the experimental samples. Intra- and interassay coefficients of variance for all assays were below 13%. Total serum T4 and TSH were calculated as nanogram T4 per milliliter serum, and total serum T3 was calculated as nanogram T3 per deciliter serum.
Microsome preparation and EROD and PROD assays.
Liver microsomal fractions, prepared as described previously (DeVito et al., 1993), were standardized using total protein (Bio-Rad, Richmond, CA). Hepatic microsomal EROD and PROD activities were assayed using a fluorometric microplate reader (Spectramax Gemini XPS; Molecular Devices/MDS Analytical Technologies, Toronto, Canada). Each well in polystyrene 96-well plates (Nunc Thermo Fisher Scientific, Rochester, NY) contained a total of 235 μl, including 50 μl of substrate (1.5nM ethoxyresorufin or pentoxyresorufin), 50 μl of diluted microsomes, and 110 μl of 0.05mM Tris buffer (pH 8.0). Microsomes were diluted 1:10 for samples and 1:100 for the positive control in order to maintain data points within the linear region of the standard curve. An aliquot (25 μl) of NADPH was added to initiate the reaction. The fluorescence signal was measured every 33 s for 5 min at 37°C after reaction initiation. The rate of resorufin formation was estimated by calculating Vmax/min using a resorufin standard curve to extrapolate resorufin concentrations in the reaction. A similar method was used to measure hepatic microsomal PROD activity using pentoxyresorufin as a substrate. Both EROD and PROD values were calculated as picomoles resorufin per milligram protein per minute. A positive control, composed of pooled microsomes from rats acutely exposed to 10 μg/kg 2,3,7,8-tetrachlorodibenzo-p-dioxin or 300 mg/kg Aroclor, was used to facilitate interassay comparison.
UGT activity assay.
UGT activity for T4 was measured by the method of Beetstra et al. (1991) as modified by Zhou et al. (2001). Detergent such as Brij 56 was not included due to the potential for increased basal T4 glucuronidation (Craft et al., 2002). A positive control microsome pool, composed of microsomes from rats that received a single 10-μg/kg 2,3,7,8-tetrachlorodibenzo-p-dioxin dose or a single 300 mg/kg Aroclor 1254 dose, was used during each trial to enable interassay comparison.
mRNA preparation and analysis.
Approximately 0.2 g of frozen tissue was homogenized in 2 ml of TRI Reagent (Molecular Research Center, Cincinnati, OH; Cat. TR 118). Total RNA was extracted as per the protocol provided by the Molecular Research Center (Chomczynski & Sacchi, 1987). RNA extraction was processed in duplicate. Protein, nucleic acid content, and approximate RNA concentrations were estimated with a DU800 Beckman Coulter Spectrophotometer via measurement of absorbance at 260 and 280 nm for each sample. Analysis of RNA integrity was performed using an Agilent RNA 6000 Nano Kit and Bioanalyzer according to the instructions provided (Part Number: G2938-90033). Samples used in qRT-PCR experiments were selected from duplicates based on optimizing the 260/280 nm ratio to 2.0 (range 2.00–2.14). The average 28s/18s ratio for samples used was 2.2 (range 1.9–3), and the average assigned RNA integrity number (RIN) was 9.4 of 10 (range 8.2–10).
Gene expression assays were performed using Taqman One-step RT-PCR Master Mix Reagent Kits (Applied Biosystems, Foster City, CA; Cat. 4309169), which include AmpliTaq Gold DNA Polymerase, dNTPs including dUTP, passive reference, and optimized buffer components for both the reverse transcriptase (RT) and the DNA polymerase reactions. Also included is the RT enzyme mix, containing the MultiScribe Reverse Transcriptase and RNase inhibitor. Taqman Gene Expression Assays (Applied Biosystems) were used to test the mRNA expression of specific genes involved in hepatic catabolism and transport (Table 1). Each 20-μl reaction contained 900nM of the gene-specific primer and 125 ng of RNA sample, except for Oatp1a4 and Mdr1b, which contained 400 ng of RNA per reaction. The 96-well plates were maintained at 4°C during pipetting using a thermocycler block. Samples were analyzed in triplicate using the experimental probe and in triplicate using the endogenous control gene on each plate. Samples positions were distributed across the plate based on a semi-random design, where each plate contained the same number of samples from a dose group, but the samples were randomly selected and assigned to well positions within the plate. Following sample loading, plates were centrifuged at 295 xg at 24°C for 3 min before being placed in a Stratagene MxPro3005P QPCR Detection System (Stratagene, Agilent Technologies, Cedar Creek, TX). The thermal profile was as follows: RT reaction at 48°C for 45 min, an initial 10-min denaturation period at 95°C, followed by 60 PCR cycles of 15-s denaturation at 94°C, and 1-min annealing and extension at 60°C.
TABLE 1.
Summary of Taqman Gene Expression Assays and Amplification Efficiencies
| Testing category | Gene | Gene abbreviation | Slope | R-Squared | Efficiency (%) | Taqman Gene Expression Assay ID |
| Endogenous reference | Ribosomal protein S18 | Rps18 | −3.2493 | 0.9494 | 103.1 | Rn01428915_g1 |
| Phase I markers | Cytochrome P450, family 1, subfamily a, polypeptide 1 | Cyp1a1 | −3.6424 | 0.8690 | 88.2 | Rn00487218_m1 |
| Cytochrome P450, family 2, subfamily b, polypeptide 2 | Cyp2b1/2 | −3.1757 | 0.9680 | 106.4 | Rn02783833_m1 | |
| Cytochrome P450, subfamily 3A, polypeptide 1 | Cyp3a1/23 | −3.4391 | 0.9790 | 95.3 | Rn01640761_gH | |
| Phase II markers | UDP-glycosyltransferase 1 family, polypeptide A1 | Ugt1a1 | −3.3699 | 0.9529 | 98.0 | Rn00754947_m1 |
| UDP-glycosyltransferase 1 family, polypeptide A6 | Ugt1a6 | −3.4287 | 0.9535 | 95.7 | Rn00756113_mH | |
| UDP-glucuronosyltransferase 2 family, member 5 | Ugt2b5 | −3.2953 | 0.8786 | 101.1 | Rn01777314_s1 | |
| Sulfotransferase family 1B, member 1 | Sult1b1 | −3.2091 | 0.9143 | 104.9 | Rn00673872_m1 | |
| Sulfotransferase family, cytosolic, 1C, member 1 | Sult1c1 | −3.2282 | 0.9747 | 104.1 | Rn00581955_m1 | |
| Phase III markers | Solute carrier organic anion transporter family, member 1a1 | Oatp1a1 or Oatp1 | −3.3182 | 1.0016 | 100.2 | Rn00755148_m1 |
| Solute carrier organic anion transporter family, member 1a4 | Oatp1a4 or Oatp2 | −3.0310 | 1.1376 | 113.8 | Rn00756233_m1 | |
| ATP-binding cassette, subfamily C (CFTR/multidrug resistance-associated protein), member 2 | Mrp2 | −3.3033 | 1.0078 | 100.8 | Rn00563231_m1 | |
| ATP-binding cassette, subfamily B (multidrug resistance transporter/TAP), member 1B | Mdr1b | −3.6001 | 0.8957 | 89.6 | Rn00561753_m1 |
Note. The endogenous reference gene Rps18 was used to standardize all the gene expression assays. The slope presented is the slope value obtained from a plot of the threshold CT (dRn) versus log[RNA concentration], and R-squared value is the square of the correlation coefficient of the line obtained by the plot (Applied Biosystems Publication 127AP05-03).
The amplification efficiencies for all the genes used in qRT-PCR experiments were confirmed using pooled untreated control RNA extracted from female rat liver. Amplification efficiency was calculated according to the equation, efficiency = (10(−1/m) − 1) × 100, where m = the slope of the plot of threshold CT (dRn) versus log[RNA concentration] (Table 1) (Applied Biosystems Publication 127AP05-03).
qRT-PCR data sets were analyzed using a relative quantification method (2−ΔΔCT) to describe the change in expression of the target experimental gene relative to an endogenous reference gene (Livak & Schmittgen, 2001). Choice of an endogenous reference gene was based on constant gene expression across all the dosing groups and tissue-specific amplification efficiency (Livak & Schmittgen, 2001). The endogenous reference gene, ribosomal protein S18 (Rps18), was selected after determining the amplification efficiencies of multiple candidate genes (Pohjanvirta et al., 2006), including glyceraldehyde-3-phosphate dehydrogenase, β2 microglobulin, Rps18, and ribosomal protein13a. Choice of genes was contingent upon two criteria: involvement of the isoform in TH metabolism and transport in rats as well as regulation of the isoform by CAR and/or PXR.
Data analysis.
All three study blocks with a combined 120 were analyzed using a two-way ANOVA (SAS 9.1; SAS Institute, Cary, NC), with dose and block as independent variables and T4, EROD activity, PROD activity, and UGT activity as dependent variables. Significant treatment effects were followed by mean contrast testing using Duncan’s New Multiple Range Test (p < 0.05). T4, UGT, EROD, and PROD data were analyzed as mean percent of control in order to normalize the data across the three study blocks. qRT-PCR data (block 2 only) were analyzed using a two-way ANOVA, with dose and plate number as independent variables and 2−ΔΔCT as the dependent variable. T3 and TSH data (block 3 only) were analyzed using one-way ANOVA, with dose as the independent variable and hormone as the dependent variable (SAS 9.1; SAS Institute). Raw data for all endpoints measured are available in the Supplementary Table.
Benchmark dose (BMD) and lower-bound confidence limit (BMDL) estimates were determined using U.S. EPA Benchmark Dose Software (BMDS version 2.0.0.33) as previously described (Crofton et al., 2007; Zhou et al., 2001, 2002). BMD analyses were performed to further define dose-dependent effects that are not discernible using only information on the statistically significant effects found using ANOVA. Use of BMDs enables estimation of the dose at which a specified effect or benchmark response (BMR) may occur. The BMR was set at a 20% decrease for T4 and T3 data (Crofton et al., 2007; Zorrilla et al., 2009), 50% for increases in hepatic PROD activity, and 20% for changes in mRNA expression and UGT activity data (Schlecht et al., 2006). These BMRs were selected based on previous use in the literature, a need to balance the statistical and perceived biological significance of a change in the measured end point, and known mechanistic relationships (e.g., UGT and T4) (EPA, 2000). The BMDs were calculated from the model fits to the data. The BMDL (lower-bound confidence limit) was calculated as the 95% lower confidence interval.
RESULTS
No clinical signs of toxicity were observed in the rats following the 4 days of triclosan treatment. Effects on liver weight and liver-body weight ratio were consistent with a previously published 4-day triclosan exposure model (Crofton et al., 2007). There was a main effect of dose [F(5, 105) = 2.57, p < 0.0309] and study block [F(2, 105) = 6.24, p < 0.0027] on liver weight that resulted in a 12% increased liver weight in the 1000 mg/kg/day dose group. Increases in liver weight, and nonsignificant decreases in body weight gain of ∼10% in the high-dose group, were reflected in the main effect of dose [F(5, 105) = 18.62, p < 0.001] and study block [F(5, 105) = 3.50, p < 0.0338] on the liver-body weight ratio, which resulted in approximately a 13% increase in the liver-body weight ratio for the 1000 mg/kg/day dose group (Table 2).
TABLE 2.
Doses, Group Sizes, and Block-Controlled Body Weight Gain, Liver Weight, and Liver-Body Weight Ratio With SD Values
| Dose (mg/kg/day) | N per dose group | Mean BW gain, % control ± SD | Mean liver weight, % control ± SD | Mean liver-body weight ratio, % control ± SD |
| 0 | 24 | 100 ± 16 | 100 ± 9.3 | 100 ± 4.9 |
| 10 | 8 | 102 ± 12 | 104 ± 18 | 105 ± 4.1 |
| 30 | 24 | 108 ± 16 | 103 ± 11 | 102 ± 4.7 |
| 100 | 24 | 105 ± 14 | 101 ± 12 | 101 ± 4.7 |
| 300 | 24 | 105 ± 24 | 105 ± 13 | 104 ± 5.2 |
| 1000 | 16 | 92 ± 20 | 112 ± 12* | 113 ± 4.9* |
Note. Significant increases of nearly 12 and 13% occur in the 1000 mg/kg/day dose group for liver weight and liver-to-body-weight ratio, respectively. BW, body weight.
*Significantly different from vehicle control by ANOVA (p > 0.05).
Both total serum T4 and total serum T3 decreased in a dose-responsive manner, with decreases of 26, 35, and 57% relative to control at 100, 300, and 1000 mg/kg/day for T4 and decreases of 12 and 25% at 300 and 1000 mg/kg/day for T3, respectively (Fig. 1). TSH was unchanged. For T4, there was a main effect of dose [F(5, 105) = 37.46, p < 0.0001], but no effect of study block (p < 0.05) or dose-by-study block interaction (p < 0.05). Mean contrast tests revealed significant T4 decreases in the 100-, 300-, and 1000 mg/kg/day groups (p < 0.05). There was also a main effect of dose on T3 concentrations [F(4, 35) = 12.80, p < 0.0001]; mean contrast tests demonstrated significant decreases at 300 and 1000 mg/kg/day only (p < 0.05). The no-observed effect level was 30 mg/kg/day for T4 decreases and 100 mg/kg/day for T3 decreases. Using a BMR equal to a 20% decrease in THs, Hill model fits to the data predicted BMDs of 99.4 and 606 mg/kg/day, with 95% lower confidence limits of 65.6 and 335 mg/kg/day, for T4 and T3, respectively.
FIG. 1.
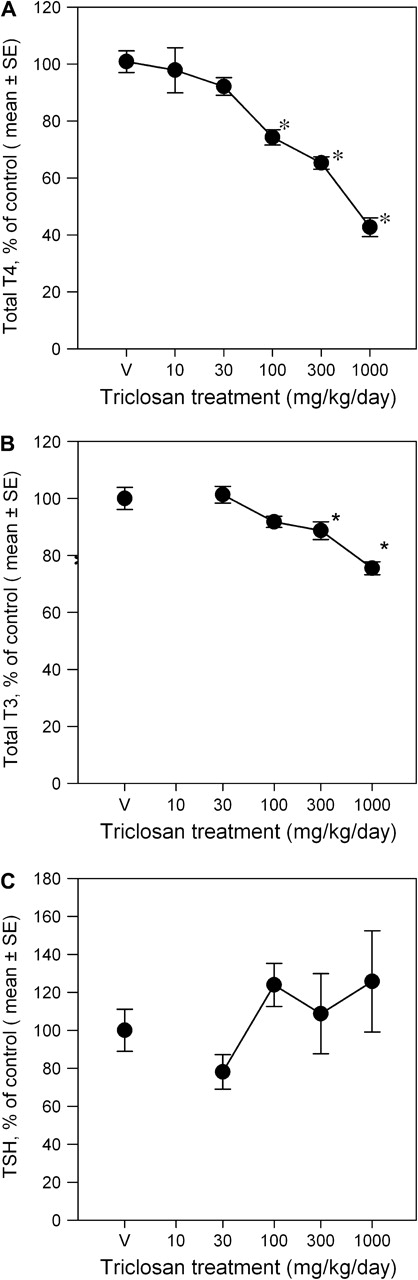
Triclosan treatment results in dose-dependent decreases in total serum T4 (A) and T3 (B), with no change in TSH (C), represented as group mean values (± SE) percent of vehicle control for each study cohort V = vehicle control, corn oil; for T4: n = 24 for V, 30, 100, and 300 mg/kg/day dose groups, n = 16 for 1000 dose group, and n = 8 for 10 dose group; for T3 and TSH: n = 8 for V, 30, 100, 300, and 1000 mg/kg/day dose groups; *significantly different from vehicle controls, p > 0.05.
EROD activity was depressed by triclosan exposure in a non–dose responsive manner (Fig. 2A), with a 25–32% decrease for all dose groups except 10 mg/kg/day group. There was a significant main effect of dose [F(5, 105) = 7.34, p < 0.0001] but no main effect of study block (p < 0.05) or dose-by-study block interaction (p > 0.05). PROD activity was significantly elevated in a dose-dependent manner (Fig. 2B). The 100-, 300-, and 1000 mg/kg/day groups were increased by 249, 814, and 937% of control, respectively. These conclusions are supported by main effects of dose [F(5, 104) = 29.95, p < 0.0001] and a dose-by-study block interaction [F(7, 104) = 4.86, p < 0.0001]. The interaction of study block and dose was due to a higher baseline activity in block 3 and a slightly greater induction compared with study blocks 1 and 2. Note that there was significant induction of PROD in all three study blocks. Mean contrast tests revealed significant effects in the 300 and 1000 mg/kg/day groups (p < 0.05). Using a BMR equivalent to a 50% increase in PROD activity, a Hill model fit to the data predicted a BMD of 70.8 mg/kg/day, with a 95% lower confidence limit of 48.6 mg/kg/day. The increased EROD (22-fold) and PROD (3.5-fold) activities in the positive control were consistent with laboratory historical control data.
FIG. 2.

Dose-effect curves for the effects of a 4-day exposure to triclosan on liver microsomal EROD activity (A) and PROD activity (B). Data are presented as group mean (± SE) percent of vehicle control for each respective study block. Activity = picomoles resorufin/mg protein/min; V = vehicle control, corn oil; PC = positive control, single 10 μg/kg 2,3,7,8-tetrachlorodibenzo-p-dioxin dose and single 300 mg/kg Aroclor dose; n = 24 for V, 30, 100, and 300 mg/kg/day dose groups, n = 16 for 1000 dose group, and n = 8 for 10 dose group; *significantly different from vehicle control, p > 0.05.
Expression levels of hepatic microsomal CYP mRNA were differentially altered by triclosan exposure (Fig. 3). There was no significant effect of triclosan on relative mRNA expression of Cyp1a1. Cyp2b1/2 and Cyp3a1/23 increased in a dose-dependent manner. There were main effects of dose for both Cyp2b1/2 [F(4, 35) = 3.30, p < 0.0214] and Cyp3a1/23 [F(4, 35) = 9.52, p < 0.0001]. Mean contrast tests revealed significant increases of Cyp2b1/2 mRNA of twofold at 300 mg/kg/day only. Cyp3a1/23 was significantly increased 2.5-fold and 4.1-fold in the 100 and 300 mg/kg/day groups, respectively. Using a BMR equivalent to 20% increase in mRNA expression, the BMD and BMDL for Cyp2b2 were 45.3 and 24.0 mg/kg/day and for Cyp3a1/23 were 62.3 and 7.3 mg/kg/day, respectively. The Cyp2b1/2 expression data were best fit with a linear model, whereas the Hill model provided the best fit for the Cyp3a1/23 expression data.
FIG. 3.
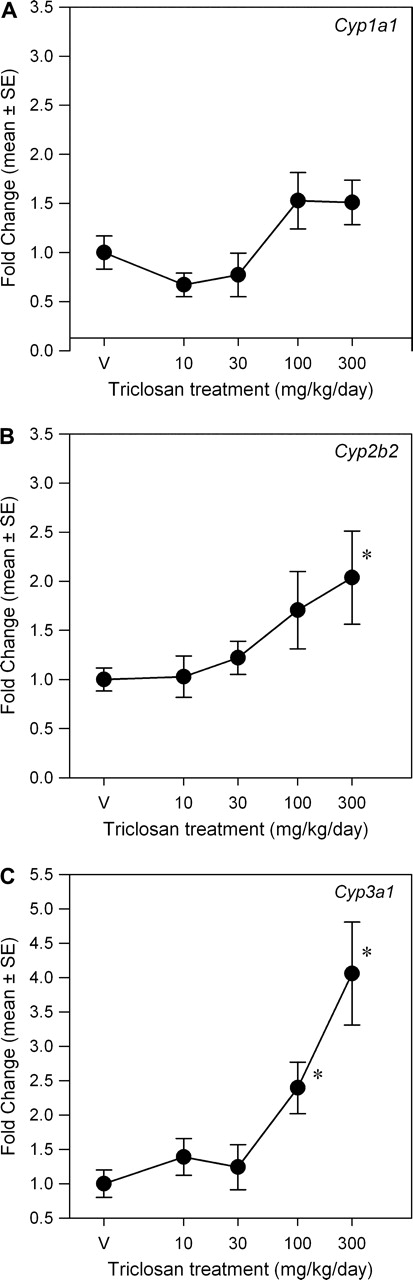
Dose-response curves for the effects of a 4-day exposure to triclosan on liver mRNA expression of CYP isoforms. Data are plotted as the mean (± SE) fold change (2−ΔΔCT) from control for the genes assayed: Cyp1a1 (A), Cyp2b2 (B), and Cyp3a1/23 (C). V = vehicle control, corn oil; n = 8 per dose group; *significantly different from vehicle control, p > 0.05.
T4 glucuronidation activity increased with triclosan treatment (Fig. 4). There were main effects of dose [F(5, 104) = 2.38, p < 0.0435] and block [F(2, 104) = 5.20, p < 0.0070] but no dose-by-study block interaction (p < 0.05). Mean contrast testing revealed a significant 82% increase at 1000 mg/kg/day. BMDS did not fit the data using linear, Hill, polynomial, or exponential models.
FIG. 4.

Dose-effect curve for the effects of a 4-day exposure to triclosan on liver microsomal UGT activity. Data are presented as group mean (± SE) percent of vehicle control for each respective study block. UGT activity = picomoles T4-G/mg protein/min; V = vehicle control, corn oil; PC = positive control, single 10 μg/kg 2,3,7,8-tetrachlorodibenzo-p-dioxin dose and single 300 mg/kg Aroclor dose; n = 24 for V, 30, 100, and 300 mg/kg/day dose groups, n = 16 for 1000 dose group, and n = 8 for 10 dose group; *significantly different from vehicle control, p > 0.05.
Triclosan exposure induced isoform-specific increases in UGT and SULT mRNA expression (Figs. 5 and 6). There was a main effect of dose on Ugt1a1 mRNA expression [F(4, 35) = 5.98, p < 0.0009] but no significant effects on Ugt1a6 and Ugt2b5. Mean contrast tests revealed significant 1.7-fold and 2.3-fold increases at 100 and 300 mg/kg/day, respectively. Using a BMR equivalent to a 20% increase in mRNA expression, the BMD and BMDL were 22.7 and 6.4 mg/kg/day, respectively. Triclosan increased Sult1c1 mRNA expression [F(4, 35) = 6.34, p < 0.0006] ∼2.5-fold in the 100 and 300 mg/kg/day groups (Fig. 6). The significant main effect of triclosan on Sult1b1 mRNA expression [F(4, 34) = 4.63, p < 0.0043] was caused by small but significant decreases at 30 and 100 mg/kg/day (p < 0.05). Linear, Hill, polynomial, and exponential models failed to significantly fit the mRNA expression data for Sult1b1 and Sult1c1. Triclosan treatment did not significantly alter mRNA expression of any of the measured hepatic transporters: Oatp1a1 (Oatp1), Oatp1a4 (Oatp2), Mrp2, or Mdr1b (Fig. 7).
FIG. 5.
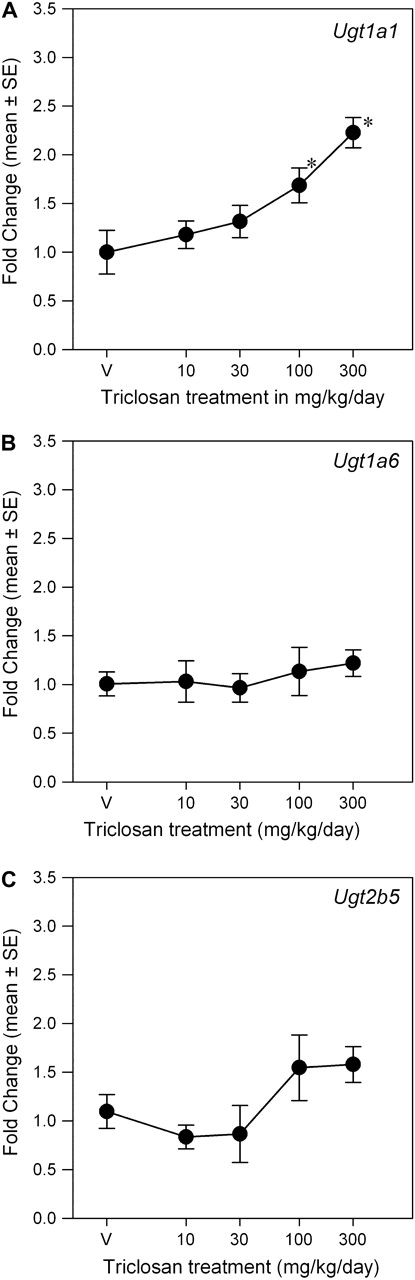
Dose-response curves for the effects of a 4-day exposure to triclosan on liver mRNA expression of UGT isoforms. Data are plotted as the mean (± SE) fold change (2−ΔΔCT) from control for the genes assayed: Ugt1a1 (A), Ugt1a6 (B), and Ugt2b5 (C). V = vehicle control, corn oil; n = 8 per dose group; *significantly different from vehicle control, p > 0.05.
FIG. 6.

Dose-response curves for the effects of a 4-day exposure to triclosan on liver mRNA expression of SULT isoforms. Data are plotted as the mean (± SE) fold change (2−ΔΔCT) from control for the genes assayed: Sult1b1 (A) and Sult1c1 (B). V = vehicle control, corn oil; n = 8 per dose group, with the exception of n = 7 for V dose group of Sult1b1; *significantly different from vehicle control, p > 0.05.
FIG. 7.

Dose-response curves for the effects of a 4-day exposure to triclosan on liver mRNA expression of transporters. Data are plotted as the mean (± SE) fold change (2−ΔΔCT) from control for the genes assayed: Oatp1a1 (A), Oatp1a4 (B), Mdr1b (C), and Mrp2 (D). V = vehicle control, corn oil; n = 8 per dose group.
DISCUSSION
The current work tested the hypothesis that triclosan decreased serum T4 via upregulation of hepatic catabolism and altered expression of cellular transport proteins. Consistent with this hypothesis, we report here that triclosan upregulates both mRNA expression and activity of some phase I and phase II hepatic enzymes. Contradictory to this hypothesis was the lack of effects on any measured hepatic cellular transporters. Furthermore, the pattern of effects on hepatic mRNA for CYP and UGT isoforms suggests that the initiating event in the mode of action for triclosan-induced hypothyroxinemia is activation of hepatic CAR and PXR receptors.
Consistent with previous reports, oral exposure to triclosan produced hypothyroxinemia. Dose-responsive T4 decreases have been observed following both 4-day exposures (Crofton et al., 2007) and 31-day exposures (Zorrilla et al., 2009). Effective doses that reduced T4 by 20% in the 4-day exposures used in this work (BMD = 99.4 mg/kg/day) were higher compared with the smaller 4-day assay data set published previously by this laboratory (BMD = 69.7 mg/kg/day) (Crofton et al., 2007). The effective dose that reduced T4 by 20% following a 31-day triclosan exposure (BMD = 14.5 mg/kg/day) was much lower (Zorrilla et al., 2009) than those in the current study, likely due to the differences in exposure duration as well as the sex, age, and strain of rats used. Strain may be a particularly important uncertainty in directly comparing studies of thyroid disruption as background levels of THs and metabolic responses may differ between strains (Lecureux et al., 2009).
T3 and TSH were also assessed to more fully characterize the impact of triclosan on circulating thyroid and pituitary hormones. The decreases (12–25%) in T3 observed at 300 and 1000 mg/kg/day were consistent with the previous reports that T3 was decreased ∼20% after 31 days of 200 mg/kg/day triclosan treatment (Zorrilla et al., 2009). No change in TSH with triclosan treatment is also consistent with a previous report (Zorrilla et al., 2009). Other chemicals including polychlorinated biphenyls and 3-methylcholanthrene have significantly decreased T4 with no effects on TSH (Hood et al., 1999; Liu et al., 1995); this phenomenon of decreased T4 without compensatory TSH increase, while not well understood, has been hypothesized to result from a lack of induction of T3 glucuronidation (Barter & Klaassen, 1994; Hood & Klaassen, 2000).
Triclosan exposure increased enzymatic and mRNA markers of activity and expression of Cyp2b1/2 and Cyp3a1/23, suggesting that triclosan may activate nuclear receptors CAR and/or PXR. Increased PROD activity implies increased Cyp2b1/2 protein. This is consistent with previous in vitro and in vivo observations of triclosan-induced PROD activity and Cyp2b1/2 protein (Hanioka et al., 1996, 1997; Jinno et al., 1997; Zorrilla et al., 2009). Zorrilla et al. (2009) also found PROD activity increases in vivo following 31-day exposures (BMD = 14.31 mg/kg/day) (Burke et al., 1994), compared with 70.8 mg/kg/day, obtained in the present study. Relative mRNA expression of Cyp2b1/2 and Cyp3a1/23 increased significantly. This suggests that triclosan may be capable of interacting with both CAR and PXR, consistent with activation of PXR in vitro in a human (HuH7 culture) receptor reporter assay (Jacobs et al., 2005). Currently, there are no published reports of triclosan activity toward CAR. However, our observations of increased Cyp2b1/2 activity and expression indicate potential CAR activation (Qatanani et al., 2005; Sueyoshi et al., 1999).
EROD activity decreased slightly, and was not dose responsive, corresponding well to the lack of significant changes to Cyp1a1 mRNA expression; collectively, these data imply that aryl hydrocarbon receptor (AhR) activation is not a key step in this mode of action. No constitutive expression of Cyp1a1 protein in rat liver and no induction of Cyp1a1 mRNA with triclosan treatment suggest that these EROD decreases do not reflect Cyp1a1 activity inhibition but rather the inhibition of one or more of several CYPs, including Cyp2c11 (Burke et al., 1994). Previous work with rat liver microsomes demonstrated that triclosan competitively inhibited EROD induction by 3-methylcholanthrene, a prototypical microsomal enzyme inducer of EROD and Cyp1a1 activities (Hanioka et al., 1996). However, the failure of triclosan to induce EROD is inconsistent with a report of triclosan agonism of AhR; triclosan activated AhR to 40% of the level of activation of TCDD and inhibited TCDD activation by 30%, suggesting a competitive interaction (Ahn et al., 2008).
Importantly, the lack of Cyp1a1 induction demonstrates that the minor dioxin contaminates found in the triclosan sample used in this study, 2,8,-dichlorodibenzodioxin and 2,4,8-trichlorodibenzodioxin, did not induce AhR-mediated effects on phase I and phase II hepatic enzymes. 2,8-dichlorodibenzodioxin is a very weak AhR agonist in vitro and failed to induce EROD in vivo (Mason & Safe, 1986).
Phase II glucuronidation and sulfation are upregulated by triclosan treatment, suggesting that triclosan treatment increases hepatic T4 conjugation. Observations of a twofold increase in glucuronidation activity of T4 and a 2.2-fold increase in Ugt1a1 mRNA expression suggest small increases in T4-UGT activity result from triclosan exposure. Increases in glucuronidation result in increased biliary excretion of conjugated hormone (Barter & Klaassen, 1994; Liu et al., 1995; Vansell & Klaassen, 2001, 2002). Previous work in this laboratory and others has found that UGT activity may not have a clear linear relationship with T4 concentrations (Craft et al., 2002; Hood & Klaassen, 2000). Another major uncertainty regarding the testing of UGT isoforms for mRNA expression levels is the choice of isoforms to test. This work tested isoforms responsible for hepatic conjugation of T4 in rat, Ugt1a1 and Ugt1a6 (Vansell & Klaassen, 2002), as well as a marker of T3 glucuronidation, Ugt2b5 (Richardson et al., 2008; Vansell & Klaassen, 2002). Whereas mRNA expression of Ugt1a1 and Ugt1a6 can be found in the liver, Ugt1a7, which also conjugates T4, appears to be constitutively expressed mainly in the intestine of rats (Shelby et al., 2003) and inducible in liver by AhR agonists (Metz et al., 2000). Thus, Ugt1a7 was excluded from analysis as an amplification efficiency in the appropriate range could not be determined for analysis by qRT-PCR. No changes in expression were observed for Ugt1a6 or Ugt2b5. In comparing the T4-UGT activity and mRNA expression data, it appears likely that the approximately twofold increase in T4-UGT activity may be attributed to increases observed in Ugt1a1 mRNA expression.
While increased activity and expression of UGT isoforms support the overall hypothesis that triclosan treatment induces glucuronidation of TH, these data do not confirm a particular nuclear receptor pathway as CAR, PXR, and the glucocorticoid receptor (GR) all transcriptionally regulate isoform Ugt1a1 (Sugatani et al., 2005). Ugt1a6 is more exclusively controlled by the AhR (Auyeung et al., 2003); the lack of expression change for Ugt1a6 complements the unchanged expression of Cyp1a1 and EROD activity. This is consistent with the lack of AhR activation by triclosan and the lack of an AhR contribution to the end points measured in the current work.
Triclosan exposure increased sulfotransferase Sult1c1 mRNA expression 2.6-fold, indicating that increased sulfation and biliary excretion of T4 may occur. Sulfation deactivates T4 and increases its biliary excretion via enhancement of inner ring deiodination and blockage of outer ring deiodination for reactivation (Kester et al., 2003). Triclosan noncompetitively inhibits the in vitro human hepatic microsomal sulfation of 3-hydroxybenzo(a)pyrene (3-OH-BaP), bisphenol A (BPA), p-nitrophenol, and acetaminophen with IC50 concentrations in the low micromolar concentration range; competitive inhibition of the glucuronidation of 3-OH-BaP, BPA, and acetaminophen was also observed (Wang et al., 2004). Thus, triclosan may exert an inhibitory action on SULT and UGT catabolic enzymes, affecting the overall activity profile of UGTs and SULTs in vivo. An uncertainty in our analysis is choice of sulfotransferases to test; sulfation of THs is catalyzed primarily by Sult1b1 and Sult1c1 in the rat, although the preferred substrate for these enzymes is actually not the physiologically relevant TH (T3) but rather a T3 metabolite (T2) (Kester et al., 2003). Any future use of these data in extrapolation to potential human effects is complicated by the sex dependence of Sult1c1 expression in rats (Wong et al., 2005), which signals a potentially sexually dimorphic response to triclosan with respect to sulfotransferase expression changes. Male-dominant expression of Sult1c1 reflects sex-dependent T3 sulfation in rats, which is not known to occur in humans (Kaptein et al., 1997). Our observations report mRNA expression changes in female rats; however, the major change noted in sulfotransferases activity for triclosan treatment groups was upregulation of Sult1c1, which is expressed predominantly in male rat liver, kidney, and intestine; expression of Sult1b1 is equivalent between rat sexes (Kester et al., 2003; Dunn and Klaassen, 1998).
No statistically significant changes were observed in the mRNA expression of hepatic transporters, including Oatp1a1, Oatp1a4, Mrp2, and Mdr1. These particular transporters were chosen for analysis based on their functional activity and affinity for iodothyronines (Wong et al., 2005) as well as several previous literature reports of microsomal enzyme inducer effects on these transporters (Cheng et al., 2005; Johnson & Klaassen, 2002b; Klaassen & Slitt, 2005; Kretschmer & Baldwin, 2005; Wong et al., 2005). These mRNA expression results suggest that transporter expression changes do not contribute to the observed T4 decreases. However, these results do not exclude the possibility that hepatic transporter protein activity is altered by triclosan treatment via receptor-mediated posttranslational modifications (Cherrington et al., 2002). The mRNA expression of Mrp2 may not be indicative of the in vivo protein expression as PXR ligands that induce Cyp3a have been shown to increase Mrp2 protein without increasing Mrp2 expression (Johnson & Klaassen, 2002a). Other PXR ligands, including DMP-904 (Wong et al., 2005), PCN, and spironolactone (Cheng et al., 2005), and CAR ligands, including phenobarbital (Cherrington et al., 2002), have previously demonstrated effects on the regulation of hepatic transporter mRNA expression. Further characterization of the hepatic transporter activity of the liver in response to triclosan treatment will be necessary to conclude definitively that transporters are or are not involved in triclosan-induced hypothyroxinemia.
This work suggests that triclosan upregulates phase II glucuronidation and sulfation and that this increased catabolism may be at least partially responsible for the triclosan-induced hypothyroxinemia observed. This is consistent with other microsomal enzyme inducers including phenobarbital, polychlorinated biphenyls, pregnenolone-16α-carbonitrile, dioxins, and others (Liu et al., 1995; Schuur et al., 1998). Correlation plots (data not shown) of T4 concentration versus UGT activity and Ugt1a1 and Sult1c1 expression revealed significant linear model fit (p < 0.05), but poor R-squared values (R2 = 0.07–0.18), suggesting that other mechanisms contribute to the T4 decreases observed. Triclosan may exert a direct effect on the thyroid and TH synthesis; however, preliminary data in ex vivo porcine thyroid peroxidase assays indicate no effect of triclosan (Hornung, personal communication). Other mechanisms that could contribute to the observed hypothyroxinemia, including inhibition of iodide uptake, competition with TH serum–binding proteins, and upregulation of deiodinase activity, have not been assessed.
Extrapolation of the current findings to humans should be tempered by a number of uncertainties, including the dose range used herein versus estimated human exposures. The BMDL for a 20% decrease in T4 calculated from the data presented is 65.6 mg/kg/day in a 4-day exposure scenario. This short-term exposure model is intended for use as a tool in exploring mechanisms of thyroid disruption and does not model prolonged daily human exposure. The target human population of interest due to the presence of triclosan in breast milk and its potential to disrupt TH, and subsequent adverse impacts on neurological development, is the developing neonate and infant. Human infant daily oral exposure is estimated to be 0.005 mg/kg/day (U.S. EPA, 2008). Thus, comparing our BMDL to this daily intake yields a margin of exposure of ∼13,000-fold. Note that this does not take into account uncertainty factors used in the extrapolation of data obtained in rats to human risk; pharmacodynamic and pharmacokinetic differences in triclosan metabolism between species may greatly impact the relative effects.
The present work confirms the conclusion that triclosan disrupts thyroxine and triiodothyronine in the rat. Furthermore, the effects of triclosan on hepatic mRNA and enzymatic activity point out important key events in one potential mode of action of triclosan-induced hypothyroxinemia in rats and suggest that CAR/PXR activation, with subsequent upregulation of hepatic catabolism of T4, may be one mechanism that contributes to the observed hypothyroxinemia. In order to improve the ability to extrapolate these findings to humans, future research should characterize interspecies similarities and differences in these key events.
SUPPLEMENTARY DATA
Supplementary data are available online at http://toxsci.oxfordjournals.org/.
FUNDING
EPA/UNC Toxicology Research Program, Training Agreement (CR833237 to K.B.P.); the National Institute of Environmental Health Science Training grant (T32-ES07126 to K.B.P.).
Supplementary Material
Acknowledgments
The authors would like to thank Dr Joyce Royland for assistance in performing the RT-PCR assays and Drs Leah Zorrilla, Angela Buckalew, and Ashley Murr for performing the TSH assays. Drs Susan Hester and Douglas Wolf are gratefully acknowledged for comments on an earlier version of this manuscript. We also thank Drs James Plautz and Lisa Navarro for supplying analytical purity data on the triclosan used in this study.
References
- Adolfsson-Erici M, Pettersson M, Parkkonen J, Sturve J. Triclosan, a commonly used bactericide found in human milk and in the aquatic environment in Sweden. Chemosphere. 2002;46:1485–1489. doi: 10.1016/s0045-6535(01)00255-7. [DOI] [PubMed] [Google Scholar]
- Ahn KC, Zhao B, Chen J, Cherednichenko G, Sanmarti E, Denison MS, Lasley B, Pessah IN, Kultz D, Chang DP, et al. In vitro biologic activities of the antimicrobials triclocarban, its analogs, and triclosan in bioassay screens: receptor-based bioassay screens. Environ. Health Perspect. 2008;116:1203–1210. doi: 10.1289/ehp.11200. [DOI] [PMC free article] [PubMed] [Google Scholar]
- Allmyr M, Adolfsson-Erici M, McLachlan MS, Sandborgh-Englund G. Triclosan in plasma and milk from Swedish nursing mothers and their exposure via personal care products. Sci. Total Environ. 2006;372:87–93. doi: 10.1016/j.scitotenv.2006.08.007. [DOI] [PubMed] [Google Scholar]
- Auyeung DJ, Kessler FK, Ritter JK. Mechanism of rat UDP-glucuronosyltransferase 1A6 induction by oltipraz: evidence for a contribution of the Aryl hydrocarbon receptor pathway. Mol. Pharmacol. 2003;63:119–127. doi: 10.1124/mol.63.1.119. [DOI] [PubMed] [Google Scholar]
- Barter RA, Klaassen CD. Reduction of thyroid hormone levels and alteration of thyroid function by four representative UDP-glucuronosyltransferase inducers in rats. Toxicol. Appl. Pharmacol. 1994;128:9–17. doi: 10.1006/taap.1994.1174. [DOI] [PubMed] [Google Scholar]
- Beetstra JB, van Engelen JG, Karels P, van der Hoek HJ, de Jong M, Docter R, Krenning E, Hennemann G, Brouwer A, Visser TJ. Thyroxine and 3,3′,5-triiodothyronine are glucuronidated in rat liver by different uridine diphosphate-glucuronyltransferases. Endocrinology. 1991;128:741–746. doi: 10.1210/endo-128-2-741. [DOI] [PubMed] [Google Scholar]
- Bhargava HN, Leonard PA. Triclosan: applications and safety. Am. J. Infect. Control. 1996;24:209–218. doi: 10.1016/s0196-6553(96)90017-6. [DOI] [PubMed] [Google Scholar]
- Boas M, Feldt-Rasmussen U, Skakkebaek NE, Main KM. Environmental chemicals and thyroid function. Eur. J. Endocrinol. 2006;154:599–611. doi: 10.1530/eje.1.02128. [DOI] [PubMed] [Google Scholar]
- Burke MD, Thompson S, Weaver RJ, Wolf CR, Mayer RT. Cytochrome P450 specificities of alkoxyresorufin O-dealkylation in human and rat liver. Biochem. Pharmacol. 1994;48:923–936. doi: 10.1016/0006-2952(94)90363-8. [DOI] [PubMed] [Google Scholar]
- Calafat AM, Ye X, Wong LY, Reidy JA, Needham LL. Urinary concentrations of triclosan in the U.S. population: 2003-2004. Environ. Health Perspect. 2008;116:303–307. doi: 10.1289/ehp.10768. [DOI] [PMC free article] [PubMed] [Google Scholar]
- Capen CC. Mechanisms of chemical injury of thyroid gland. Prog. Clin. Biol. Res. 1994;387:173–191. [PubMed] [Google Scholar]
- Chen J, Ahn KC, Gee NA, Gee SJ, Hammock BD, Lasley BL. Antiandrogenic properties of parabens and other phenolic containing small molecules in personal care products. Toxicol. Appl. Pharmacol. 2007;221:278–284. doi: 10.1016/j.taap.2007.03.015. [DOI] [PMC free article] [PubMed] [Google Scholar]
- Cheng X, Maher J, Dieter MZ, Klaassen CD. Regulation of mouse organic anion-transporting polypeptides (Oatps) in liver by prototypical microsomal enzyme inducers that activate distinct transcription factor pathways. Drug Metab. Dispos. 2005;33:1276–1282. doi: 10.1124/dmd.105.003988. [DOI] [PubMed] [Google Scholar]
- Cherrington NJ, Hartley DP, Li N, Johnson DR, Klaassen CD. Organ distribution of multidrug resistance proteins 1, 2, and 3 (Mrp1, 2, and 3) mRNA and hepatic induction of Mrp3 by constitutive androstane receptor activators in rats. J. Pharmacol. Exp. Ther. 2002;300:97–104. doi: 10.1124/jpet.300.1.97. [DOI] [PubMed] [Google Scholar]
- Chomczynski P, Sacchi N. Single-step method of RNA isolation by acid guanidinium thiocyanate-phenol-chloroform extraction. Anal. Biochem. 1987;162:156–159. doi: 10.1006/abio.1987.9999. [DOI] [PubMed] [Google Scholar]
- Craft ES, DeVito MJ, Crofton KM. Comparative responsiveness of hypothyroxinemia and hepatic enzyme induction in Long-Evans rats versus C57BL/6J mice exposed to TCDD-like and phenobarbital-like polychlorinated biphenyl congeners. Toxicol. Sci. 2002;68:372–380. doi: 10.1093/toxsci/68.2.372. [DOI] [PubMed] [Google Scholar]
- Crofton KM. Developmental disruption of thyroid hormone: correlations with hearing dysfunction in rats. Risk Anal. 2004;24:1665–1671. doi: 10.1111/j.0272-4332.2004.00557.x. [DOI] [PubMed] [Google Scholar]
- Crofton KM. Thyroid disrupting chemicals: mechanisms and mixtures. Int. J. Androl. 2008;31:209–223. doi: 10.1111/j.1365-2605.2007.00857.x. [DOI] [PubMed] [Google Scholar]
- Crofton KM, Paul KB, Hedge JM, DeVito MJ. Short-term in vivo exposure to the water contaminant triclosan: evidence for disruption of thyroxine. Environ. Toxicol. Pharmacol. 2007;24:194–197. doi: 10.1016/j.etap.2007.04.008. [DOI] [PubMed] [Google Scholar]
- Crofton KM, Zoeller RT. Mode of action: neurotoxicity induced by thyroid hormone disruption during development—hearing loss resulting from exposure to PHAHs. Crit. Rev. Toxicol. 2005;35:757–769. doi: 10.1080/10408440591007304. [DOI] [PubMed] [Google Scholar]
- Dayan AD. Risk assessment of triclosan [Irgasan((R))] in human breast milk. Food Chem. Toxicol. 2007;45:125–129. doi: 10.1016/j.fct.2006.08.009. [DOI] [PubMed] [Google Scholar]
- DeVito M, Biegel L, Brouwer A, Brown S, Brucker-Davis F, Cheek AO, Christensen R, Colborn T, Cooke P, Crissman J. Screening methods for thyroid hormone disruptors. Environ. Health Perspect. 1999;107:407–415. doi: 10.1289/ehp.99107407. [DOI] [PMC free article] [PubMed] [Google Scholar]
- DeVito MJ, Maier WE, Diliberto JJ, Birnbaum LS. Comparative ability of various PCBs, PCDFs, and TCDD to induce cytochrome P450 1A1 and 1A2 activity following 4 weeks of treatment. Fundam. Appl. Toxicol. 1993;20:125–130. [PubMed] [Google Scholar]
- Dunn RT, II, Klaassen CD. Tissue-specific expression of rat sulfotransferase messenger RNAs. Drug Metab. Dispos. 1998;26:598–604. [PubMed] [Google Scholar]
- Gee RH, Charles A, Taylor N, Darbre PD. Oestrogenic and androgenic activity of triclosan in breast cancer cells. J. Appl. Toxicol. 2008;28:78–91. doi: 10.1002/jat.1316. [DOI] [PubMed] [Google Scholar]
- Greenwood FC, Hunter WM, Glover JS. The preparation of I-131-labelled human growth hormone of high specific radioactivity. Biochem. J. 1963;89:114–123. doi: 10.1042/bj0890114. [DOI] [PMC free article] [PubMed] [Google Scholar]
- Hanioka N, Jinno H, Nishimura T, Ando M. Effect of 2,4,4′-trichloro-2′-hydroxydiphenyl ether on cytochrome P450 enzymes in the rat liver. Chemosphere. 1997;34:719–730. doi: 10.1016/s0045-6535(97)00464-5. [DOI] [PubMed] [Google Scholar]
- Hanioka N, Omae E, Nishimura T, Jinno H, Onodera S, Yoda R, Ando M. Interaction of 2,4,4′-trichloro-2′-hydroxydiphenyl ether with microsomal cytochrome P450-dependent monooxygenases in rat liver. Chemosphere. 1996;33:265–276. doi: 10.1016/0045-6535(96)00169-5. [DOI] [PubMed] [Google Scholar]
- Hill RN, Crisp TM, Hurley PM, Rosenthal SL, Singh DV. Risk assessment of thyroid follicular cell tumors. Environ. Health Perspect. 1998;106:447–457. doi: 10.1289/ehp.98106447. [DOI] [PMC free article] [PubMed] [Google Scholar]
- Hood A, Hashmi R, Klaassen CD. Effects of microsomal enzyme inducers on thyroid-follicular cell proliferation, hyperplasia, and hypertrophy. Toxicol. Appl. Pharmacol. 1999;160:163–170. doi: 10.1006/taap.1999.8752. [DOI] [PubMed] [Google Scholar]
- Hood A, Klaassen CD. Differential effects of microsomal enzyme inducers on in vitro thyroxine (T(4)) and triiodothyronine (T(3)) glucuronidation. Toxicol. Sci. 2000;55:78–84. doi: 10.1093/toxsci/55.1.78. [DOI] [PubMed] [Google Scholar]
- Houtman CJ, Van Oostveen AM, Brouwer A, Lamoree MH, Legler J. Identification of estrogenic compounds in fish bile using bioassay-directed fractionation. Environ. Sci. Technol. 2004;38:6415–6423. doi: 10.1021/es049750p. [DOI] [PubMed] [Google Scholar]
- Hovander L, Malmberg T, Athanasiadou M, Athanassiadis I, Rahm S, Bergman A, Wehler EK. Identification of hydroxylated PCB metabolites and other phenolic halogenated pollutants in human blood plasma. Arch. Environ. Contam. Toxicol. 2002;42:105–117. doi: 10.1007/s002440010298. [DOI] [PubMed] [Google Scholar]
- Jacobs MN, Nolan GT, Hood SR. Lignans, bacteriocides and organochlorine compounds activate the human pregnane X receptor (PXR) Toxicol. Appl. Pharmacol. 2005;209:123–133. doi: 10.1016/j.taap.2005.03.015. [DOI] [PubMed] [Google Scholar]
- Jinno H, Hanioka N, Onodera S, Nishimura T, Ando M. Irgasan DP 300 (5-chloro-2-(2,4-dichlorophenoxy)-phenol) induces cytochrome P450s and inhibits haem biosynthesis in rat hepatocytes cultured on Matrigel. Xenobiotica. 1997;27:681–692. doi: 10.1080/004982597240271. [DOI] [PubMed] [Google Scholar]
- Johnson DR, Klaassen CD. Regulation of rat multidrug resistance protein 2 by classes of prototypical microsomal enzyme inducers that activate distinct transcription pathways. Toxicol. Sci. 2002a;67:182–189. doi: 10.1093/toxsci/67.2.182. [DOI] [PubMed] [Google Scholar]
- Johnson DR, Klaassen CD. Role of rat multidrug resistance protein 2 in plasma and biliary disposition of dibromosulfophthalein after microsomal enzyme induction. Toxicol. Appl. Pharmacol. 2002b;180:56–63. doi: 10.1006/taap.2002.9375. [DOI] [PubMed] [Google Scholar]
- Kaptein E, van Haasteren GA, Linkels E, de Greef WJ, Visser TJ. Characterization of iodothyronine sulfotransferase activity in rat liver. Endocrinology. 1997;138:5136–5143. doi: 10.1210/endo.138.12.5555. [DOI] [PubMed] [Google Scholar]
- Kester MH, Kaptein E, Roest TJ, van Dijk CH, Tibboel D, Meinl W, Glatt H, Coughtrie MW, Visser TJ. Characterization of rat iodothyronine sulfotransferases. Am. J. Physiol. 2003;285:E592–E598. doi: 10.1152/ajpendo.00046.2003. [DOI] [PubMed] [Google Scholar]
- Klaassen CD, Slitt AL. Regulation of hepatic transporters by xenobiotic receptors. Curr. Drug Metab. 2005;6:309–328. doi: 10.2174/1389200054633826. [DOI] [PubMed] [Google Scholar]
- Kolpin DW, Furlong ET, Meyer MT, Thurman EM, Zaugg SD, Barber LB, Buxton HT. Pharmaceuticals, hormones, and other organic wastewater contaminants in U.S. streams, 1999-2000: a national reconnaissance. Environ. Sci. Technol. 2002;36:1202–1211. doi: 10.1021/es011055j. [DOI] [PubMed] [Google Scholar]
- Kretschmer XC, Baldwin WS. CAR and PXR: xenosensors of endocrine disrupters? Chem. Biol. Interact. 2005;155:111–128. doi: 10.1016/j.cbi.2005.06.003. [DOI] [PubMed] [Google Scholar]
- Lecureux L, Dieter MZ, Nelson DM, Watson L, Wong H, Gemzik B, Klaassen CD, Lehman-McKeeman LD. Hepatobiliary disposition of thyroid hormone in Mrp2-deficient TR-rats: reduced biliary excretion of thyroxine glucuronide does not prevent xenobiotic-induced hypothyroidism. Toxicol. Sci. 2009;108:482–491. doi: 10.1093/toxsci/kfp026. [DOI] [PubMed] [Google Scholar]
- Liu J, Liu Y, Barter RA, Klaassen CD. Alteration of thyroid homeostasis by UDP-glucuronosyltransferase inducers in rats: a dose-response study. J. Pharmacol. Exp. Ther. 1995;273:977–985. [PubMed] [Google Scholar]
- Livak KJ, Schmittgen TD. Analysis of relative gene expression data using real-time quantitative PCR and the 2(-Delta Delta C(T)) method. Methods. 2001;25:402–408. doi: 10.1006/meth.2001.1262. [DOI] [PubMed] [Google Scholar]
- Mason G, Safe S. Synthesis, biologic and toxic effects of the major 2,3,7,8-tetrachlorodibenzo-p-dioxin metabolites in the rat. Toxicology. 1986;41:153–159. doi: 10.1016/0300-483x(86)90196-4. [DOI] [PubMed] [Google Scholar]
- McClain RM. The significance of hepatic microsomal enzyme induction and altered thyroid function in rats: implications for thyroid gland neoplasia. Toxicol. Pathol. 1989;17:294–306. doi: 10.1177/019262338901700206. [DOI] [PubMed] [Google Scholar]
- McClain RM, Levin AA, Posch R, Downing JC. The effect of phenobarbital on the metabolism and excretion of thyroxine in rats. Toxicol. Appl. Pharmacol. 1989;99:216–228. doi: 10.1016/0041-008x(89)90004-5. [DOI] [PubMed] [Google Scholar]
- McClanahan SF, Bartizek RD. Effects of triclosan/copolymer dentifrice on dental plaque and gingivitis in a 3-month randomized controlled clinical trial: influence of baseline gingivitis on observed efficacy. J. Clin. Dent. 2002;13:167–178. [PubMed] [Google Scholar]
- Metz RP, Auyeung DJ, Kessler FK, Ritter JK. Involvement of hepatocyte nuclear factor 1 in the regulation of the UDP-glucuronosyltransferase 1A7 (UGT1A7) gene in rat hepatocytes. Mol. Pharmacol. 2000;58:319–327. doi: 10.1124/mol.58.2.319. [DOI] [PubMed] [Google Scholar]
- Paxeus N. Organic pollutants in effluents of large wastewater treatment plants in Sweden. Water Res. 1996;30:1115–1122. [Google Scholar]
- Pohjanvirta R, Niittynen M, Linden J, Boutros PC, Moffat ID, Okey AB. Evaluation of various housekeeping genes for their applicability for normalization of mRNA expression in dioxin-treated rats. Chem. Biol. Interact. 2006;160:134–149. doi: 10.1016/j.cbi.2006.01.001. [DOI] [PubMed] [Google Scholar]
- Qatanani M, Zhang J, Moore DD. Role of the constitutive androstane receptor in xenobiotic-induced thyroid hormone metabolism. Endocrinology. 2005;146:995–1002. doi: 10.1210/en.2004-1350. [DOI] [PubMed] [Google Scholar]
- Richardson VM, Staskal DF, Ross DG, Diliberto JJ, DeVito MJ, Birnbaum LS. Possible mechanisms of thyroid hormone disruption in mice by BDE 47, a major polybrominated diphenyl ether congener. Toxicol. Appl. Pharmacol. 2008;226:244–250. doi: 10.1016/j.taap.2007.09.015. [DOI] [PubMed] [Google Scholar]
- Sandborgh-Englund G, Adolfsson-Erici M, Odham G, Ekstrand J. Pharmacokinetics of triclosan following oral ingestion in humans. J. Toxicol. Environ. Health. 2006;69:1861–1873. doi: 10.1080/15287390600631706. [DOI] [PubMed] [Google Scholar]
- Schlecht C, Klammer H, Wuttke W, Jarry H. A dose-response study on the estrogenic activity of benzophenone-2 on various endpoints in the serum, pituitary and uterus of female rats. Arch. Toxicol. 2006;80:656–661. doi: 10.1007/s00204-006-0085-1. [DOI] [PubMed] [Google Scholar]
- Schuur AG, Legger FF, van Meeteren ME, Moonen MJ, van Leeuwen-Bol I, Bergman A, Visser TJ, Brouwer A. In vitro inhibition of thyroid hormone sulfation by hydroxylated metabolites of halogenated aromatic hydrocarbons. Chem. Res. Toxicol. 1998;11:1075–1081. doi: 10.1021/tx9800046. [DOI] [PubMed] [Google Scholar]
- Shelby MK, Cherrington NJ, Vansell NR, Klaassen CD. Tissue mRNA Expression of the Rat UDP-glucuronosyltransferase Gene Family. Drug Metab. Dispos. 2003;31:326–333. doi: 10.1124/dmd.31.3.326. [DOI] [PubMed] [Google Scholar]
- Sueyoshi T, Kawamoto T, Zelko I, Honkakoski P, Negishi M. The repressed nuclear receptor CAR responds to phenobarbital in activating the human CYP2B6 gene. J. Biol. Chem. 1999;274:6043–6046. doi: 10.1074/jbc.274.10.6043. [DOI] [PubMed] [Google Scholar]
- Sugatani J, Sueyoshi T, Negishi M, Miwa M. Regulation of the human UGT1A1 gene by nuclear receptors constitutive active/androstane receptor, pregnane X receptor, and glucocorticoid receptor. Methods Enzymol. 2005;400:92–104. doi: 10.1016/S0076-6879(05)00006-6. [DOI] [PubMed] [Google Scholar]
- U.S. Environmental Protection Agency (U.S. EPA) 2000. Benchmark Dose Technical Guidance Document External Review Draft. Risk Assessment Forum. Available at: http://www.epa.gov/ncea/pdfs/bmds/BMD-External_10_13_2000.pdf Accessed November 23, 2009. [Google Scholar]
- U.S. Environmental Protection Agency (U.S. EPA) EPA 739-RO-8009. 2008. Reregistration eligibility decision for Triclosan, Available at www.epa.gov/oppsrrd1/reds/2340red.pdfAccessed November 23, 2009. [Google Scholar]
- Vansell NR, Klaassen CD. Increased biliary excretion of thyroxine by microsomal enzyme inducers. Toxicol. Appl. Pharmacol. 2001;176:187–194. doi: 10.1006/taap.2001.9278. [DOI] [PubMed] [Google Scholar]
- Vansell NR, Klaassen CD. Increase in rat liver UDP-glucuronosyltransferase mRNA by microsomal enzyme inducers that enhance thyroid hormone glucuronidation. Drug Metab. Dispos. 2002;30:240–246. doi: 10.1124/dmd.30.3.240. [DOI] [PubMed] [Google Scholar]
- Veldhoen N, Skirrow RC, Osachoff H, Wigmore H, Clapson DJ, Gunderson MP, Van Aggelen G, Helbing CC. The bactericidal agent triclosan modulates thyroid hormone-associated gene expression and disrupts postembryonic anuran development. Aquat. Toxicol. 2006;80:217–227. doi: 10.1016/j.aquatox.2006.08.010. [DOI] [PubMed] [Google Scholar]
- Wang LQ, Falany CN, James MO. Triclosan as a substrate and inhibitor of 3′-phosphoadenosine 5′-phosphosulfate-sulfotransferase and UDP-glucuronosyl transferase in human liver fractions. Drug Metab. Dispos. 2004;32:1162–1169. doi: 10.1124/dmd.104.000273. [DOI] [PubMed] [Google Scholar]
- Wang LQ, James MO. Inhibition of sulfotransferases by xenobiotics. Curr. Drug Metab. 2006;7:83–104. doi: 10.2174/138920006774832596. [DOI] [PubMed] [Google Scholar]
- Wolff MS, Teitelbaum SL, Windham G, Pinney SM, Britton JA, Chelimo C, Godbold J, Biro F, Kushi LH, Pfeiffer CM, et al. Pilot study of urinary biomarkers of phytoestrogens, phthalates, and phenols in girls. Environ. Health Perspect. 2007;115:116–121. doi: 10.1289/ehp.9488. [DOI] [PMC free article] [PubMed] [Google Scholar]
- Wong H, Lehman-McKeeman LD, Grubb MF, Grossman SJ, Bhaskaran VM, Solon EG, Shen HS, Gerson RJ, Car BD, Zhao B, Gemzik B. Increased hepatobiliary clearance of unconjugated thyroxine determines DMP 904-induced alterations in thyroid hormone homeostasis in rats. Toxicol. Sci. 2005;84:232–242. doi: 10.1093/toxsci/kfi094. [DOI] [PubMed] [Google Scholar]
- Zhou T, Ross DG, DeVito MJ, Crofton KM. Effects of short-term in vivo exposure to polybrominated diphenyl ethers on thyroid hormones and hepatic enzyme activities in weanling rats. Toxicol. Sci. 2001;61:76–82. doi: 10.1093/toxsci/61.1.76. [DOI] [PubMed] [Google Scholar]
- Zhou T, Taylor MM, DeVito MJ, Crofton KM. Developmental exposure to brominated diphenyl ethers results in thyroid hormone disruption. Toxicol. Sci. 2002;66:105–116. doi: 10.1093/toxsci/66.1.105. [DOI] [PubMed] [Google Scholar]
- Zorrilla LM, Gibson EK, Jeffay SC, Crofton KM, Setzer WR, Cooper RL, Stoker TE. The effects of triclosan on puberty and thyroid hormones in male Wistar rats. Toxicol. Sci. 2009;107:56–64. doi: 10.1093/toxsci/kfn225. [DOI] [PubMed] [Google Scholar]
Associated Data
This section collects any data citations, data availability statements, or supplementary materials included in this article.