Abstract
We have characterized cell death in THP-1 cells after exposure to heat-treated spores from satratoxin G–producing Stachybotrys chartarum isolate IBT 9631, atranone-producing S. chartarum isolate IBT 9634, and sterigmatocystin-producing Aspergillus versicolor isolate IBT 3781, as well as the trichothecenes T-2 and satratoxin G. Spores induced cell death within 3–6 h, with Stachybotrys appearing most potent. IBT 9631 induced both apoptosis and necrosis, while IBT 9634 and IBT 3781 induced mostly necrosis. T-2 toxin and satratoxin G caused mainly apoptosis. Comet assay ± formamidopyrimidine DNA glycosylase showed that only the spore exposures induced early (3h) oxidative DNA damage. Likewise, only the spores increased the formation of reactive oxygen species (ROS), suggesting that spores as particles may induce ROS formation and oxidative DNA damage. Increased Ataxia Telangiectasia Mutated (ATM) phosphorylation, indicating DNA damage, was observed after all exposures. The DNA damage response induced by IBT 9631 as well as satratoxin G was characterized by rapid (15 min) activation of p38 and H2AX. The p38 inhibitor SB 202190 reduced IBT 9631–induced H2AX activation. Both IBT 9631 and T-2 induced activation of Chk2 and H2AX after 3 h. The ATM inhibitor KU 55933, as well as transfection of cells with ATM siRNA, reduced this activation, suggesting a partial role for ATM as upstream activator for Chk2 and H2AX. In conclusion, activation of Chk2 and H2AX correlated with spore- and toxin-induced apoptosis. For IBT 9631 and satratoxin G, additional factors may be involved in triggering apoptosis, most notably p38 activation.
Keywords: mold, mycotoxins, DNA damage response, apoptosis
Mold spores and their associated mycotoxins have been suggested to be the cause of a variety of human health problems such as asthma and allergic rhinitis related to water-damaged indoor environments. Animal studies have shown that mycotoxins may cause a variety of adverse effects, including acute toxic effects and cancer (Etzel, 2002). In the lung, inhaled mycotoxins may exert their effects through direct cytotoxicity as well as induction of inflammatory responses. However, linking adverse human health effects other than allergic responses to molds and mycotoxins in the indoor environment is still highly controversial (Hardin et al., 2003). Furthermore, inflammagenic substances other than mycotoxins can be present within spores (Green et al., 2005) and might potentially contribute to their suggested health effects. Thus, it is particularly important to understand how spores of toxigenic molds affect the innate immunoresponse. An important issue to further explore in this context is the more specific mechanisms involved in the effects of various mycotoxins versus the effect of spores per se.
Stachybotrys chartarum is a mold that is frequently associated with water-damaged indoor environments and reported complaints about poor indoor air quality. Many S. chartarum isolates produce trichothecenes, a large family of highly toxic mycotoxins. Trichothecenes might contribute to immune dysfunction, impaired respiratory function, as well as neuronal cell death. The trichothecenes are often divided into several groups according to both their chemical properties and their producer fungi. The macrocyclic trichothecenes, which include the satratoxins, are produced by several fungal species including Stachybotrys spp., whereas T-2 toxin, a type A trichothecene, is synthesized by various Fusarium molds. In addition to trichothecenes, S. chartarum can also produce a family of mycotoxins known as atranones that are able to induce pulmonary inflammation in animals (Pestka et al., 2008).
Another mold frequently associated with indoor air quality problems is the Aspergillus. More than 200 Aspergillus species are known that can produce a wide variety of mycotoxins. Among these is the sterigmatocystin-producing Aspergillus versicolor. Sterigmatocystin has been identified in samples of carpet dust (containing A. versicolor isolates) from damp indoor environments (Engelhart et al., 2002). Sterigmatocystin is a biosynthetic precursor of aflatoxins and is considered to be a potent carcinogen, mutagen, and teratogen (Versilovskis and De Saeger, 2010).
It has been suggested that the most prominent effect of trichothecenes is their action as potent inhibitors of protein synthesis (Cole and Cox, 1981; McLaughlin et al., 1977). Trichothecenes also have inhibitory effects on RNA and DNA synthesis, but this is most likely secondary to the inhibition of protein synthesis (Cundliffe and Davies, 1977; Nagase et al., 2002; Nielsen et al., 2002; Yang et al., 2000). A number of studies have demonstrated the capability of trichothecenes to induce apoptotic cell death in a variety of cell types (Islam et al., 2008; Shifrin and Anderson, 1999; Yang et al., 2000). Inhibitors of protein synthesis as such have been reported to both increase and inhibit apoptosis depending on cell-stimuli combination (Mattson and Furukawa, 1997; Olmo et al., 2001); thus, there is no generalizable link between translational inhibition and apoptosis. Recently, trichothecenes were reported to induce apoptosis through activation of mitogen-activated protein kinase (MAPK) via a mechanism that has been termed the ribotoxic stress response. Data from Zhou et al. (2003) suggest that double-stranded RNA-activated protein kinase R (PKR) is a critical upstream mediator of the ribotoxic stress response induced by the trichothecene deoxynivalenol (DON). Furthermore, satratoxin G–induced apoptosis in PC-12 neuronal cells was found to be mediated by PKR. Other apoptosis-triggering signals that could be relevant for the molds includes endoplasmic reticulum stress and DNA damage.
Ruotsalainen et al. (1998) found that in vitro exposure to Stachybotrys spp. spores resulted in an immediate increase in reactive oxygen species (ROS) formation in human polymorphonuclear leukocytes, which thereby may result in oxidative DNA damage. Theoretically, this effect could be due to the spore being a particle, as particles are known to induce oxidative damage (González-Flecha, 2004). Another possibility could be that the spore-associated mycotoxins might induce the observed DNA damage. Stachybotrys chartarum extracts have been shown to oxidize glutathione, induce DNA single strand breaks, as well as increase the frequency of micronuclei (Wang and Yadav, 2006). Very recently, T-2 toxin was suggested to cause oxidative damage, DNA damage, and phosphorylation of p53 as early as 2–4 h after start of exposure (Chaudhari et al., 2009). Furthermore, sterigmatocystin, which is structurally related to the aflatoxins, although considered less potent, is known to form DNA adducts (Gopalakrishnan et al., 1992).
The cellular response to DNA damage involves pathways important for cell survival reactions, including regulation of DNA repair, DNA replication, and proliferation. If the amount or type of damage exceeds the repair capacity of the cells, the apoptotic process may be triggered (Roos and Kaina, 2006). One important sensor of DNA damage is Ataxia Telangiectasia Mutated (ATM) kinase, a member of the phosphoinositide 3-kinase (PI3K) cell signaling family, often triggered by double-stranded DNA breaks (DSBs) and larger topological changes (Burma et al., 2001; Lee and Paull, 2005, 2007). Downstream target molecules of ATM kinase include the checkpoint kinase Chk2 and the histone H2AX. Chk2 is thought to play a central role in the DNA damage response by relaying signals to the cell cycle machinery. This may result in a delayed cell cycle allowing repair of DNA damage or in cell death if repair cannot take place. Another step in an efficient recognition and repair response to DSB is the phosphorylation of H2AX to γH2AX. While several members of the PI3K-like family of protein kinases including DNA-protein kinase, ATM, and ATR (ATM and Rad3 related) as well as the MAPK p38 have been implicated in H2AX phosphorylation, recent findings suggest that ATM is the major kinase involved in this phosphorylation (Burma et al., 2001).
The aim of this study was to compare how spores from different toxigenic molds affect the monocyte-macrophage lineage, a critical element of the innate immune response. We characterized mechanisms of cell death in the THP-1 monocyte model after exposure to heat-treated non-viable spores from trichothecene-producing S. chartarum (1BT 9631), atranone-producing S. chartarum (IBT 9634), or sterigmatocystin-producing A. versicolor (IBT 3781) strains. More specifically, the IBT 9631–induced apoptosis was compared with the effects of the model trichothecene T-2 toxin and satratoxin G regarding the possible role of DNA damage and associated downstream pathways.
MATERIALS AND METHODS
Reagents.
RPMI 1640 culture medium and fetal bovine serum (FBS) were obtained from Gibco BRL (Paisley, Scotland). All other chemicals used were purchased from commercial sources at highest purity available. Antibody toward phospho-(p)ATM (s1981, #AF 1655) was purchased from R & D Systems, whereas phosphospecific antibody toward PKR (pTyr 451, #AT-7137) was purchased from MBL International Corporation. Antibodies toward apoptosis inducing factor (AIF) (#4642), cleaved poly(ADP-ribose)polymerase (PARP) (#9544), β-actin (#4967), endonuclease G (endoG) (#4969), Chk2 (Thr 68, #2661), Chk1 (Ser 345, #2341), γH2AX (Ser 139, #2577), direct-conjugated γH2AX-Fluor Alexa 488 antibody, and phospho-p38 (thr180/Tyr 182, #9211) were all purchased from Cell Signaling. Low melting point agarose (LMPA) and normal melting point agarose (NMPA) were from Invitrogen. Formamidopyrimidine DNA glycosylase (fpg) was kindly provided by Andrew Collins (University of Oslo, Norway). ATM small interfering RNA (siRNA) (sc-29761) was purchased from Santa Cruz Biotechnology. The broad-spectrum caspase inhibitor Z-VAD-FMK was from Alexis Biochemicals, pure T-2 toxin and the ATM inhibitor KU 55933 were from Sigma-Aldrich, whereas the p38 inhibitor SB 202190 was purchased from Calbiochem. Satratoxin G was purified from S. chartarum cultures as previously described (Islam et al., 2009).
Cell cultures.
The human THP-1 monocyte cell line was cultured in RPMI 1640 medium with 10% (vol/vol) fetal calf serum, to which 100 μg/ml gentamicin and 4-(2-hydroxyethyl)-1-piperazineethanesulfonic acid (HEPES) were added. Media were replaced every 2–3 days. Studies were performed at densities of 1 × 10⁶ cells/ml. All cell preparations were performed at room temperature using aseptic techniques in a laminar flow hood.
Mold spore preparation.
Mold cultures were obtained from Biocentrum-DTU (Denmark Technical University). These included S. chartarum IBT 9631 (satratoxin producer), S. chartarum IBT 9634 (atranone producer), and A. versicolor IBT 3781 (sterigmatocystin producer). The strains were densely spread on 90-mm malt extract agar plates (Samson et al., 2004) and incubated upside down in perforated plastic bags at 25 ± 1°C in the dark for 14 days before harvesting of the conidia. One milliliter sterile tap water was added to each plate, and the spores were carefully scraped off by means of a sterile L-shaped spreader. Spores and water from one single agar plate were then transferred to one sterile 2-ml Eppendorf tube. After immediate autoclaving of the Eppendorf tubes in glass jars at 121°C for 15 min, they were cooled and stored at 4 ± 1°C until use. The heat treatment killed the conidia, whereas the toxins are considered heat resistant.
Satratoxin G in S. chartarum IBT 9631 spore preparation was confirmed by ELISA (Chung et al., 2003). Spores were microfuged and the aqueous phase diluted (1:5 and 1:25) and analyzed by ELISA. The latter was readable in our standard curve. The IBT 9631 strain contained satratoxin G at a concentration of ∼3 × 10⁻⁸ μg/spore. Satratoxin G was not detected in the other two spore preparations.
Assessment of cell death.
THP-1 cells were exposed to various concentrations of the S. chartarum spores (0.1, 0.5, or 1.0 × 10⁷ spores/million cells), A. versicolor spores (0.5, 1.0, 4.0, or 8.0 × 1.0 × 107 spores/million cells), or T-2 toxin (4μM) for either 3 or 6 h. The T-2 concentration was chosen based on reported concentrations used with Jurkat cells (Shifrin and Anderson, 1999) and alveolar macrophages (Gerberick and Sorenson, 1983) and because similar responses were observed for IBT 9631 spores and this concentration of T-2 toxin. Plasma membrane damage and changes in nuclear morphology associated with necrosis and apoptosis of the THP-1 cells were determined after staining cells (∼1.0 × 10⁶ cells) with propidium iodide (PI; 10 μg/ml) and Hoechst 33342 (5 μg/ml) (Sigma Chemical Company, MO) for 30 min. Smears made from THP-1 cells suspended in FBS were air dried quickly. Cell morphology was evaluated using a Nikon Eclipse E400 fluorescence microscope. Cells with distinct condensed nuclei, segregated nuclei, and apoptotic bodies were counted as apoptotic and determined as a fraction of the total number of cells. Non-apoptotic cells, excluding PI, were categorized as viable cells. PI-stained cells with a round morphology and homogeneously stained nucleus were termed PI positive.
Immunocytochemistry.
To investigate presence and localization of proteins associated with cell death and DNA damage after 3-h exposure to spores or T-2 toxin, cells were stained for AIF, endoG, cleaved PARP, γH2AX, and phosphorylated ataxia telangiectasia mutated. Briefly, after exposure, cells were washed in PBS and fixed in methanol for 3 min before incubation for 20 h with rabbit anti-AIF, endoG, PARP, or γH2AX (all in working dilution 1:500) at room temperature. After washing and incubation with an anti-rabbit fluorescein-isothiocyanate-conjugated antibody for 3 h, the preparations were mounted and visualized using a Nikon Eclipse E400 microscope and a SPOT diagnostic instruments digital camera. As controls, the secondary antibody was omitted.
Western blotting.
THP-1 cells were seeded and exposed on 33-mm2 culture dishes at a density of 1.0 × 10⁶ cells/cm2. After exposure, the cells were harvested in ice-cold PBS containing phenylmethanesulfonyl (1mM). Isolated total protein (12.5–25 μg) was electrophoresed (Laemmli, 1970), blotted onto nitrocellulose filters, and analyzed using specific antibodies (Towbin et al., 1979). To confirm equal levels of protein in each well, Ponceau staining and β-actin were used as loading controls. Filters were blocked with 3% Bovine Serum Albumin (BSA) in tris buffered saline (TBS)-Tween (0.1% [vol/vol] Tween 20) and then incubated with primary antibodies diluted in TBS-Tween containing 1% (wt/vol) BSA. Working dilutions of 1:4000 (p-Chk2, γH2AX, and p-Chk1) and 1:5000 (β-actin) were found to be appropriate for immunoblotting. Immunoreactive protein was detected using a chemiluminescence system according to the manufacturer’s instructions (Super-Signal West Dura chemoluminiscence system, Thermo Scientific, IL) after incubation with horseradish peroxidase–conjugated secondary antibody. Optical quantification of the protein bands was performed using the KODAK 1D Image Analysis Software.
Transfection by electroporation.
Transfection was performed by electroporation with Nucleofector from Amaxa Biosystems (Cologne, Germany) using optimized program and solutions recommended by the manufacturer (Cell Line Nucleofector Kit V [VCA-1003]). Cells were grown in T175 bottles, trypsinized, collected by centrifugation (250 × g, 10 min), and resuspended in nucleofector solution at two cell suspensions of 2 × 10⁵ and 1 × 10⁶ cells per 100 μl and 3 μg siRNA were added to cells and samples were transferred into certified cuvettes (Amaxa Biosystems) and transfected by using program U-01. Cells were then seeded on 6-well plates in prewarmed medium, supplemented with 10% fetal calf serum. The next day (24 h posttransfection), transfected cells were exposed to the different spore types or T-2 toxin for 3 h. After exposure, the cells were harvested for Western blotting or stained with Hoechst/PI for evaluation of cell death.
Flow cytometry.
Exposed cells and controls were washed once in PBS, fixed in 1% (wt/vol) paraformaldehyde (PFA) in PBS 15 min on ice, and postfixed in 90% (vol/vol) ice-cold methanol for at least 2 days at −20°C. The cells were then washed two times in 5% (wt/vol) BSA in PBS and incubated with primary antibody, p-Chk2 1:25, cleaved caspase 3 1:200, or the direct-conjugated γH2AX-Fluor Alexa 488 antibody 1:10 in 5% (wt/vol) BSA and 0.2% (vol/vol) Triton X-100 in PBS overnight at 4°C. The cells stained with primary antibody were then rinsed twice in 5% BSA in PBS and incubated with secondary antibody conjugated to Fluor Alexa 488 1:500 (Invitrogen) for 2 h at room temperature in the dark. The cells were then analyzed with an LSRII Flow Cytometer (BD Biosciences), and 10,000 cells were measured. The number of T-2 toxin-exposed cells expressing p-Chk2, cleaved caspases 3, or γH2AX-Fluor Alexa was compared with the number of cells expressing these proteins in the unexposed control group.
Deoxynucleotidyl transferase–mediated fluorrescein-dUTP nick end-labeling.
We used an In Situ Cell Death Detection Kit, TMR red (Roche Diagnostics, GmbH) to label the apoptotic cells and analyzed them by flow cytometry. Cells were washed by PBS, fixed in 1% (wt/vol) PFA on ice for 15 min, and postfixed in 90% (vol/vol) ice-cold methanol for at least two days at −20°C. The cells were then washed once in PBS and incubated with deoxynucleotidyl transferase–mediated fluorrescein-dUTP nick end-labeling (TUNEL) reaction mixture for 60 min at 37°C in a dark and humidified atmosphere. Subsequently, the cells were washed twice in PBS, transferred to tubes, and directly analyzed by flow cytometry. The cells were excited with a blue Argon laser (15 mW) at 488 nm, and the fluorescence was recorded and analyzed.
Comet assay.
The comet assay was performed at alkaline pH. Following exposure, the cells were washed twice in cold PBS and 10,000 cells in 10 μl PBS were resuspended in 75 μl 1% LMPA at 37°C and applied onto glass slides (precoated with 1% NMPA and dried) and covered with cover slips. Two equal gels were made on each slide. The slides were placed at 4°C for 10 min to allow the gel to set. The cover slips were then removed and the slides were immersed in prechilled lysis buffer (2.5M NaCl, 0.1M EDTA, 10mM Tris-HCl, pH 10, and 1% Triton X-100) and incubated at 4°C overnight. After lysis, the slides were washed three times in washing buffer (40mM HEPES, 0.1M KCl, 0.5mM EDTA, and 0.2 mg/ml BSA pH 8) at 4°C for 5 min. One of the two gels at each slide was treated with 50 μl fpg diluted in washing buffer (1:3000) and covered with a cover slip made of parafilm. The other gel on the slide was treated with washing buffer only. The slides were then placed horizontally in a humidity chamber at 37°C for 30 min. After enzyme treatment, the slides were immersed in a cold alkali solution (0.3M NaOH and 1mM EDTA, pH > 13) for 30 min following electrophoresis in a prechilled alkali solution (0.3M NaOH and 1mM EDTA, pH > 13) on 1 V/cm for 30 min and air dried on the bench. The slides were stained with SYBR green (1:10 000) for 10 min and images were visualized under a fluorescence microscope (Olympus BX51; Olympus Europe, Hamburg, Germany) and acquired with an Olympus DP70 camera. A minimum of 100 comets on each slide were analyzed using the TriTek CometScore Freeware (www.tritekcorp.com). The differences in tail intensity between fpg-treated cells (total DNA damage) and untreated cells (basic DNA damage) were considered as 8-oxodGuo (oxidative DNA damage).
Detection of ROS.
ROS measurements were performed by means of a dichlorofluorescein assay (Wang and Joseph, 1999). Stock solution of dichlorofluorescin diacetate (DCFH-DA) was dissolved in dimethyl sulfoxide (DMSO) to a final concentration of 100mM. The cells were plated on 6-well plastic dishes and incubated at 37°C in a humidified atmosphere of 5% CO2 in air for 30 min with DCFH-DA added to a final concentration of 5μM. Excess DCFH-DA was removed after 30 min and the cells washed and incubated with buffer containing the specified concentrations of pure satratoxin G, T-2 toxin, or spores. After 30-min exposure, the content of the wells were transferred to vials and the fluorescence of the cells from each well measured by flow cytometry (Cell Lab Quanta SC MPL; Beckman Coulter). The excitation filter was set at 488 nm, and the emission filter was set at 525 nm. The fluorescence from each well was captured, digitized, and stored.
Statistics.
The data were analyzed using Student’s t-test (p < 0.05), Kruskal-Wallis one-way ANOVA (p < 0.05), or ANOVA with all pairwise multiple comparison procedures (Holm-Sidak method) (p < 0.001) to evaluate the difference between groups.
RESULTS
Cell Death in THP-1 Cells after Exposure to Different Spore Isolates and T-2 toxin
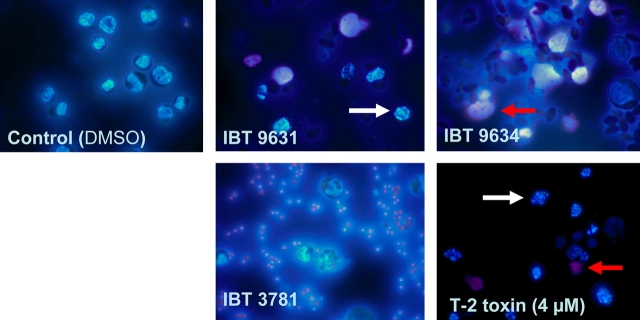
The human THP-1 macrophage cell line was exposed to heat-treated spores from S. chartarum IBT 9631, S. chartarum IBT 9634, A. versicolor IBT 3781, or the model trichothecene T-2 toxin for 6 h. As judged by microscopy, exposure to satratoxin-producing S. chartarum IBT 9631 and T-2 resulted in apoptosis, whereas exposure to atranone-producing S. chartarum IBT 9634 and sterigmatocystin-producing A. versicolor IBT 3781 caused mostly necrosis (Fig. 1). Concentration experiments (6 h) showed that assessed by their overall cell death inducing potential, IBT 9631 was most potent, followed by IBT 9634 and IBT 3781 (Fig. 2a).
FIG. 1.
Microscopic view of control (DMSO treated) and spores- or T-2 toxin–treated THP-1 cells. Cells were exposed to S. chartarum IBT 9631, IBT 9634 (both 0.5 × 10⁷ spores/million cells), A. versicolor IBT 3781 (4.0 × 10⁷ spores/million cells), or T-2 toxin (4μM) for 6 h, stained with Hoechst 33342 and PI, and analyzed by fluorescence microscopy. White arrows indicate apoptotic cells and red arrows indicate necrotic cells.
FIG. 2.
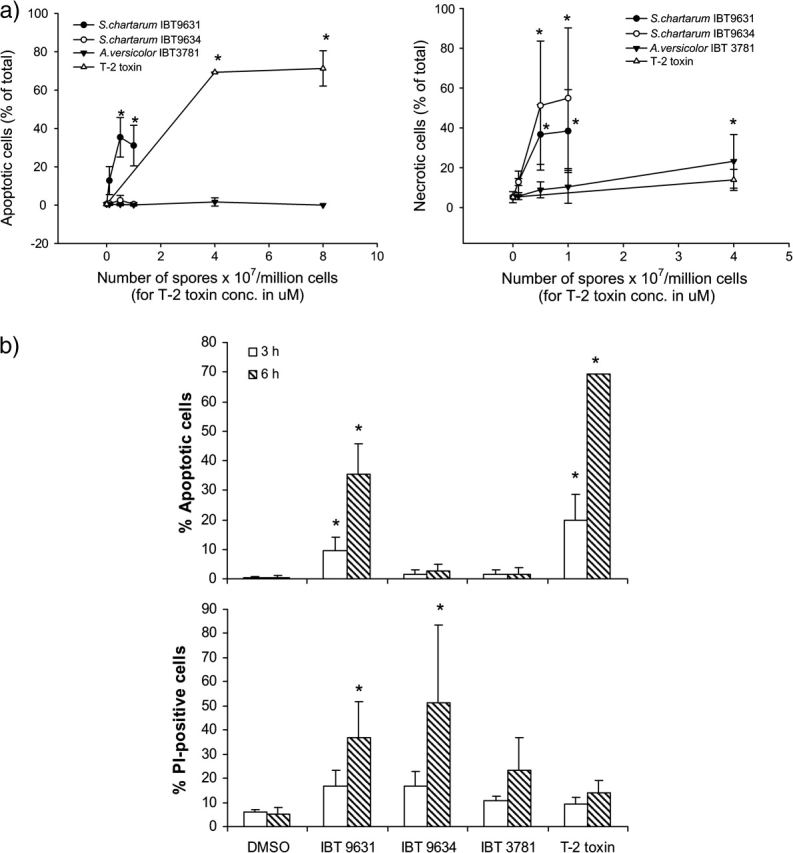
Cell death induced by spores or T-2 toxin treatment. (a) Concentration-dependent changes in apoptosis and necrosis in THP-1 cells after exposure to spores or T-2 toxin for 6 h. Cells were stained with Hoechst 33342 and PI and analyzed by fluorescence microscopy. Results are shown as percent apoptotic or necrotic cells of total cell number. Values represent mean ± SD of at least n = 3 experiments. *Statistical difference from control (p < 0.05). (b) Increased apoptosis and necrosis in THP-1 cells after exposure to spores or T-2 toxin for 3 and 6 h. The concentrations of spores were 0.5 × 10⁷ spores/million cells (S. chartarum IBT 9631 and IBT 9634) or 4.0 × 10⁷ spores/million cells (A. versicolor IBT 3781), whereas the toxin concentration was 4μM. Cells were stained with Hoechst 33342 and PI and analyzed by fluorescence microscopy. Results are shown as percent apoptotic or necrotic cells of total cell number. Values represent mean ± SD of at least n = 3 experiments. *Statistical difference from control (p < 0.05).
Based on the data from the concentration experiments, time course experiments were conducted on cells exposed to 0.5 × 10⁷ spores/million cells (IBT 9631 and 9634), 4.0 × 10⁷ spores/million cells (IBT 3781), or to 4μM T-2 toxin for 3 and 6 h. The results are shown in Figure 2b. IBT 9631 and T-2 toxin caused the highest levels of apoptosis at both exposure times, and the increase was significantly higher after 6 h compared to 3 h. Thus, the apoptotic process induced by IBT 9631 spores and T-2 toxin was rapid and completed within 3–6 h.
Induction of Apoptosis by S. chartarum IBT 9631 Spores and T-2 toxin
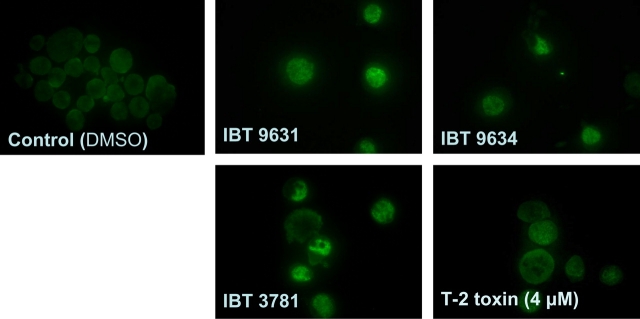
To further characterize and verify the induction of apoptosis, cells were assessed for the activation of various biochemical markers. Activation of caspase 3 is often found to be central in the apoptotic process and known to mediate cleavage of PARP and activate DNA endonucleases resulting in DNA fragmentation that can be detected by the TUNEL assay. Immunocytochemistry using specific antibody toward cleaved PARP showed that exposure of THP-1 cells to either the satratoxin G–containing IBT 9631 spores or the T-2-toxin led to an increased number of cells with a higher fluorescence after both 3 and 6 h (Fig. 3a). In contrast, less changes were seen in the spores from the other Stachybotrys strain, IBT 9634. Flow cytometry revealed that exposure to T-2 toxin led to DNA fragmentation as measured by the TUNEL assay as exposure resulted in a time-dependent right shift in fluorescence. A similar right shift was seen using an antibody toward the active form of caspase 3 (Figs. 3b and 3c). These results support our suggestion that the apoptotic cells characterized by microscopic examination after Hoechst staining are rather classic apoptotic cells.
FIG. 3.
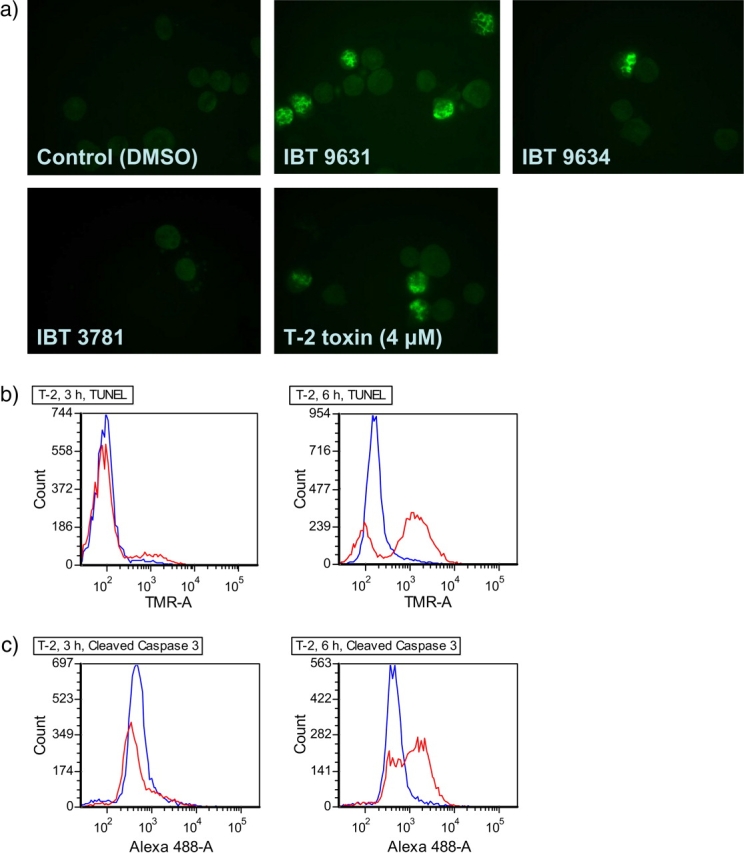
Apoptosis induced by spores or T-2 toxin treatment. (a) Apoptosis induced by S. chartarum IBT 9631 measured by immunofluorescence. The concentrations of spores were 0.5 × 10⁷ spores/million cells (S. chartarum IBT 9631 and IBT 9634) or 4.0 × 10⁷ spores/million cells (A. versicolor IBT 3781), whereas the toxin concentration was 4μM. Pictures of cells stained with antibodies against the apoptotic marker cleaved PARP after exposure for 3 h. (b) Apoptosis induced by T-2 toxin (4μM) measured by TUNEL assay after 3 and 6 h exposure. Blue lines represent control cells (DMSO treated) and red lines represent toxin-exposed cells. Increase in TMR intensity indicates increased levels of free 3′ OH ends in DNA, resulting from apoptotic DNA strand breaks. (c) Apoptosis induced by T-2 toxin (4μM) measured by flow cytometry analysis of cells stained with antibodies against the apoptotic marker cleaved caspase 3 after 3 and 6 h exposure. Blue lines represent control cells (DMSO treated) and red lines represent toxin-exposed cells. Increase in Alexa 488 intensity indicates increased levels of cleaved caspase 3 in the cells.
Effects of Exposure to Different Spore Isolates and T-2-toxin on Phosphorylation of PKR
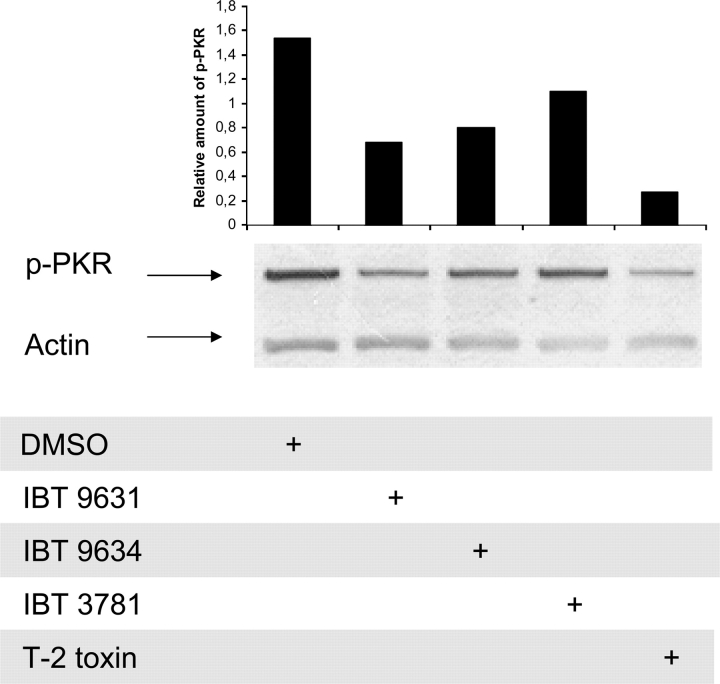
Based on data indicating involvement of PKR activation in apoptosis after exposure to some mycotoxins, we wanted to explore if this was the case in the response to our spore isolates and T-2 toxin. Thus, we examined the activation of PKR by Western blotting after 3-h exposure. The results showed reduced activation of PKR after exposure to IBT 9631 spores or T-2 toxin (Fig. 4). Furthermore, no phosphorylation of PKR following exposure to spores or toxin was detected at the early time points investigated (10- and 30-min exposure) (data not shown).
FIG. 4.
Reduced PKR activation in THP-1 cells after exposure to either spores or T-2 toxin. THP-1 cells were exposed to 0.5 × 10⁷ spores/million cells (S. chartarum IBT 9631 and IBT 9634), 4.0 × 10⁷ spores/million cells (A. versicolor IBT 3781), or 4μM T-2 toxin for 3 h. PKR expression was analyzed by Western blotting. To determine the total amount of protein, blots were stripped and reprobed with anti-actin polyclonal antibody. The blots were quantified and the relationship between phosphorylated PKR protein and total protein is shown as horizontal bars on top of the figure.
Oxidative DNA Damage in THP-1 Cells Exposed to Different Spore Isolates and T-2 toxin
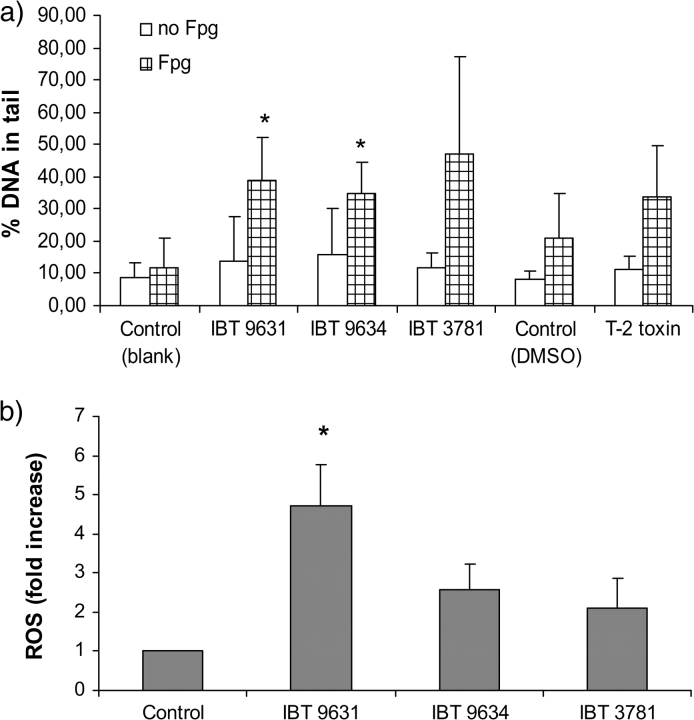
When comet assay was used to detect DNA damage forming single-stranded DNA breaks (SSB) (Collins et al., 2008), none of the exposures resulted in any increased DNA damage measured by an increased tail moment. After the addition of fpg, an enzyme that converts 8-oxo-7,8-dihydro-2′-guanosine (8-oxodGuo) to SSB, an increase in tail moment could be seen after all spore exposures (Fig. 5a), although this increase was significant only after IBT 9631 and IBT 9634 exposure. Compared to its respective control with DMSO, no significant increase in tail moment was seen after exposure to T-2 toxin.
FIG. 5.
DNA damage and ROS formation after exposure to spores or T-2 toxin. (a) Single-cell gel electrophoresis analysis (comet assay) of cells exposed to 0.5 × 10⁷ spores/million cells (S. chartarum IBT 9631 and IBT 9634), 4.0 × 10⁷ spores/million cells (A. versicolor IBT 3781), or 4μM T-2 toxin for 3 h. The data show DNA damage measured as percent DNA in tail of ± fpg enzyme–treated cells. Values represent mean ± SD of n = 4 experiments. *Statistical difference from respective control (p < 0.05). (b) THP-1 cells were exposed to 0.5 × 10⁷ spores/million cells (S. chartarum IBT 9631 and IBT 9634) or 4.0 × 10⁷ spores/million cells (A. versicolor IBT 3781) for 30 min. ROS formation was analyzed by flow cytometry. Results are shown as fold increase over control. Values represent mean ± SD of n = 3 experiments. *Statistical difference from control (p < 0.05).
ROS induce oxidative damage of DNA, including strand breaks and base and nucleotide modifications. Oxidative modification induces a repair response, characterized by excision of modified bases and nucleotides. Double-stranded DNA breaks activate DNA repair enzymes, including ATM and ATR. Using the fluorochrome DCFH-DA and flow cytometry, we found that all spore types seemed able to increase ROS formation (Fig. 5b). The highest increase (and only one significantly higher than control) was seen after exposure to the IBT 9631 spores. No increased ROS formation was detected after exposure to T-2 toxin alone (data not shown).
Effect of Ascorbic Acid (Vitamin C) on Cell Death
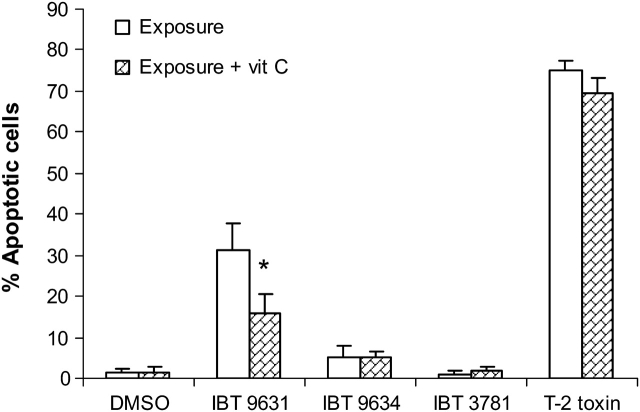
To elucidate the effect of ROS formation on cell death, we pretreated the cells with vitamin C (0.3mM) for 30 min and assessed its impact on apoptotic and necrotic cell death after exposure to spores or T-2 toxin for 6 h. As judged by microscopy, the apoptosis induced by the satratoxin-producing S. chartarum IBT 9631 was significantly reduced in the cells treated with vitamin C (Fig. 6). No effect of vitamin C was detected on cell death in controls or on necrosis.
FIG. 6.
Effects of preincubation with vitamin C on spore- or T-2 toxin–induced apoptosis. THP-1 cells were preincubated for 30 min with vitamin C before exposure to spores or T-2 toxin for 6 h. The concentrations of spores were 0.5 × 10⁷ spores/million cells (S. chartarum IBT 9631 and IBT 9634) or 4.0 × 10⁷ spores/million cells (A. versicolor IBT 3781), whereas the toxin concentration was 4μM. Cells were stained with Hoechst 33342 and analyzed by fluorescence microscopy. Results are shown as percent apoptotic cells of total cell number. Values represent mean ± SD of n = 3 parallels in one experiment. *Significant reduction in apoptosis in vitamin C–treated IBT 9631 group compared to IBT 9631 treatment only (p < 0.05).
Effects of Exposure to Different Spore Isolates and T-2 Toxin on ATM Phosphorylation
To further explore the involvement of a possible primary DNA damage, we examined the activation of enzymes involved in DNA damage responses after exposure to spores or T-2 toxin. First, we looked at the phosphorylation of ATM, which is suggested to be triggered by DSBs and/or larger chromatin changes. At all investigated exposure times (2 h, shown and 3 h, not shown), all three spore types, as well as T-2 toxin, were able to cause nuclear phosphorylation of ATM, whereas no nuclear ATM phosphorylation was observed in unexposed cells (Fig. 7). No marked differences between the various exposures were seen (data not shown). Furthermore, no changes in phosphorylation of ATR, another enzyme known to be activated by DNA damage, were observed.
FIG. 7.
Phosphorylation of ATM induced in THP-1 cells after exposure to spores or T-2 toxin. Activation of ATM was analyzed by immunocytochemistry. Cells were stained with a specific antibody against the phosphorylated form of ATM. Cells were exposed to 0.5 × 10⁷ spores/million cells (S. chartarum IBT 9631 and IBT 9634), 4 × 10⁷ spores/million cells (A. versicolor IBT 3781), or 4μM T-2 for 2 h.
Effects of Exposure to Different Spore Isolates and T-2 Toxin on Chk1 and Chk2 Phosphorylation
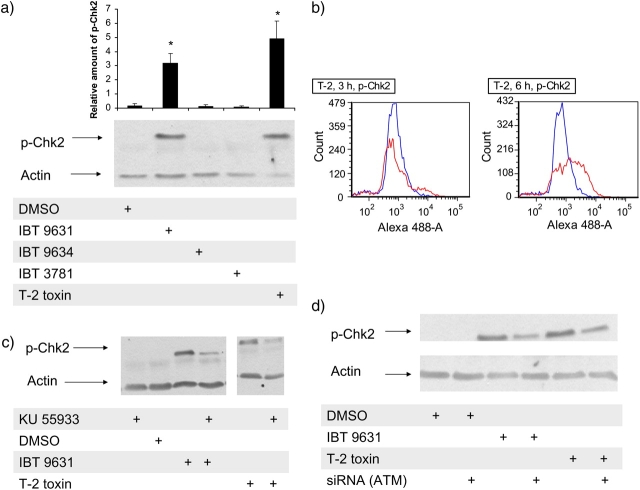
Chk1 and Chk2 are kinases that are involved in cell cycle checkpoint signaling and considered to be triggered by the activation of ATR and ATM, respectively. None of the exposures increased the phosphorylation of Chk1 (data not shown), but exposure of THP-1 cells to either IBT 9631 spores or T-2-toxin increased the phosphorylation of Chk2 (Fig. 8a). In contrast, no changes were seen after exposure to IBT 9634 or IBT 3781 spores. The phosphorylation of Chk2 protein in THP-1 cells after T-2 toxin exposure was confirmed with flow cytometry (Fig. 8b).
FIG. 8.
Phosphorylation of Chk2 induced in THP-1 cells after exposure to spores or T-2 toxin. (a) Cells were exposed to 0.5 × 10⁷ spores/million cells (S. chartarum IBT 9631 and IBT 9634), 4.0 × 10⁷ spores/million cells (A. versicolor IBT 3781), or 4μM T-2 for 3 h. Phosphorylation of Chk2 was analyzed by Western blotting. Blots were washed and reprobed with an anti-actin polyclonal antibody. The blots were quantified and the relationship between the level of Chk2 and actin is shown as horizontal bars on top of the figure. Values represent mean ± SD of n = 3 experiments. *Statistical difference from control (p < 0.05). One representative blot is shown. (b) Phosphorylation of Chk2 analyzed by flow cytometry after exposure of THP-1 cells to 4μM T-2 toxin for 3 and 6 h. Blue lines represent control cells (DMSO treated) and red lines represent toxin-exposed cells. Increase in Alexa 488 intensity indicates presence of phosphorylated Chk2 in the cells. (c) Effects of the ATM inhibitor KU 55933 on spore- or toxin-induced phosphorylation of Chk2. Cells were preincubated with or without inhibitor (5μM) for 1 h, followed by incubation with 0.5 × 10⁷ spores/million cells (S. chartarum IBT 9631) or 4μM T-2 toxin for 3 h. Effects on phosphorylation of Chk2 were analyzed by Western blotting. (d) Effects of siRNA against ATM on spore- or toxin-induced phosphorylation of Chk2. Cells were transfected by electroporation with ATM siRNA before exposure to 0.5 × 10⁷ spores/million cells (S. chartarum IBT 9631) or 4μM T-2 toxin for 3 h. Effects on phosphorylation of Chk2 were analyzed by Western blotting.
Effects of the ATM Inhibitor KU 55933 and ATM siRNA on Spore- and T-2 Toxin–Induced Chk2 Phosphorylation
To ascertain if the increased phosphorylation of Chk2 was mediated through ATM kinase, we pretreated the cells with KU 55933, a chemical inhibitor of this enzyme. Western blots of cell lysates revealed that KU 55933 reduced the increased levels of phosphorylated Chk2 seen after IBT 9631 and T-2 treatments (Fig. 8c).
To gain further insight into the possible upstream role of ATM in phosphorylation of Chk2, we transfected the cells with ATM siRNA before exposure. Western blotting revealed that the transfection reduced the level of phosphorylated Chk2 associated with IBT 9631 or T-2 toxin exposure compared with what was seen with nontransfected cells (Fig. 8d).
Effects of Exposure to Different Spore Isolates and T-2 Toxin on γH2AX Expression
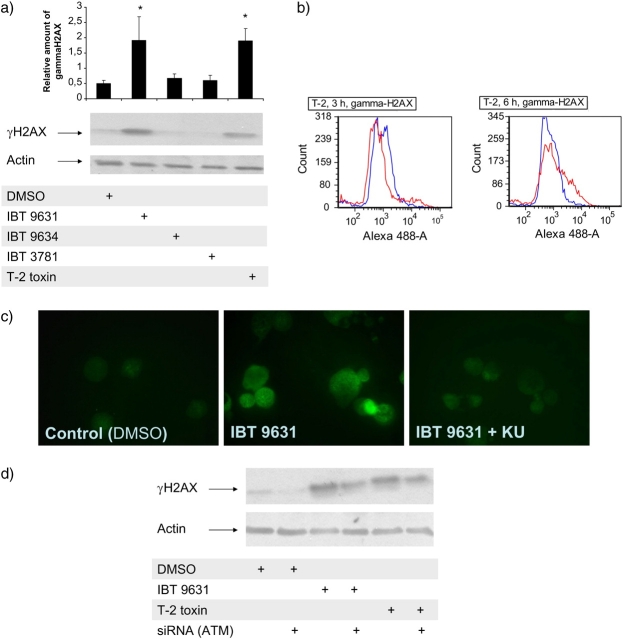
DSBs initiate phosphorylation of H2AX. Thus, the detection of its phosphorylated form, termed γH2AX, is a widely used tool to study the formation and repair of DSBs. Exposure of THP-1 cells to either IBT 9631 spores or T-2 toxin, but not IBT 9634 or IBT 3781 spores, caused increased expression of γH2AX (Fig. 9a) which was confirmed using flow cytometry (Fig. 9b).
FIG. 9.
Phosphorylation of H2AX induced in THP-1 cells after exposure to spores or T-2 toxin. (a) Phosphorylation of H2AX analyzed by Western blotting after exposure to 0.5 × 10⁷ spores/million cells (S. chartarum IBT 9631 and IBT 9634), 4.0 × 10⁷ spores/million cells (A. versicolor IBT 3781), or 4μM T-2 toxin for 3 h. The blots were split in two and the part where γH2AX was expected to localize based on molecular weight was probed with antibody against γH2AX, whereas the other part was probed with anti-actin polyclonal antibody. The blots were quantified and the relationship between the levels of γH2AX and actin is shown as horizontal bars on top of the figure. Values represent mean ± SD of n = 3 experiments. *Statistical difference from control (p < 0.05). One representative blot is shown. (b) Levels of γH2AX analyzed by flow cytometry after exposure of THP-1 cells to 4μM T-2 toxin for 3 and 6 h. Blue lines represent control cells (DMSO treated) and red lines represents toxin-exposed cells. Increase in Alexa 488 intensity indicates presence of γH2AX in the cells. (c) Effects of the ATM inhibitor KU 55933 on spore-induced phosphorylation of H2AX. Cells were preincubated with or without inhibitor (5μM) for 1 h, followed by incubation with 0.5 × 10⁷ spores/million cells (S. chartarum IBT 9631) for 3 h. Effects on presence of γH2AX were analyzed by immunofluorescent staining of the cells. (d) Effects of siRNA against ATM on spore- or toxin-induced phosphorylation of H2AX. Cells were transfected by electroporation with ATM siRNA before exposure to 0.5 × 10⁷ spores/million cells (S. chartarum IBT 9631) or 4μM T-2 toxin for 3 h. Effects on levels of γH2AX were analyzed by Western blotting.
Effects of the ATM Inhibitor KU 55933 and ATM siRNA on Spore- and T-2 Toxin–Induced γH2AX Expression
H2AX is also directly phosphorylated by ATM. To explore any possible role of ATM in the activation of H2AX, we pretreated cells with KU 55933 and exposed them to IBT 9631 spores. The immunocytical staining of γH2AX positive cells showed a reduced number of positive cells when KU 55933 was added compared to the identical exposure group not pretreated with inhibitor (Fig. 9c). Transfection with ATM siRNA prior to exposure reduced the levels of γH2AX associated with IBT 9631 or T-2 toxin exposure compared with what was seen with nontransfected cells (Fig. 9d).
Rapid Effects of Exposure to S. chartarum IBT 9631 on γH2AX and Phospho-p38 Expression
Western blotting revealed that IBT 9631 rapidly activated H2AX, as shown at 15-min exposure time (Fig. 10a). A similar pattern was also seen after 30-min (Fig. 10b) and 60-min exposure (data not shown).
FIG. 10.
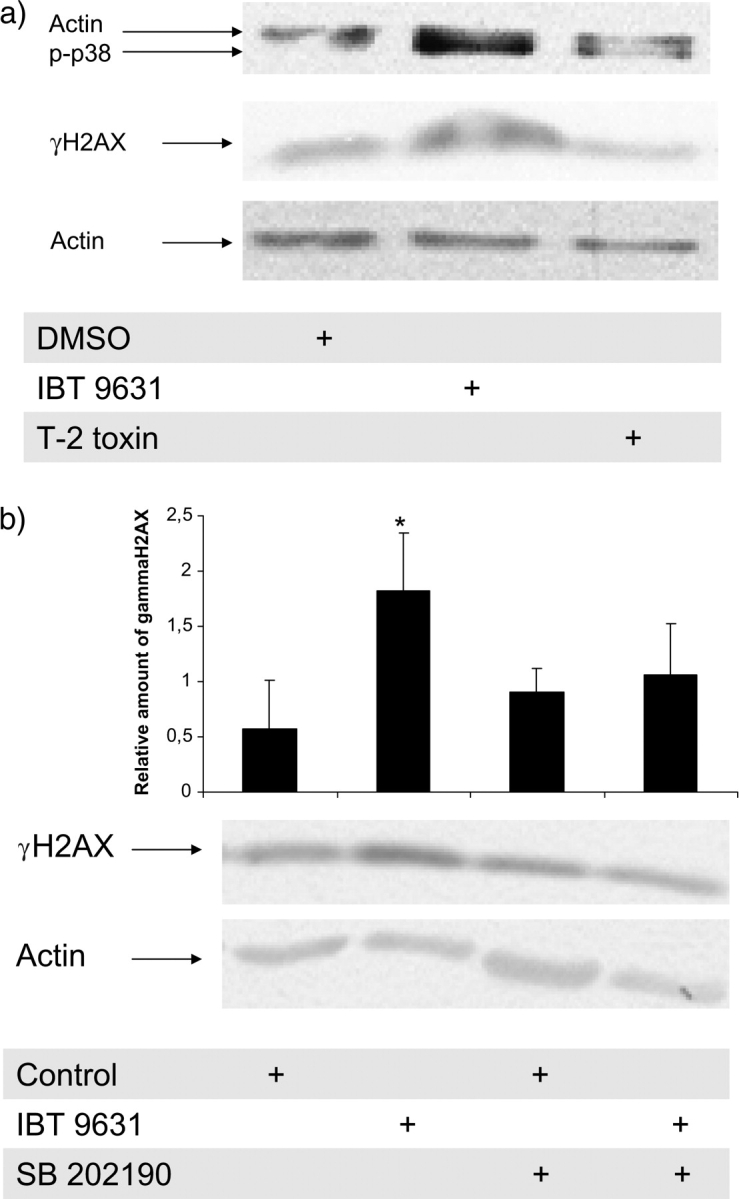
Rapid effects of exposure to S. chartarum IBT 9631 on γH2AX and phospho-p38 expression in THP-1 cells. (a) The activation of H2AX and p38 after 15-min exposure to S. chartarum IBT 9631 (0.5 × 10⁷ spores/million cells) was analyzed by Western blotting. The blot was split in two and the part where γH2AX was expected to localize was probed with antibody against γH2AX, whereas the other part was probed with an anti-actin polyclonal antibody. Next, the part of the blot where actin localized was washed and reprobed with an antibody against phospho-p38. One representative blot is shown. (b) Effect of the p38 inhibitor SB 202190 on S. chartarum IBT 9631–induced activation of H2AX. Cells were preincubated with or without inhibitor (10μM) for 30 min, followed by incubation with 0.5 × 10⁷ spores/million cells (S. chartarum IBT 9631) for 30 min. The blots were quantified and the relationship between γH2AX and actin is shown as horizontal bars on top of the figure. *A significant increase in H2AX activation compared to its respective control. Values represent mean ± SD of n = 3 experiments. One representative blot is shown.
Recent findings have suggested that p38 is able to activate H2AX. To elucidate a role for p38 in our model, we ran the same Western blot (15-min exposure) with an antibody against phosphorylated p38. The results showed that the rapid phosphorylation of H2AX occurred concurrently with p38 activation (Fig. 10a). Furthermore, if the cells were pretreated with the p38 inhibitor SB 202190, S. chartarum IBT 9631 did not induce any significant phosphorylation of H2AX when compared to its respective control, suggesting a link between p38 activation and activation of H2AX (Fig. 10b).
Z-VAD-FMK Treatment and Effect on γH2AX after Exposure to either S. chartarum IBT 9631 or T-2 Toxin for 3 h
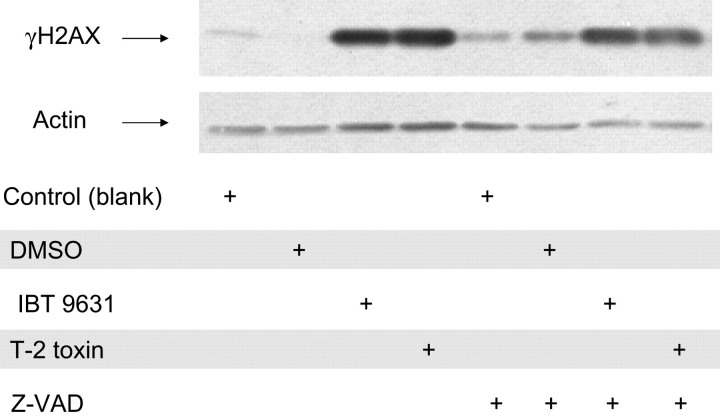
To elucidate the effect of caspase activation on H2AX activation, we treated the cells with the broad-spectrum caspase inhibitor Z-VAD-FMK (20μM) and assessed its impact on H2AX activation. Cells were treated with the inhibitor 30 min before exposure. The results indicated no substantial reduction in H2AX activation (Fig. 11).
FIG. 11.
Lack of effect of caspase inhibitor on γH2AX expression. The effect of the broad-spectrum caspase inhibitor Z-VAD-FMK on γH2AX expression was analyzed by Western blotting. Cells were preincubated with or without inhibitor (20μM) for 30 min, followed by exposure to either S. chartarum IBT 9631 (0.5 × 10⁷ spores/million cells) or T-2 toxin (4μM) for 3 h.
Effects of Exposure to Different Spore Isolates and T-2 Toxin on AIF
AIF and endoG are often found to be translocated from the mitochondria to the nucleus where they have been suggested to participate in larger DNA fragmentation resulting in partial nuclear chromatin condensation. To examine if the activation of Chk2 and H2AX was related to a translocation of these enzymes, the cells were stained for AIF and endoG and examined after 3-h exposure. No significant changes in the staining pattern for AIF or endoG were found for any of the exposure groups (data not shown), suggesting that they were not the cause of the observed DNA damage signaling.
Effects of Satratoxin G
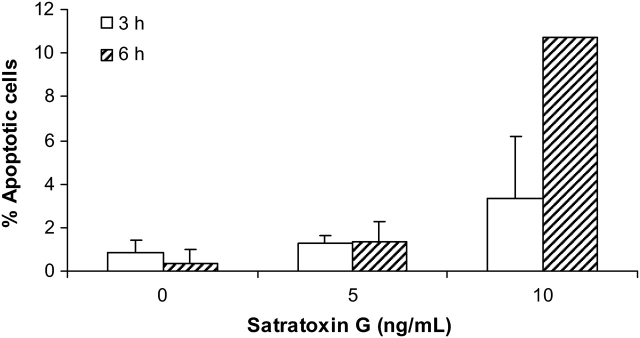
To further verify that satratoxin might be involved in the main effects observed after exposure to IBT 9631 spores, we exposed the cells to satratoxin G for 3 or 6 h and at different concentrations and assayed the apoptotic response by fluorescence microscopy. The results showed a modest apoptotic response at 3 h, whereas robust apoptosis was detected after 6 h at 10 ng/ml (Fig. 12). This effect increased with higher concentrations (data not shown).
FIG. 12.
Apoptosis induced by satratoxin G treatment. Increased apoptosis in THP-1 cells after exposure to two different concentrations of satratoxin G for 3 and 6 h. Cells were stained with Hoechst 33342 and analyzed by fluorescence microscopy. Results are shown as percent apoptotic cells of total cell number. Values represent mean ± SD of n = 3 experiments (except for 10 ng/ml, where n = 2).
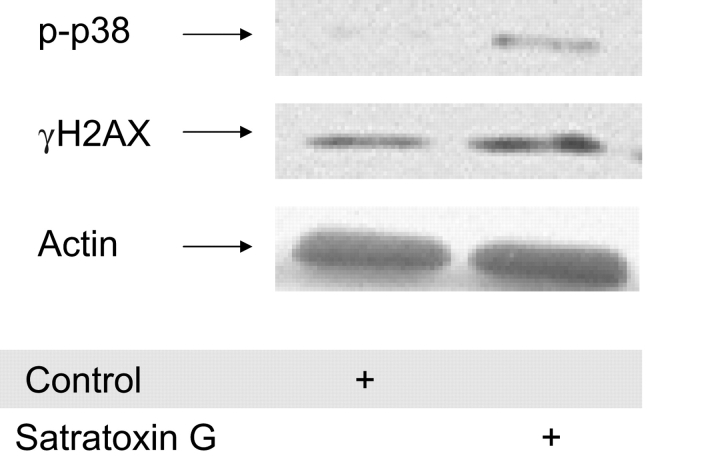
Next, we determined whether satratoxin G was able to give a similar rapid DNA damage response as that observed after IBT 9631 spore exposures. The results demonstrated that satratoxin G at a concentration of 10 ng/ml activated H2AX as well as p38 within 15 min (Fig. 13). This activation of H2AX was also observed after 30-min, 1-h, and 3-h exposure times (data not shown). Finally, we investigated whether exposure to satratoxin G was able to induce ROS formation. However, no significant increased ROS formation was detected by flow cytometry at the time point tested (1 h, data not shown).
FIG. 13.
Rapid effects of exposure to satratoxin G on phospho-p38 and γH2AX expression in THP-1 cells. The activation of p38 and H2AX after 15-min exposure to satratoxin G (10 ng/ml) was analyzed by Western blotting. The blot was split in two and the part where phospho-p38 was expected to localize was probed with antibody against phospho-p38, whereas the other part was probed with an antibody against γH2AX. Next, the part of the blot where phospho-p38 localized was washed and reprobed with anti-actin polyclonal antibody.
DISCUSSION
Stachybotrys chartarum are known to produce several macrocyclic trichothecenes, with satratoxins regarded as the most important. Also, other mycotoxins may be produced but with less characterized biological activity. There is considerable variation among isolates of S. chartarum in the production of mycotoxins and other metabolites, and two chemotypes of the fungus, the atranone and the macrocyclic trichothecene producers, have been proposed. The present study demonstrates that some of the adverse effects of S. chartarum spores in mononuclear phagocytes are associated with the presence of trichothecene mycotoxins. Based on the early DNA damage response after exposure to S. chartarum IBT 9631 spores or the two trichothecenes employed here, DNA damage is likely to be one of the triggering mechanisms involved in the toxic response. In addition, activation of the MAPK p38 appears to be another important early event in the apoptotic process.
The IBT 9631 isolate employed here was found to produce the macrocyclic trichothecene satratoxin G at a concentration of ∼3 × 10⁻⁸ μg satratoxin G/spore. This is in accordance with concentrations previously reported by others (Kelman et al., 2004). IBT 9634 preparations were likely to contain atranone based on data from the supplier (no quantification given). When the THP-1 cells were exposed to the spores from S. chartarum, IBT 9631 and IBT 9634, having the same size and morphology but having different chemotype mycotoxins, we observed different types of cell death. Specifically, the satratoxin G–producing IBT 9631 strain induced both apoptosis and necrosis, whereas the atranone-producing IBT 9634 strain induced necrosis only. These findings are in line with previous findings in other cell lines (RAW 264.7 murine macrophages, PC-12 murine neuronal cells, and human leukemia HL-60 cells), showing that satratoxin G induces apoptosis (Bae et al., 2009; Nagase et al., 2002). Consistent with these findings, the model trichothecene T-2 toxin also rapidly induced high levels of apoptosis in THP-1 cells, which is in accordance with other observations (Bouaziz et al., 2009). Based on an overall evaluation of the different potency and response pattern obtained by the various exposures, as well as previous studies (Pestka et al., 2008), our findings support the contention that toxic effects of S. chartarum spores result in part from the type and amount of associated mycotoxins. The most important seems to be the highly toxic satratoxins, which also were detected in the present study. This suggestion is further supported by our additional experiments showing that pure satratoxin G induced similar responses as observed with IBT 9631. However, this does not exclude the possibility that other mycotoxins or spore components as well as the spores as particles may be involved in our observed responses. Interestingly, it has been reported that mold/spores including S. chartarum sequester different proteinases, which ordinarily may have an impact on exposed cells (Yike et al., 2007). This could be important in an in vivo situation, but is not likely to occur in our system, as heat treatment of the spores reduces the activity of these proteinases.
Apoptosis following exposure to the spores with mycotoxin or T-2 toxin was rapid and based on morphological examination, completed by 3–6 h. A similar fast apoptotic process after exposure to mycotoxins has also previously been reported (Fujii et al., 2003; Holme et al., 2003; Nagase et al., 2002). By comparison, no increase in the amount of apoptotic cells is observed after exposure to chemicals such as polycyclic aromatic hydrocarbons before 18–24 h (Holme et al., 2007; Solhaug et al., 2004) or in some experimental systems not before 48–72 h (Huc et al., 2006). Nevertheless, apoptosis induced by satratoxin-producing IBT 9631 and T-2 toxin was conventional based on activation of caspase 3, cleavage of PARP, DNA fragmentation and condensation, and fragmentation of nuclei.
Various suggestions to how satratoxin G triggers apoptosis have been reported, indicating that mechanisms might vary by cell type. The apoptotic process in HL-60 human leukemia cells seems to involve activation of caspase 8 and triggering of the mitochondrial pathway involving cytosolic accumulation of cytochrome c and activation of caspase 9 (Nagase et al., 2002). Similarly, T-2 toxin has also been reported to induce apoptosis through a caspase-dependent pathway involving the mitochondria, both in HL-60 cells (Holme et al., 2003) and in human hepatoma HepG2 cells (Nagase et al., 2001; Bouaziz et al., 2008). However, other possibilities exist. Recently, satratoxin G was found to induce apoptosis in murine PC-12 neuronal cells via a caspase-independent pathway apparently involving AIF (Islam et al., 2008). This process was mediated by PKR and possibly triggered by interaction with the ribosomes. In line with this, previous studies have reported that another trichothecene, DON, also activates PKR (Zhou et al., 2003). Furthermore, the use of specific inhibitors and siRNA suggested that PKR plays a central role in DON-induced gene expression. Specifically, PKR appears to mediate MAPK activation and apoptosis following ribotoxic stress initiated by the trichothecene. In contrast, we did not find PKR to have a major role in the IBT 9631– and T-2 toxin–mediated toxic response in the THP-1 cell line. Exposure to both IBT 9631 and T-2 toxin rather reduced the phosphorylation of PKR at the time points examined (3 h shown, as well as 10 and 30 min, data not shown). Furthermore, the addition of its inhibitor (tested at several concentrations) did not reduce the satratoxin G–containing spore- and T-2 toxin–induced effects, including phosphorylation of H2AX, and rather increased their apoptotic effects (data not shown).
A possible explanation for the above findings could be that the PKR pathway described after DON exposure is reported to involve p53, which is not expressed in THP-1 cells (Sugimoto et al., 1992). In accordance with our findings, however, a recent study reported that PKR seems to increase the protein expression level and phosphorylation of Bcl-2 and plays an antiapoptotic role in human hepatocellular carcinoma cells (HepG2) (Yang and Chan, 2009). Such a mechanism where inhibition of PKR decreases Bcl-2 phosphorylation and induces apoptosis would be in line with our findings. Furthermore, in this model, c-Jun N-terminal kinase (JNK) was suggested to be involved. This is also in agreement with our findings that inhibition of JNK (data not shown) reduced IBT 9631–induced apoptosis at 3-h exposure. Interestingly, Islam et al. (2008) reported that an inhibition of PKR also reduced satratoxin G–induced expression of AIF and its translocation to the nucleus. Thus, a lack of p53 function and an inhibition of PKR may explain the lack of AIF translocation in the THP-1 cells after exposure to IBT 9631 in the present study.
A number of studies have suggested that mycotoxins may induce DNA damage. Previous studies have indicated that some mycotoxins may interact directly with DNA. Interestingly, macrocyclic trichothecenes have epoxides in their chemical structure, similar to the DNA-binding epoxide in the bioactivated aflatoxin B1 (Choy, 1993), indicating their potential as genotoxic agents. Several studies have reported that mycotoxins may cause oxidative DNA damage (Iwahashi et al., 2007; Wang and Groopman, 1999). Furthermore, methanol extracts of a trichothecene-producing strain of S. chartarum were found to increase the amount of single-stand DNA breaks as measured by the alkaline comet assay (Wang and Yadav, 2006). In the present study, we found that the Stachybotrys spores gave a significant effect in the comet assay after addition of fpg, giving support for the presence of induced oxidative DNA damage. An increase, although not significant, was also observed with the Aspergillus spores. The somewhat variable responses observed may be due to handling and/or aging of the spores as the trichothecene-epoxides may bind to SH-groups on proteins. However, we show that vitamin C significantly reduced the IBT 9631–induced apoptosis, supporting that oxidative damage was inflicted at least by this spore type. By flow cytometry, we were also able to show that all spore types caused increased ROS formation, with IBT 9631 being clearly the most potent. This is in agreement with the overall ATM activation that we observe after spore exposure. Although no ROS formation was observed after exposure to the pure toxins in this study, there are studies that have reported this (Chaudhari et al., 2009; Wang and Yadav, 2006).
Interestingly, previous studies have shown that satratoxin G may increase the number of micronuclei, which are often related to increased levels of DSBs. The possibility that various mycotoxins may induce DSBs is to some extent supported by our results showing that all spore and T-2 toxin exposures induced some ATM activation and that the satratoxin G–producing IBT 9631 spores and T-2 toxin caused a specific activation of the checkpoint proteins Chk2 and H2AX. Additional experiments demonstrated a similar activation of H2AX after exposure to pure satratoxin G, supporting that this toxin is an important contributor to the IBT 9631 spore response. Several studies have identified ATM kinase as a major sensor of DSBs (Efeyan and Serrano, 2007; Ljungman, 2005). Similarly, Chk2 and H2AX have also commonly been found to be activated by DSBs. However, it should be noted that γH2AX also can be induced by DNA lesions other than DSBs, i.e., intermediates in repair of other DNA damage as well as DSBs formed during DNA replication (Chadwick and Lane, 2005; Marti et al., 2006; Smart et al., 2008). When activation of ATM and H2AX is induced by formation of DSB, the activated ATM is localized in individual discrete foci as assessed by immunocytochemistry (Rogakou et al., 1999). In contrast, ATM and H2AX activation triggered by other DNA lesions or chromatin alterations induces a diffusely scattered staining pattern throughout the nucleoplasm (Bakkenist and Kastan, 2003; Kitagawa and Kastan, 2005; Tanaka et al., 2007b). Our immunocytochemical results rather show the presence of such diffuse staining, leaving the possibility that the activation of DNA damage proteins we see is caused by DNA damage other than DSBs. Overall, the results regarding the DNA damage response pattern induced suggest that the satratoxin G–producing IBT 9631 spores induce different type of DNA damage compared to the atranone-producing IBT 9634. Still it seems as the spores induce ROS formation and oxidative DNA damage by acting as particles and hence independent of the associated mycotoxins.
It is notable that the S. chartarum IBT 9634 and A. versicolor IBT 3781 strains did not induce Chk2/H2AX phosphorylation and mostly resulted in necrosis. In contrast, exposure to IBT 9631 and T-2 resulted in Chk2/H2AX phosphorylation and apoptotic cell death, suggesting that Chk2/H2AX activation could be an important mechanism for initiation of apoptosis. Also, a reduced phosphorylation of both Chk2 and H2AX following treatments with inhibitors and siRNA toward ATM indicates that ATM was involved in the activation of these enzymes but that the activation of ATM per se was not sufficient for further activation of downstream DNA damage response proteins. In this context, it is worth noting that phosphorylation of ATM on serine 1981 does not necessarily indicate that downstream targets will be phosphorylated in an ATM-dependent manner (Kurz and Lees-Miller, 2004).
To understand whether H2AX phosphorylation is triggered by a primary DNA damage or is merely a reflection of DNA fragmentation during apoptosis, it is critical to distinguish these two outcomes (Tanaka et al., 2007a). The H2AX activation was observed at a very early time point after exposure to IBT 9631 (15 and 30 min), whereas activation of caspase 3 was observed much later (3–6 h). Interestingly, the same rapid activation of H2AX was observed after exposure to pure satratoxin G. This supports the notion that spores with satratoxin G as well as pure satratoxin G induced a DNA damage response directly and not as a secondary response to stalled DNA repair or replication, far less as a secondary response to DNA cleavage occurring during apoptosis. This notion is also supported by the observed lack of Chk1 and ATR activation, the latter being regarded as a main sensor of stalled replication forks and DNA adduct formation. It is also interesting to note that a recent report shows that the mycotoxin alternariol may act as a topoisomerase toxin, thereby resulting in DSBs. This could be an interesting mechanistic possibility also for satratoxin G and T-2 toxin that should be explored, although the present γH2AX response may seem too fast to make this a likely explanation (Fehr et al., 2009).
Our results suggest that the downstream activation of Chk2 and H2AX by ATM may require the activity of additional kinases. Previous results have indicated that a DON-induced activation of p53 was depending on an early phosphorylation of p38 (Zhou et al., 2005a), suggesting that p38 could be needed for a direct phosphorylation of p53 or possibly act on upstream activators of p53. Such an upstream signal could include Chk2. With regard to H2AX, it has been reported by Lu et al. (2006) that JNK can phosphorylate H2AX and suggested a role for this event in response to UVA radiation. However, in the present study, we did not see an increased early activation of JNK, suggesting no role for JNK in the rapid activation of H2AX observed after exposure to IBT 9631. A more plausible candidate is therefore the p38 MAPK pathway, which is reported to be activated after various responses to environmental stress, including DSBs (Zarubin and Han, 2005). Interestingly, a recent study reported that serum starvation–induced H2AX phosphorylation was dependent on p38 (Lu et al., 2008), and a novel signaling pathway (p38/H2AX) to regulate apoptosis was proposed. Accordingly, we found rapid and concomitant activation of both p38 and H2AX short time after exposure to IBT 9631.
A similar activation of p38 was seen after exposure to satratoxin G and somewhat weaker after exposure to T-2 toxin at the same early time point (15 min). Furthermore, an inhibition of p38 before exposure to IBT 9631 reduced the activation of H2AX, suggesting that p38 partly was involved in the phosphorylation of H2AX. Trichothecene-induced apoptosis has previously been reported to involve activation of p38, as well as JNK and extracellular signal-regulated kinase (Wang and Yadav, 2006; Yang et al., 2000; Zhou et al., 2005b). Other studies have demonstrated that inhibition of p38 MAPK activity with the p38-specific inhibitor SB203580 had no effect on satratoxin G–induced apoptosis, whereas it moderately inhibited apoptosis induced by the trichothecene vomitoxin (Yang et al., 2000). Thus, the role of p38 in trichothecene-induced apoptosis seems to vary somewhat depending on the mycotoxin and model used.
A pivotal question is what activates the early p38 phosphorylation that we observe. One possibility could be that satratoxin G–induced DSBs or a similar event could activate caspase 2. Interestingly, it has been shown that caspase 2 in complex with TRAF2 and RIP1 is capable of activating p38 MAPK through the caspase recruitment domain of caspase 2, independently of its proteolytic activity (Lamkanfi et al., 2005). Taken that this caspase is involved, its independence of proteolytic activity may explain why we did not find the caspase inhibitor to have a profound effect on H2AX activation. However, the lack of effect of the inhibitor does not exclude the possibility of the presence of a two-stage activation of H2AX, a rapid one involving activation by p38 and a later one induced by secondary DNA fragmentation occurring during apoptosis.
In conclusion, while all spores induced ROS formation and oxidative DNA damage by acting as particles, it seems that the observed differences in cell death patterns after exposure to different spore isolates are likely to be primarily due to the types of mycotoxins that the spores produce. Our results further show that spores containing satratoxin G as well as satratoxin G and T-2 toxin without spores may induce a DNA damage response that involves activation of the ATM/H2AX/Chk2 pathway. The process, which seems to be regulated by the p38 MAPK, is suggested to be important in the caspase-dependent apoptosis triggered by these agents.
FUNDING
Research Council of Norway (153875/310 to R.B.); U.S. Public Health Service Grant (ES03553 to J.J.P.).
References
- Bae HK, Shinozuka J, Islam Z, Pestka JJ. Satratoxin G interaction with 40 S and 60 S ribosomal subunits precedes apoptosis in the macrophage. Toxicol. Appl. Pharmacol. 2009;237:137–145. doi: 10.1016/j.taap.2009.03.006. [DOI] [PMC free article] [PubMed] [Google Scholar]
- Bakkenist CJ, Kastan MB. DNA damage activates ATM through intermolecular autophosphorylation and dimer dissociation. Nature. 2003;421:499–506. doi: 10.1038/nature01368. [DOI] [PubMed] [Google Scholar]
- Bouaziz C, Martel C, Sharaf el dein O, Abid-Essefi S, Brenner C, Lemaire C, Bacha H. Fusarial toxin-induced toxicity in cultured cells and in isolated mitochondria involves PTPC-dependent activation of the mitochondrial pathway of apoptosis. Toxicol. Sci. 2009;110:363–375. doi: 10.1093/toxsci/kfp117. [DOI] [PubMed] [Google Scholar]
- Bouaziz C, Sharaf ED, El Golli E, Abid-Essefi S, Brenner C, Lemaire C, Bacha H. Different apoptotic pathways induced by zearalenone, T-2 toxin and ochratoxin A in human hepatoma cells. Toxicology. 2008;254:19–28. doi: 10.1016/j.tox.2008.08.020. [DOI] [PubMed] [Google Scholar]
- Burma S, Chen B, Murphy M, Kurimassa A, Chen DJ. ATM phosphorylates histone H2AX in response to DBS. J. Biol. Chem. 2001;276:42462–42467. doi: 10.1074/jbc.C100466200. [DOI] [PubMed] [Google Scholar]
- Chadwick BP, Lane TF. BRCA1 associates with the inactive X chromosome in late Sphase, coupled with transient H2AX phosphorylation. Chromosoma. 2005;114:432–439. doi: 10.1007/s00412-005-0029-1. [DOI] [PubMed] [Google Scholar]
- Chaudhari M, Jayaraj R, Bhaskar AS, Lakshmana Rao PV. Oxidative stress induction by T-2 toxin causes DNA damage and triggers apoptosis via caspase pathway in human cervical cancer cells. Toxicology. 2009;262:153–161. doi: 10.1016/j.tox.2009.06.002. Epub 2009 June 12. [DOI] [PubMed] [Google Scholar]
- Choy WN. A review of the dose–response induction of DNA adducts by aflatoxin B1 and its implications to quantitative cancer-risk assessment. Mutat. Res. 1993;296:181–198. doi: 10.1016/0165-1110(93)90010-k. [DOI] [PubMed] [Google Scholar]
- Chung YJ, Jarvis BB, Tak H, Pestka JJ. Immunochemical assay for satratoxin G and other macrocyclic trichothecenes associated with indoor air contamination by Stachybotrys chartarum. Toxicol. Mech. Meth. 2003;13:247–252. doi: 10.1080/713857196. [DOI] [PubMed] [Google Scholar]
- Cole R, Cox R. Handbook of Toxic Fungal Metabolites. Academic Press, New York; 1981. [Google Scholar]
- Collins AR, Oscoz AA, Brunborg G, Gaivão I, Giovannelli L, Kruszewski M, Smith CC, Stetina R. The comet assay: topical issues. Mutagenesis. 2008;23:143–151. doi: 10.1093/mutage/gem051. [DOI] [PubMed] [Google Scholar]
- Cundliffe E, Davies JE. Inhibition of initiation, elongation, and termination of eukaryotic protein synthesis by trichothecene fungal toxins. Antimicrob. Agents Chemother. 1977;11:491–499. doi: 10.1128/aac.11.3.491. [DOI] [PMC free article] [PubMed] [Google Scholar]
- Efeyan A, Serrano M. p53: guardian of the genome and policeman of the oncogenes. Cell Cycle. 2007;6:1006–1010. doi: 10.4161/cc.6.9.4211. [DOI] [PubMed] [Google Scholar]
- Engelhart S, Loock A, Skutlarek D, Sagunski H, Lommel A, Färber H, Exner M. Occurrence of toxigenic Aspergillus versicolor isolates and sterigmatocystin in carpet dust from damp indoor environments. Appl. Environ. Microbiol. 2002;68:3886–3890. doi: 10.1128/AEM.68.8.3886-3890.2002. [DOI] [PMC free article] [PubMed] [Google Scholar]
- Etzel RA. Mycotoxins. JAMA. 2002;287:425–427. doi: 10.1001/jama.287.4.425. [DOI] [PubMed] [Google Scholar]
- Fehr M, Pahlke G, Fritz1 J, Christensen MO, Boege F, Altemöller M, Podlech J, Marko D. Alternariol acts as a topoisomerase poison, preferentially affecting the IIa isoform. Mol. Nutr. Food Res. 2009;53:441–451. doi: 10.1002/mnfr.200700379. [DOI] [PubMed] [Google Scholar]
- Fujii J, Matsui T, Heatherly DP, Schlegel KH, Lobo PI, Yutsudo T, Ciraolo GM, Morris RM, Obrig T. Rapid apoptosis induced by Shiga toxin in HeLa cells. Infect. Immun. 2003;71:2724–2735. doi: 10.1128/IAI.71.5.2724-2735.2003. [DOI] [PMC free article] [PubMed] [Google Scholar]
- Gerberick GF, Sorenson WG. Toxicity of T-2 toxin, a Fusarium mycotoxin, to alveolar macrophages in vitro. Environ. Res. 1983;32:269–285. doi: 10.1016/0013-9351(83)90111-1. [DOI] [PubMed] [Google Scholar]
- González-Flecha B. Oxidant mechanisms in response to ambient air particles. Mol. Aspects Med. 2004;25:169–182. doi: 10.1016/j.mam.2004.02.017. [DOI] [PubMed] [Google Scholar]
- Gopalakrishnan S, Liu X, Patel DJ. Solution structure of the covalent sterigmatocystin-DNA adduct. Biochemistry. 1992;31:10790–10801. doi: 10.1021/bi00159a021. [DOI] [PubMed] [Google Scholar]
- Green BJ, Schmechel D, Sercombe JK, Tovey ER. Enumeration and detection of aerosolized Aspergillus fumigatus and Penicillium chrysogenum conidia and hyphae using a novel double immunostaining technique. J. Immunol. Methods. 2005;307:127–134. doi: 10.1016/j.jim.2005.10.001. [DOI] [PubMed] [Google Scholar]
- Hardin BD, Kelman BJ, Saxon A. Adverse human health effects associated with molds in the indoor environment. J. Occup. Environ. Med. 2003;45:470–478. doi: 10.1097/00043764-200305000-00006. [DOI] [PubMed] [Google Scholar]
- Holme JA, Gorria M, Arlt VM, Ovrebø S, Solhaug A, Tekpli X, Landvik NE, Huc L, Fardel O, Lagadic-Gossmann D. Different mechanisms involved in apoptosis following exposure to benzo[a]pyrene in F258 and Hepa1c1c7 cells. Chem. Biol. Interact. 2007;167:41–55. doi: 10.1016/j.cbi.2007.01.008. [DOI] [PubMed] [Google Scholar]
- Holme JA, Morrison E, Samuelsen JT, Wiger R, Låg M, Schwarze PE, Bernhoft A, Refsnes M. Mechanisms involved in the induction of apoptosis by T-2 and HT-2 toxins in HL-60 human promyelocytic leukemia cells. Cell Biol. Toxicol. 2003;19:53–68. doi: 10.1023/a:1022069715399. [DOI] [PubMed] [Google Scholar]
- Huc L, Rissel M, Solhaug A, Tekpli X, Gorria M, Torriglia A, Holme JA, Dimanche-Boitrel MT, Lagadic-Gossmann D. Multiple apoptotic pathways induced by p53-dependent acidification in benzo[a]pyrene-exposed hepatic F258 cells. J. Cell. Physiol. 2006;208:527–537. doi: 10.1002/jcp.20686. [DOI] [PubMed] [Google Scholar]
- Islam Z, Hegg CC, Bae HK, Pestka JJ. Satratoxin G-induced apoptosis in PC-12 neuronal cells is mediated by PKR and caspase independent. Toxicol. Sci. 2008;105:42–52. doi: 10.1093/toxsci/kfn110. [DOI] [PMC free article] [PubMed] [Google Scholar]
- Islam Z, Shinozuka J, Harkema JR, Pestka JJ. Purification and comparative neurotoxicity of the trichothecenes satratioxin G and roridin L2 from stachybotrys chartarum. J. Toxicol. Environ. Health A. 2009;72:1242–1251. doi: 10.1080/15287390903129234. [DOI] [PMC free article] [PubMed] [Google Scholar]
- Iwahashi H, Kitagawa E, Suzuki Y, Ueda Y, Ishizawa Y, Nobumasa H, Kuboki Y, Hosoda H, Iwahashi Y. Evaluation of toxicity of the mycotoxin citrinin using yeast ORF DNA microarray and Oligo DNA microarray. BMC Genomics. 2007;8:95. doi: 10.1186/1471-2164-8-95. [DOI] [PMC free article] [PubMed] [Google Scholar]
- Kelman BJ, Robbins CA, Swenson LJ, Hardin BD. Risk from inhaled mycotoxins in indoor office and residential environments. Int. J. Toxicol. 2004;23:3–10. doi: 10.1080/10915810490265423. [DOI] [PubMed] [Google Scholar]
- Kitagawa R, Kastan MB. The ATM-dependent DNA damage signaling pathway. Cold Spring Harb. Symp. Quant. Biol. 2005;70:99–109. doi: 10.1101/sqb.2005.70.002. [DOI] [PubMed] [Google Scholar]
- Kurz EU, Lees-Miller SP. DNA damage-induced activation of ATM and ATM-dependent signaling pathways. DNA Repair. 2004;3:889–900. doi: 10.1016/j.dnarep.2004.03.029. [DOI] [PubMed] [Google Scholar]
- Laemmli UK. Cleavage of structural proteins during the assembly of the head of bacteriophage T4. Nature. 1970;227:680–685. doi: 10.1038/227680a0. [DOI] [PubMed] [Google Scholar]
- Lamkanfi M, D’hondt K, Walle LV, van Gurp M, Denecker G, Demeulemeester J, Kalai M, Declercq W, Saelens X, Vandenabeele P. A novel caspase-2 complex containing TRAF2 and RIP1. J. Biol. Chem. 2005;280:6923–6932. doi: 10.1074/jbc.M411180200. [DOI] [PubMed] [Google Scholar]
- Lee JH, Paull TT. ATM activation by DNA double-strand breaks through the Mre11-Rad50-Nbs1 complex. Science. 2005;308:551–554. doi: 10.1126/science.1108297. [DOI] [PubMed] [Google Scholar]
- Lee JH, Paull TT. Activation and regulation of ATM kinase activity in response to DNA double-strand breaks. Oncogene. 2007;26:7741–7748. doi: 10.1038/sj.onc.1210872. [DOI] [PubMed] [Google Scholar]
- Ljungman M. Activation of DNA damage signaling. Mutat. Res. 2005;577:203–216. doi: 10.1016/j.mrfmmm.2005.02.014. [DOI] [PubMed] [Google Scholar]
- Lu C, Shi Y, Wang Z, Song Z, Zhu M, Cai Q, Chen T. Serum starvation induces H2AX phosphorylation to regulate apoptosis via p38 MAPK pathway. FEBS Lett. 2008;582:2703–2708. doi: 10.1016/j.febslet.2008.06.051. [DOI] [PubMed] [Google Scholar]
- Lu C, Zhu F, Cho YY, Tang F, Zykova T, Ma WY, Bode AM, Dong Z. Cell apoptosis: requirement of H2AX in DNA ladder formation, but not for the activation of caspase-3. Mol. Cell. 2006;23:121–132. doi: 10.1016/j.molcel.2006.05.023. [DOI] [PMC free article] [PubMed] [Google Scholar]
- Marti TM, Hefner E, Feeney L, Natale V, Cleaver JE. H2AX phosphorylation within the G1 phase after UV irradiation depends on nucleotide excision repair and not DNA double-strand breaks. Proc. Natl. Acad. Sci. 2006;103:9891–9896. doi: 10.1073/pnas.0603779103. [DOI] [PMC free article] [PubMed] [Google Scholar]
- Mattson MP, Furukawa K. Anti-apoptotic actions of cycloheximide: blockade of programmed cell death or induction of programmed cell life? Apoptosis. 1997;2:257–264. doi: 10.1023/a:1026433019210. [DOI] [PubMed] [Google Scholar]
- McLaughlin CS, Vaughan MH, Campbell IM, Wei CM, Stafford ME, Hansen BS. Inhibition of protein synthesis by trichothecenes. In: Rodricks JV, Hesseltine CW, Mehlman MA, editors. Mycotoxins in Human and Animal Health. Park Forest South, IL: Pathotox Publications; 1977. pp. 261–284. [Google Scholar]
- Nagase M, Alam MM, Tsushima A, Yoshizawa T, Sakato N. Apoptosis induction by T-2 toxin: activation of caspase-9, caspase-3, and DFF-40/CAD through cytosolic release of cytochrome c in HL-60 cells. Biosci. Biotechnol. Biochem. 2001;65:1741–1747. doi: 10.1271/bbb.65.1741. [DOI] [PubMed] [Google Scholar]
- Nagase M, Shiota T, Tsushima A, Alam MM, Fukuoka S, Yoshizawa T, Sakato N. Molecular mechanism of satratoxin-induced apoptosis in HL-60 cells: activation of caspase-8 and caspase-9 is involved in activation of caspase-3. Immunol. Lett. 2002;84:23–27. doi: 10.1016/s0165-2478(02)00127-x. [DOI] [PubMed] [Google Scholar]
- Nielsen KF, Huttunen K, Hyvarinen A, Andersen B, Jarvis BB, Hirvonen MR. Metabolite profiles of Stachybotrys isolates from water-damaged buildings and their induction of inflammatory mediators and cytotoxicity in macrophages. Mycopathologia. 2002;154:201–205. doi: 10.1023/a:1016383402963. [DOI] [PubMed] [Google Scholar]
- Olmo N, Turnay J, Gonzalez de Buitrago G, Lopez de Silanes I, Gavilanes JG, Lizarbe MA. Cytotoxic mechanism of the ribotoxin alphasarcin. Induction of cell death via apoptosis. Eur. J. Biochem. 2001;268:2113–2123. doi: 10.1046/j.1432-1327.2001.02086.x. [DOI] [PubMed] [Google Scholar]
- Pestka JJ, Yike I, Dearborn DG, Ward MD, Harkema JR. Stachybotrys chartarum, trichothecene mycotoxins, and damp building-related illness: new insights into a public health enigma. Toxicol. Sci. 2008;104:4–26. doi: 10.1093/toxsci/kfm284. [DOI] [PubMed] [Google Scholar]
- Rogakou EP, Boon C, Redon C, Bonner WM. Megabase chromatin domains involved in DNA double-strand breaks in vivo. J. Cell. Biol. 1999;146:905–916. doi: 10.1083/jcb.146.5.905. [DOI] [PMC free article] [PubMed] [Google Scholar]
- Roos WP, Kaina B. DNA damage-induced cell death by apoptosis. Trends Mol. Med. 2006;12:440–450. doi: 10.1016/j.molmed.2006.07.007. [DOI] [PubMed] [Google Scholar]
- Ruotsalainen M, Hirvonen MR, Hyvärinen A, Meklin J, Savolainen K, Nevalainen A. Cytotoxicity, production of reactive oxygen species and cytokines induced by different strains of Stachybotrys sp. from moldy buildings in RAW264.7 macrophages. Environ. Toxicol. Pharmacol. 1998;6:193–199. doi: 10.1016/s1382-6689(98)00034-9. [DOI] [PubMed] [Google Scholar]
- Samson RA, Hoekstra ES, Frisvad JC. Introduction to Food- and Airborne Fungi. 7th ed. Utrecht, The Netherlands: Centraalbureau voor Schimmelcultures; 2004. [Google Scholar]
- Shifrin VI, Anderson P. Trichothecene mycotoxins trigger a ribotoxic stress response that activates c-Jun N-terminal kinase and p38 mitogen activated protein kinase and induces apoptosis. J. Biol. Chem. 1999;274:13985–13992. doi: 10.1074/jbc.274.20.13985. [DOI] [PubMed] [Google Scholar]
- Smart DJ, Halicka HD, Schmuck G, Traganos F, Darzynkiewicz Z, Williams GM. Assessment of DNA double-strand breaks and γH2AX induced by the topoisomerase II poisons etoposide and mitoxantrone. Mutat. Res. 2008;641:43–47. doi: 10.1016/j.mrfmmm.2008.03.005. [DOI] [PMC free article] [PubMed] [Google Scholar]
- Solhaug A, Refsnes M, Låg M, Schwarze PE, Husøy T, Holme JA. Polycyclic aromatic hydrocarbons induce both apoptotic and anti-apoptotic signals in Hepa1c1c7 cells. Carcinogenesis. 2004;25:809–819. doi: 10.1093/carcin/bgh069. [DOI] [PubMed] [Google Scholar]
- Sugimoto K, Toyoshima H, Sakai R, Miyagawa K, Hagiwara K, Ishikawa F, Takaku F, Yazaki Y, Hirai H. Frequent mutations in the p53 gene in human myeloid leukemia cell lines. Blood. 1992;79:2378–2383. [PubMed] [Google Scholar]
- Tanaka T, Huang X, Halicka HD, Zhao H, Traganos F, Albino AP, Dai W, Darzynkiewicz Z. Cytometry of ATM activation and histone H2AX phosphorylation to estimate extent of DNA. Cytometry A. 2007a;71:648–661. doi: 10.1002/cyto.a.20426. [DOI] [PMC free article] [PubMed] [Google Scholar]
- Tanaka T, Huang X, Jorgensen E, Gietl D, Traganos F, Darzynkiewicz Z, Albino AP. ATM activation accompanies histone H2AX phosphorylation in A549 cells upon exposure to tobacco smoke. BMC Cell Biol. 2007b;8:26. doi: 10.1186/1471-2121-8-26. [DOI] [PMC free article] [PubMed] [Google Scholar]
- Towbin H, Staehelin T, Gordon J. Electrophoretic transfer of proteins from polyacrylamide gels to nitrocellulose sheets: procedure and some applications. Proc. Natl. Acad. Sci. U.S.A. 1979;76:4350–4354. doi: 10.1073/pnas.76.9.4350. [DOI] [PMC free article] [PubMed] [Google Scholar]
- Versilovskis A, De Saeger S. Sterigmatocystin: occurrence in foodstuffs and analytical methods—an overview. Mol. Nutr. Food Res. 2010;54:136–147. doi: 10.1002/mnfr.200900345. [DOI] [PubMed] [Google Scholar]
- Wang JS, Groopman JD. DNA damage by mycotoxins. Mutat. Res. 1999;424:167–181. doi: 10.1016/s0027-5107(99)00017-2. [DOI] [PubMed] [Google Scholar]
- Wang H, Joseph JA. Quantifying cellular oxidative stress by dichlorofluorescein assay using microplate reader. Free Radic. Biol. Med. 1999;27:612–616. doi: 10.1016/s0891-5849(99)00107-0. [DOI] [PubMed] [Google Scholar]
- Wang H, Yadav JS. DNA damage, redox changes, and associated stress-inducible signaling events underlying the apoptosis and cytotoxicity in murine alveolar macrophage cell line MH-S by methanol-extracted Stachybotrys chartarum toxins. Toxicol. Appl. Pharmacol. 2006;214:297–308. doi: 10.1016/j.taap.2006.01.002. [DOI] [PubMed] [Google Scholar]
- Yang G-H, Jarvis BB, Chung Y-J, Pestka JJ. Apoptosis induction by the satratoxins and other trichothecene mycotoxins: relationship to ERK, p38 MAPK, and SAPK/JNK activation. Toxicol. Appl. Pharmacol. 2000;164:149–160. doi: 10.1006/taap.1999.8888. [DOI] [PubMed] [Google Scholar]
- Yang X, Chan C. Repression of PKR mediates palmitate-induced apoptosis in HepG2 cells through Bcl-2. Cell Res. 2009;19:469–486. doi: 10.1038/cr.2009.25. [DOI] [PMC free article] [PubMed] [Google Scholar]
- Yike I, Rand T, Dearborn DG. The role of fungal proteinases in pathophysiology of Stachybotrys chartarum. Mycopathologia. 2007;164:171–181. doi: 10.1007/s11046-007-9037-4. Epub 2007 July 3. [DOI] [PubMed] [Google Scholar]
- Zarubin T, Han J. Activation and signaling of the p38 MAP kinase pathway. Cell Res. 2005;15:11–18. doi: 10.1038/sj.cr.7290257. [DOI] [PubMed] [Google Scholar]
- Zhou H-R, Islam Z, Pestka JJ. Induction of competing apoptotic and survival signaling pathways in the macrophage by the ribotoxic trichothecene deoxynivalenol. Toxicol. Sci. 2005a;87:113–122. doi: 10.1093/toxsci/kfi234. [DOI] [PubMed] [Google Scholar]
- Zhou H-R, Jia Q, Pestka JJ. Ribotoxic stress response to the trichothecene deoxynivalenol in the macrophage involves the Src family kinase Hck. Toxicol. Sci. 2005b;85:916–926. doi: 10.1093/toxsci/kfi146. [DOI] [PubMed] [Google Scholar]
- Zhou H-R, Lau AS, Pestka JJ. Role of double-stranded RNA-activated protein kinase R (PKR) in deoxynivalenol-induced ribotoxic stress response. Toxicol. Sci. 2003;74:335–344. doi: 10.1093/toxsci/kfg148. [DOI] [PubMed] [Google Scholar]


