

Abstract
Background. Fibroblast growth factor-23 (FGF-23) is associated with mortality in dialysis patients, and concentrations are elevated in moderate chronic kidney disease (CKD). The threshold of CKD or albuminuria at which FGF-23 begins to change is unknown.
Methods. In 792 outpatients with stable cardiovascular disease (CVD) and normal kidney function to moderate CKD, we evaluate the associations of estimated glomerular filtration rate (eGFR) and albumin-to-creatinine ratio (ACR) with plasma FGF-23 concentrations.
Results. Compared to participants with eGFR ≥90 ml/min/1.73m2, mean FGF-23 concentrations were 7.8 RU/ml higher (4.3–11.5, P = 0.01) in those with eGFR 60–89 ml/min/1.73m2 in models adjusted for age, sex, race, ACR, blood pressure, diabetes and body mass index. More advanced decrements in eGFR were associated with much higher FGF-23 concentrations. In spline analysis, the slope of change in FGF-23 concentration was evident at eGFR <90 ml/min/1.73m2. Compared to participants with ACR <30 mg/g, mean FGF-23 concentrations were 18.4 RU/ml higher (9.3–29.2, P < 0.001) in those with ACR 30–299 mg/g in models adjusted for identical covariates plus eGFR and much higher in individuals with ACR ≥300 mg/g. Spline analysis demonstrated a linear relationship of ACR with FGF-23, independent of eGFR, even among persons with ACR <30 mg/g.
Conclusion. Modest decrements in eGFR or elevations in albuminuria are each independently associated with higher FGF-23 concentrations in outpatients with stable CVD.
Keywords: albuminuria, chronic, fibroblast growth factor-23, kidney disease, osteodystrophy
Introduction
In individuals with chronic kidney disease (CKD), abnormalities in mineral metabolism are important determinants of bone and vascular disease. As kidney function declines, elevated serum intact parathyroid hormone (iPTH) concentrations are frequently the earliest detectable abnormality using conventional measures of mineral metabolism. However, elevated iPTH can be detected at glomerular filtration rate (GFR) levels of approximately <60 ml/min/1.73m2, and alterations in 25 (OH) vitamin D, calcium and phosphorus require even more advanced decrements in GFR [1]. Recent studies have demonstrated that higher iPTH levels and serum phosphorus levels, and lower 25 (OH) and 1,25 (OH)2 vitamin D levels are each associated with cardiovascular disease (CVD) and all-cause mortality in the general population; even among persons with ostensibly normal kidney function [2–5]. These observations have heightened interest in understanding mineral metabolism regulation and its consequences in persons with or without CKD.
Fibroblast growth factor (FGF) 23 is a bone-derived hormone which induces phosphaturia and inhibits conversion of 25 (OH) vitamin D to its active form [6]. Higher FGF-23 levels are associated with mortality in persons with end-stage renal disease (ESRD) [7], and greater left ventricular mass in individuals with moderate to severe CKD [8]. Prior studies have demonstrated that persons with moderate CKD have higher mean FGF-23 levels than healthy controls [9]. And among individuals with CKD stage 3–5, FGF-23 levels and eGFR are inversely correlated [8]. However, the threshold of severity of CKD or albuminuria at which FGF-23 becomes elevated is unknown. We evaluate the cross-sectional associations of GFR estimated by creatinine and cystatin C and albuminuria with plasma FGF-23 levels in outpatients with stable cardiovascular disease and a spectrum of kidney function from normal to moderate CKD.
Materials and methods
Methods inclusion, and exclusion, criteria of the Heart and Soul study have been reported elsewhere [10]. Briefly, outpatients with prevalent coronary artery disease living in the San Francisco bay area were recruited and underwent a day-long study visit where they provided medical history, physical examination and blood and urine specimens. Participants were excluded if they were not able to walk one block, had a myocardial infarction within the past 6 months or were likely to move out of the area within 3 years. There was no exclusion for kidney dysfunction. The study protocol was approved by the Institutional Review Boards of the participating centers, and all participants provided written informed consent. Between 2000 and 2002, 1024 participants enrolled. For the present study, we excluded participants with missing serum cystatin-C (n = 37), or urine albumin-to-creatinine ratio measurements (ACR, n = 195). The remaining 792 individuals all had creatinine and FGF-23 measurements, and constituted the study sample for this analysis.
Serum creatinine was measured by the rate Jaffe method, and was used for estimated GFR (eGFRCr) by its incorporation in the abbreviated (four-variable) Modification of Diet in Renal Disease study equation [11]. Cystatin C was measured using a BNII nephelometre (Dade Behring, Inc., Deerfield, IL). The intra-assay coefficient of variation (CV) was <2.9% and interassay CV was <3.2% [12]. Cystatin C was used to calculate estimated GFR (eGFRCys) using the formula eGFRcys = 76.7 × cystatin C−1.19. This equation has been validated with comparison to iothalamate measured GFR in a pooled cohort of kidney disease studies [13]. Urine albumin and creatinine were measured using nephelometry and the rate Jaffe method, respectively, and ACR was calculated (milligram per gram) [10]. Plasma FGF-23 concentrations were measured using a C-terminal human ELISA (Immunotopics, San Clemente, CA) [14]. Measurements were made in duplicate and averaged. The intra-assay CV was <5.1%; the inter-assay CV was 10.0% at a concentration of 36.4 RU/mL and 12.7% at a level 379 RU/mL.
Graphical methods demonstrated that FGF-23 levels were right-skewed, and FGF-23 levels were therefore natural log-transformed. Spearman correlation coefficients were calculated for the unadjusted associations of eGFRCr, eGFRCys and ACR with FGF-23. Categories of kidney function were defined according to standard clinical cut-points. For eGFRCr and eGFRCys, participants were categorized into three groups (eGFR ≥90, 60–89 and <60). Similarly, subjects were categorized into three groups by ACR (<30, 30–299, and ≥300 mg/g) [15,16]. The highest eGFR category and lowest ACR category served as reference groups in analysis. Linear regression was used to evaluate the association of each kidney function measure with natural log-FGF-23 levels. Subsequently, geometric means were calculated to provide the adjusted mean FGF-23 level for each category of kidney function on the natural scale. All models were adjusted for age, sex, race (black, white, other), systolic blood pressure, diastolic blood pressure, diabetes, and body mass index. Models evaluating eGFRCr and eGFRCys were further adjusted for ACR. The models evaluating ACR were further adjusted for eGFRCys. To explore a threshold of kidney function required to observe differences in plasma FGF-23 levels, we developed cubic B-spline functions using general additive models, adjusted for the same covariates. The extreme 2.5% of kidney function measurements were excluded from spline functions to avoid implausible extrapolations from the extremes of the data distribution. Analyses were conducted using STATA version 11 (Stata Corp., College Station, Texas) and SPlus version 6.1 (Insightful Corp., Seattle, Washington).
Results
The mean age of the 792 study participants was 67 ± 11 years, 18% (n = 143) were female and 16% (n = 123) were African-American. Twenty-eight percent (n = 220) had diabetes mellitus, and 72% (n = 570) had hypertension. Mean eGFRCr was 76 ± 23 ml/min/1.73m2, 54% (n = 417) had eGFRCr <90ml/min/1.73m2, 22% (n = 171) had eGFRCr <60 ml/min/1.73m2 and 2% (n = 12) had eGFR <30ml/min/1.73m2. The latter two categories were combined in subsequent analysis due to low numbers of individuals with eGFR <30 ml/min/1.73m2. Mean eGFRCys was 70 ± 23 ml/min/1.73m2. The median ACR was 10 mg/g (interquartile range 6–20), 14% (n = 110) had microalbuminuria (ACR 30–299 mg/g) and 4% (n = 35) had macroalbuminuria (ACR ≥300mg/g).
The distribution of FGF-23 levels was right-skewed with a median of 43 RU/mL (interquartile range 29–73 RU/ml). The unadjusted Spearman correlations of eGFRCr, eGFRCys and ACR with FGF-23 were of moderate strength (r = −0.32, −0.37 and 0.24, respectively. All P-values <0.001). Table 1 shows the median FGF-23 level by categories cross-classified by eGFRCys and ACR. Individuals with either higher ACR or lower eGFRCys had higher median FGF-23 levels in unadjusted analysis. Results were similar with adjustment for age, sex, race, systolic and diastolic blood pressure, diabetes and body mass index (Table 2). Participants with eGFRCr between 60 and 89 and eGFR <60 had significantly higher FGF-23 levels compared to participants with eGFRCr ≥90ml/min/1.73m2. Results were similar when kidney function was classified using eGFRCys. Compared to participants with ACR <30 mg/g, those with ACR 30–299 mg/g and with ACR >300mg/g also had higher FGF-23 levels in models adjusted for similar covariates and eGFRCys. Results were similar when eGFRCr replaced eGFRCys in this model, and with additional adjustment for calcium and phosphorus levels (data not shown).
Table 1.
Median (interquartile range) FGF-23 levels by kidney function categories
| eGFRcys (ml/min/1.73m2) | |||
|---|---|---|---|
| ≥90 | 60–89 | <60 | |
| Albumin–creatinine ratio (mg/g) | (n = 140) | (n = 391) | (n = 261) |
| <30 (n = 647) | 32.0 (22.6–49.6) | 38.5 (24.8–53.4) | 58.6 (35.7–109.7) |
| ≥30 (n = 145) | 40.2 (23.5–53.1) | 48.0 (34.1–106.6) | 93.6 (46.2–182.0) |
Table 2.
Adjusted association of kidney function and FGF-23
| Kidney function measure | Number (%) | FGF-23 (RU/mL)c | 95% CI | P-value |
|---|---|---|---|---|
| eGFRCr (ml/min/1.73m2)a | ||||
| ≥90 | 192 | 36.0 | 31.6–40.9 | Ref |
| 60–89 | 417 | 43.8 | 40.3–47.5 | 0.01 |
| <60 | 183 | 76.1 | 66.8–86.7 | <0.001 |
| eGFRCys (ml/min/1.73m2)a | ||||
| ≥90 | 140 | 31.9 | 27.6–36.9 | Ref |
| 60–89 | 391 | 39.5 | 36.4–42.9 | 0.01 |
| <60 | 261 | 77.0 | 69.1–85.7 | <0.001 |
| Albumin–creatinine ratio (mg/g)b | ||||
| <30 mg/g | 647 | 44.2 | 41.4–47.1 | Ref |
| 30–299 mg/g | 110 | 62.6 | 53.3–73.4 | <0.001 |
| ≥300 mg/g | 35 | 72.4 | 54.1–97.0 | 0.001 |
CI = confidence interval.
Adjusted for age, sex, race, albumin–creatinine ratio, systolic blood pressure, diastolic blood pressure, diabetes and body mass index.
Adjusted for age, sex, race, eGFRcys, systolic blood pressure, diastolic blood pressure, diabetes and body mass index.
Geometric mean.
Spline functions were used to identify the threshold of decrement in kidney function at which the slope of FGF-23 levels became steeper. This occurred at eGFR levels approximately <90 ml/min/1.73m2 by both eGFRCr and eGFRCys, independent of age, sex, race, ACR, blood pressure, diabetes and body mass index (Figure 1A and B). Interaction terms confirmed this finding, demonstrating that slope of the association of eGFR with FGF-23 differed significantly among individuals with eGFRCys >90 versus those with eGFRCys 60–89. Results were similar with eGFRCr (interaction P for both comparisons <0.001). In contrast, the slope of the relationship of ACR with FGF-23 was positive and fairly linear throughout the distribution of ACR values (Figure 1C). Significant differences were observed even among individuals with <30 mg/g in this analysis.
Fig. 1.
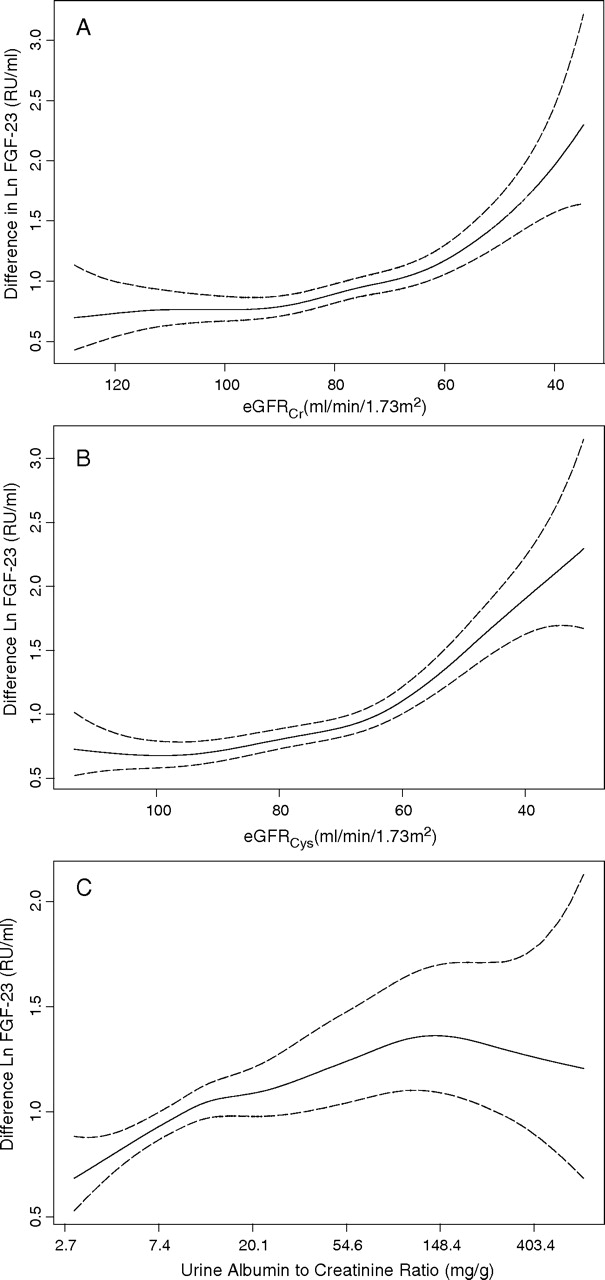
Cubic spline function demonstrating that the adjusted association of (A) eGFRCr, (B) eGFRCys and (C) ACR with plasma FGF-23 levels. Solid lines represent the adjusted point estimates, and dotted lines represent the 95% confidence intervals. The y-axis demonstrates the beta coefficient, representing the change in natural log transformed FGF-23 levels per unit change in kidney function. *The spline functions for eGFRCr and eGFRCys was adjusted for age, sex, race, ACR, systolic blood pressure, diastolic blood pressure, diabetes and body mass index. Spline function for ACR was adjusted for age, sex, race, eGFRCys, systolic blood pressure, diastolic blood pressure, diabetes and body mass index.
Discussion
We demonstrate that modest decrements in eGFR or modest albuminuria are sufficient to detect higher FGF-23 levels in a cohort of out-patients with stable cardiovascular disease and a range of kidney function from normal to moderate CKD. Decrements in GFR and elevations in albuminuria were each associated with elevated FGF-23 independent of one another. These data suggest that FGF-23 is among the earliest detectable abnormalities in mineral metabolism as kidney function decline develops.
Recently studies have demonstrated that FGF-23 levels are strongly associated with mortality in incident dialysis patients, and with greater left ventricular mass in persons with CKD [7,8]. Yet even modest decrements in GFR are strongly associated with CVD events [17,18]. On the basis of results demonstrated here, future studies should evaluate the association of FGF-23 with mortality and CVD events in the general population. Moreover, as FGF-23 induces phosphaturia and inhibits conversion of 25 (OH) vitamin D to its active form, it is possible that FGF-23 levels may be associated with lower bone mineral density and fractures. Studies are needed to evaluate whether FGF-23 may contribute to osteoporosis in the general population, and/or to metabolic bone disease in persons with mild to moderate CKD.
Strengths of this study include its relatively large sample size, availability of creatinine, cystatin C, and albumin–creatinine ratio concurrently, and inclusion of individuals with normal to moderate decrements in kidney function. Limitations include a preponderance of older men, all with prevalent CVD, and few subjects with advanced CKD. Results may differ in other settings.
We conclude that modest decrements in eGFR and elevations in albuminuria are each associated with higher FGF-23 levels independent of one another.
Acknowledgments
The authors thank Ms. Clydene Nee for review and assistance with the manuscript. This study was supported by an American Heart Association Fellow to Faculty Transition Award (JHI). The Heart and Soul Study was supported by the Department of Veterans Epidemiology Merit Review Program; the Department of Veterans Affairs Health Services Research and Development service; the National Heart Lung and Blood Institute (R01 HL079235); the American Federation for Aging Research (Paul Beeson Scholars Program); the Robert Wood Johnson Foundation (Generalist Physician Faculty Scholars Program); and the Ischemia Research and Education Foundation.
Conflict of interest statement. None declared.
References
- 1.Levin A, Bakris GL, Molitch M, et al. Prevalence of abnormal serum vitamin D, PTH, calcium, and phosphorus in patients with chronic kidney disease: results of the study to evaluate early kidney disease. Kidney Int. 2007;71:31–38. doi: 10.1038/sj.ki.5002009. [DOI] [PubMed] [Google Scholar]
- 2.Dhingra R, Sullivan LM, Fox CS, et al. Relations of serum phosphorus and calcium levels to the incidence of cardiovascular disease in the community. Arch Intern Med. 2007;167:879–885. doi: 10.1001/archinte.167.9.879. [DOI] [PubMed] [Google Scholar]
- 3.Foley RN, Collins AJ, Ishani A, et al. Calcium-phosphate levels and cardiovascular disease in community-dwelling adults: the Atherosclerosis Risk in Communities (ARIC) Study. Am Heart J. 2008;156:556–563. doi: 10.1016/j.ahj.2008.05.016. [DOI] [PubMed] [Google Scholar]
- 4.Dobnig H, Pilz S, Scharnagl H, et al. Independent association of low serum 25-hydroxyvitamin d and 1, 25-dihydroxyvitamin d levels with all-cause and cardiovascular mortality. Arch Intern Med. 2008;168:1340–1349. doi: 10.1001/archinte.168.12.1340. [DOI] [PubMed] [Google Scholar]
- 5.Hagstrom E, Hellman P, Larsson TE, et al. Plasma parathyroid hormone and the risk of cardiovascular mortality in the community. Circulation. 2009;119:2765–2771. doi: 10.1161/CIRCULATIONAHA.108.808733. [DOI] [PubMed] [Google Scholar]
- 6.Liu S, Quarles LD. How fibroblast growth factor 23 works. J Am Soc Nephrol. 2007;18:1637–1647. doi: 10.1681/ASN.2007010068. [DOI] [PubMed] [Google Scholar]
- 7.Gutierrez OM, Mannstadt M, Isakova T, et al. Fibroblast growth factor 23 and mortality among patients undergoing hemodialysis. N Engl J Med. 2008;359:584–592. doi: 10.1056/NEJMoa0706130. [DOI] [PMC free article] [PubMed] [Google Scholar]
- 8.Gutierrez OM, Januzzi JL, Isakova T, et al. Fibroblast growth factor 23 and left ventricular hypertrophy in chronic kidney disease. Circulation. 2009;119:2545–2552. doi: 10.1161/CIRCULATIONAHA.108.844506. [DOI] [PMC free article] [PubMed] [Google Scholar]
- 9.Isakova T, Gutierrez O, Shah A, et al. Postprandial mineral metabolism and secondary hyperparathyroidism in early CKD. J Am Soc Nephrol. 2008;19:615–623. doi: 10.1681/ASN.2007060673. [DOI] [PMC free article] [PubMed] [Google Scholar]
- 10.Ix JH, Chertow GM, Shlipak MG, et al. Fetuin-A and kidney function in persons with coronary artery disease—data from the Heart and Soul Study. Nephrol Dial Transplant. 2006;21:2144–2151. doi: 10.1093/ndt/gfl204. [DOI] [PMC free article] [PubMed] [Google Scholar]
- 11.Levey AS, Greene T, Kusek JW, et al. A simplified equation to predict glomerular filtration rate from serum creatinine [Abstract] J Am Soc Nephrol. 2001;11:A0828. [Google Scholar]
- 12.Ix JH, Shlipak MG, Chertow GM, et al. Association of cystatin C with mortality, cardiovascular events, and incident heart failure among persons with coronary heart disease: data from the Heart and Soul Study. Circulation. 2007;115:173–179. doi: 10.1161/CIRCULATIONAHA.106.644286. [DOI] [PMC free article] [PubMed] [Google Scholar]
- 13.Stevens LA, Coresh J, Schmid CH, et al. Estimating GFR using serum cystatin C alone and in combination with serum creatinine: a pooled analysis of 3, 418 individuals with CKD. Am J Kidney Dis. 2008;51:395–406. doi: 10.1053/j.ajkd.2007.11.018. [DOI] [PMC free article] [PubMed] [Google Scholar]
- 14.Jonsson KB, Zahradnik R, Larsson T, et al. Fibroblast growth factor 23 in oncogenic osteomalacia and X-linked hypophosphatemia. N Engl J Med. 2003;348:1656–1663. doi: 10.1056/NEJMoa020881. [DOI] [PubMed] [Google Scholar]
- 15.Toto RD. Microalbuminuria: definition, detection, and clinical significance. J Clin Hypertens (Greenwich) 2004;6:2–7. doi: 10.1111/j.1524-6175.2004.4064.x. [DOI] [PMC free article] [PubMed] [Google Scholar]
- 16.K/DOQI clinical practice guidelines for chronic kidney disease: evaluation, classification, and stratification. Am J Kidney Dis. 2002;39:S1–S266. [PubMed] [Google Scholar]
- 17.Shlipak MG, Katz R, Sarnak MJ, et al. Cystatin C and prognosis for cardiovascular and kidney outcomes in elderly persons without chronic kidney disease. Ann Intern Med. 2006;145:237–246. doi: 10.7326/0003-4819-145-4-200608150-00003. [DOI] [PubMed] [Google Scholar]
- 18.Shlipak MG, Sarnak MJ, Katz R, et al. Cystatin C and the risk of death and cardiovascular events among elderly persons. N Engl J Med. 2005;352:2049–2060. doi: 10.1056/NEJMoa043161. [DOI] [PubMed] [Google Scholar]