

Abstract
Phagocytes kill encapsulated microbes through oxidative cleavage of surface carbohydrates, releasing glycan fragments and microbial contents that serve as ligands for immune receptors, which tailor the immune response against the offending pathogen. The glycan fragments serve as MHC class II (MHC II) ligands and innate receptor agonists, whereas microbial proteins serve as substrates for proteolytic cleavage and MHC II presentation, and released nucleic acids activate innate pattern-recognition receptors (e.g., TLR9). In the current study, confocal microscopy of live macrophages and dendritic cells revealed that endocytosis of carbohydrates lead to vesicular acidification independent of proton pump activity. Acidification was dependent on NO-mediated oxidation in the presence of the ingested carbohydrate and was sufficient to negatively regulate T cell-dependent polysaccharide Ag cleavage, promote acid-dependent protein Ag processing, and facilitate CpG-mediated TLR9 signaling. Our findings lead to a model in which oxidation of carbohydrates from encapsulated microbes facilitates adaptive immune responses against microbial protein and carbohydrate Ags through promoting Ag processing for MHC II-mediated presentation as well as innate responses against released microbial DNA via TLR9 signaling.
Advances in our understanding of bacterial carbohydrates represent a new frontier in the study of the adaptive and innate immune responses (1). Capsular polysaccharides expressed by a number of pathogenic and commensal bacteria, such as type 1 Streptococcus pneumoniae (2) and Bacteroides fragilis (3), are not only recognized by innate pattern-recognition receptors (PRRs) like TLR2 (4), but can also stimulate T lymphocytes via Ag presentation on MHC class II (MHC II) proteins (3). The glycoantigen (GlyAg) polysaccharide A from B. fragilis (PSA) is the most thoroughly studied capsular polysaccharide able to initiate T cell activation (3, 5–7). It is composed of a zwitterionic tetrasaccharide repeating unit (8) and activates TLR2 (4), leading to an MyD88-dependent signaling cascade and NFκB translocation into the cell nucleus to regulate transcription of key immune response genes, including NOS2 (inducible NO synthase [iNOS]). T cell activation is achieved following NO-mediated oxidation and processing of PSA into small, 5–10-kDa fragments that associate with MHC II proteins (3, 9) for T cell recognition (3, 10).
As seen with protein Ags, it is now well established that MHC II binding (11) and the resulting T cell response against GlyAg (12) is dependent on processing the intact antigenic molecule from >100 repeating units (>100 kDa) to a fragment ranging in size from 5–10 kDa (5–10 repeating units) (3). Protein Ags are processed through the action of acid-activated proteases within the vesicles of APCs and thus processing is regulated by both the environmental pH and the specificity of the enzyme (13). In contrast, GlyAg cleavage is mediated by TLR2-dependent NO oxidation (3, 4) through a deamination reaction (9). Although NO oxidation should cleave all repeating units equally, fragments <5 kDa, which fail to associate with MHC II (11), have never been found within APCs, suggesting the presence of an uncharacterized regulatory mechanism to prevent complete oxidative destruction of the GlyAg epitope during processing.
Recently, it was shown that innate signaling via the TLR9 pathway is dependent on the same acid-induced proteolytic activity that is required for conventional protein Ag processing (14,15). Ligation of TLR9 with CpG to produce TNFα was blocked when the drug bafilomycin A1 (BafA), an inhibitor of proton pumps that acidify endosomal compartments, was given to the cells. Neutralization of these compartments prevented cleavage of a key domain on TLR9, thus preventing ligation with CpG. As a result, it is now clear that regulation of the vesicular pH is critical for adaptive immune responses against protein Ags as well as innate signaling by nucleic acids in phagosomes.
In this study, live cell confocal microscopy revealed that GlyAg induces acidification of vesicles in a NO-dependent fashion following endocytosis. This pathway is independent of the resident proton pumps and is the result of proton release during NO oxidation in the presence of GlyAg. Remarkably, GlyAg-dependent acidification leads to a negative feedback loop in which further oxidation is inhibited, thus providing a novel mechanism for self-regulation of GlyAg processing prior to MHC II ligation and T cell recognition. Furthermore, GlyAg-induced acidification promoted conventional Ag-receptor ligand release into endosomal compartments and protein Ag processing as well as CpG-mediated TLR9 signaling, even in the presence of BafA through activation of the resident proteases. These results demonstrate that capsular polysaccharides from phagocytosed microbes serve as ligands for immune receptors to initiate immune responses and directly promote the processing and recognition of other microbial products such as protein Ags and nucleic acids.
Materials and Methods
Cell lines
RAW 264.7 (RAW) macrophages (ATCC Cat. TIB-71; Manassas, VA) were cultured in DMEM supplemented with 10% FBS. THP-1 monocytes (ATCC Cat. TIB-202) were cultured in RPMI 1640 medium supplemented with 5% FBS and were differentiated into macrophage-like cells by treatment with 10 ng/ml PMA (Sigma-Aldrich, St. Louis MO) for 72 h (16).
Mice and primary cells
Wild type (WT; C67BL/6J, stock 000664) and iNOS−/− (B6.129P2-Nos2tm1Lau/J, stock 002596) were purchased from The Jackson Lababoratory (Bar Harbor, ME). Mice were housed at the CWRU Animal Resource Center, and experiments were performed in accordance with the guidelines of the National Institutes of Health and protocols approved by the Institutional Animal Care and Use Committee. Peritoneal macrophages (PMs) were obtained by peritoneal lavage and plastic adherence 6 or 7 d after i.p. injection of 1 ml 3% Brewer’s thioglycollate. PMs were cultured in DMEM with 10% FBS (17). Bone marrow-derived dendritic cells (BMDCs) were obtained by collecting bone marrow from mouse femurs and culturing the cells in RPMI 1640 with 10% FBS and 15 ng/ml GM-CSF (Invitrogen, Carlsbad CA). Media were removed and replaced with media containing fresh cytokine on days 2 and 4 and then washed on day 7. Cells were collected on days 11–13 to be used for experiments (CD11c-positive; Supplemental Fig. 1).
GlyAg purification and labeling
GlyAg from the capsule of B. fragilis was collected, purified, and analyzed for purity as described previously (18). GlyAg was fluorescently labeled with AlexaFluor594 (Molecular Probes, Eugene OR) as described previously (3).
Inhibitors
Competitive iNOS inhibitor Nω-nitro-L-arginine methyl ester hydrochloride (L-NAME) and ATPase proton pump inhibitor BafA were purchased from Sigma-Aldrich (St. Louis, MO). The irreversible iNOS inhibitor 1400W (N-[3-aminomethyl] benzylacetamidine, 2HCl) was purchased from Cayman Chemical (Ann Arbor, MI).
NO production assays
Microwell plate assay
Cells (1 × 10⁵) were added to triplicate wells of a 96-well plate with 200 μl media. 4-amino-5methylamino-2′7′-difluorofluorescein diacetate (DAF-FM) (10 μM; 4-amino-5methylamino-2′7′-difluorofluorescein diacetate, excitation (ex) 495nm, emmision (em) 515nm; Molecular Probes, Eugene, OR) in anhydrous DMSO was added to each well, and the plate was incubated for 1 h at 37°C and 5% CO2. The cells were washed with PBS, 200 μl fresh media was added, and the plate was incubated for an additional 30 min. GlyAg (100 μg/ml) in PBS, PBS alone, and 1 mM L-NAME was added to the wells, and the fluorescence was measured using a Wallac Victor3V (Perkin Elmer, Waltham MA) multilabel counter at various time points. Data represent the change in fluorescence over PBS only treated cells. For flow cytometry, 8 × 10⁵ cells were added to wells of a six-well plate and treated with DAF as described above. After 24 h, cells were removed from the plate, washed, and analyzed using a Becton Dickinson FACScan flow cytometer (Franklin Lakes, NJ). Data were analyzed using FCS Express software (De Novo Software, Los Angeles, CA). For nitrite detection, 1 × 10⁵ cells were added to triplicate wells of a 96-well plate with 200 μl media, treated with 100 ng/ml LPS (Sigma-Aldrich, St. Louis, MO), 100 μg/ml GlyAg in PBS, 15 nM Pam3Csk4 (P3C), or GlyAg with 0.1 mM 1400W, and incubated for 48 h. Supernatant was removed and tested for nitrite using Griess Reagent System (Molecular Probes, Eugene OR) per the manufacturer’s instructions.
Confocal microscopy
Microscopy was performed using a high-speed Leica SP5 Broadband confocal microscope (Wetzlar, Germany) and HCX PL APO CS 63× oil immersion objective (NA 1.4). Live cell confocal microscopy was performed with all apparatus at 37°C (heated stage and objective). Cells were maintained within a temperature and humidity controlled chamber (37°C and 5% CO2) in cell culture media for the duration of the experiments. Images were acquired and analyzed using Leica Application Suite software. Further analysis (colocalization, correlation) was performed using Imaris imaging suite (Bitplane, St. Paul, MN).
Intracellular pH flow cytometry
WT or iNOS−/− PMs were harvested, and 2 × 10⁶ cells were added to wells of a six-well plate, treated with 40 nM BafA overnight (~16 h), washed, and treated with 2 μM LysoSensor Green DND-189 (ex 443 nm, em 505 nm; Molecular Probes, Eugene, OR) for 30 min. The cells were removed from the plate, washed, and analyzed using a Becton Dickinson FACScan flow cytometer. Data were analyzed using FCS Express software.
Intracellular pH confocal microscopy
Cells (2 × 10⁵) were cultured in wells of an eight-well chamber slide (Nalge Nunc International, Rochester, NY) overnight (~16hrs) with 40 nM BafA and 50 μg/ml AlexaFluor594-GlyAg (Molecular Probes) or 15 nM P3C. The cells were washed and treated with fresh BafA for 1 h. The chamber slide was placed on a confocal microscope; 2 μM LysoSensor Green DND-189 was added, the cells were incubated for 25 min, and images were captured. Additional images were captured using cells that were pretreated with BafA then incubated overnight with GlyAg-594 and LysoSensor Green.
OVA processing confocal microscopy
Cells were treated as described above, except that they were incubated for 25 min with 50 μg/ml DQ-OVA (ex 505 nm, em 515 nm; Molecular Probes).
TNFα production
RAW 264.7 macrophages (105) were treated overnight (~16hrs) with 40 nM BafA and then stimulated with 1 μg/ml ODN1826 CpG oligonucleotide (Invivogen, San Diego, CA) with and without 50 μg/ml GlyAg. Supernatants were removed 24 h later and analyzed for TNFα using an ELISA MAX kit (BioLegend, San Diego, CA) as indicated by the manufacturer.
Ozone cleavage and pH in vitro
Lyophilized samples of GlyAg were resuspended in either diH2O or PBS at 1 mg/ml and treated with ozone gas generator (AquaZone, Red Sea, Houston, TX) at a constant flow rate of 100 mg/h. After 0, 15, 30, 45, and 60 min of ozone treatments, 150-μl aliquots were removed for further analysis, and the pH of the resulting sample was measured. The 150-μl aliquots were concentrated to 15 μl and analyzed by size exclusion chromatography on a SuperDex75 column in PBS using an Akta Purifier10 HPLC system (GE Healthcare Biosciences, Piscataway, NJ) outfitted with a ProStar 355 RI (refractive index) Flow Cell (Varian, Walnut Creek, CA). A standard curve was generated based on the elution profile of several dextrans of known molecular mass (1, 5, 12, 50, and 150 kDa). The Kav of the dextrans was calculated using the equation:
where Ve is the elution volume of the peak, Vo is the column void volume, and Vt is the total column volume. The Kav values were plotted using GraphPad Prism v.4 (GraphPad, San Diego, CA) as a function of the log10 of their known molecular mass, which allows calculation of the m.w. of the major experimental products in each sample based on the Kav.
Statistical analysis
Data are expressed as mean ± SEM. Graphs are generated using GraphPad Prism v.4 graphing software and data analyzed using unpaired t test with a two-tailed p value using GraphPad Instat3.
Results
GlyAg induces NO production in macrophages and dendritic cells
The processing of GlyAgs is an NO-dependent mechanism (3) that is initiated via TLR2 recognition (4). Within animal models of GlyAg responses, macrophages are the dominant APC present (19). To establish a model of NO-dependent GlyAg oxidation, we first quantified the NO response to B. fragilis GlyAg challenge using the NO-sensitive and cell-permeable fluorescent probe DAF-FM diacetate. We found that despite amplitude differences between human and mouse cells, cultured murine RAW 264.7, and human THP-1-derived macrophages produced robust levels of NO in response to GlyAg over a 48-h period (Fig. 1A).
FIGURE 1.

NO is produced by macrophages and dendritic cells in response to GlyAg. Unless noted otherwise, NO production was detected using 10 μM DAF-FM. Cells were treated with DAF-FM, GlyAg in PBS at 100 μg/ml (1 μM) or as labeled, or PBS alone. Data represent the change in fluorescence over PBS control. All data (except flow cytometry) are n = 9, and error bars represent SEM. A, Significant NO was produced in human and murine cultured macrophage cell lines in response to GlyAg. B, Time course of NO production in murine RAW macrophages, revealed a t1/2 (time to reach half completion) of 24.6 ± 1.1 h, suggesting de novo synthesis of the iNOS enzyme was required. C, NO production in RAW macrophages showed that 0.74 ± 0.6 μM of GlyAg was required to reach a half-maximal response, illustrating the dose-dependence of the NO response. D, Significant NO was produced on a per cell basis in RAW macrophages over background (filled black histogram, unstained cells; blue, unstimulated but stained cells) as measured by flow cytometry 24 h after stimulation with GlyAg (red). The response was reduced by 100 mM L-NAME (iNOS inhibitor; green), confirming the specificity of NO detection. Inset bar graph shows the mean fluorescence intensity in match color scheme. E, Nitrite concentration in RAW macrophage spent media was measured in untreated (M) or stimulated cells (L, 100 ng/ml LPS; G, 100 μg/ml GlyAg) as determined by the Griess reagent at 48 h, confirming NO secretion. Inhibition of NO production was achieved using the iNOS-specific inhibitor 1400W at 0.1 mM (G + I) to verify the mechanism of NO synthesis. F, NO production was also readily detectable using DAF-FM in primary murine PMs and BMDCs from WT C57BL6 mice. The data presented in this figure show that GlyAgs stimulate significant NO synthesis in a variety of professional APCs known to process and present GlyAg to T cells.
Using the murine macrophages as a model, we found that maximal NO production occurs at just over 1 d (t1/2 = 24.6 ± 1.1 h; Fig. 1B) and is dose-dependent, requiring 0.74 ± 0.6 μM of GlyAg (Fig. 1C) to reach a half-maximal response. Using flow cytometry to measure NO production on a per-cell basis, we confirmed substantial NO production in RAW macrophages challenged with GlyAg for 24 h when compared with untreated cells (Fig. 1D, blue versus red bars). NO production in response to GlyAg and LPS was chemically verified using the Griess Reagent System (Molecular Probes), which detects nitrite in the culture supernatant as a product of NO reduction. LPS and carbohydrate-treated RAW macrophages produced 10- and 7-fold more nitrite than resting cells (Fig. 1E). Finally, we confirmed that the oxidants produced were NO and the result of iNOS expression using two enzyme inhibitors: L-NAME, an L-Arginine mimic that competes for the NOS active site (20), and 1400W, a selective and irreversible iNOS inhibitor (21). Both inhibitors significantly reduced oxidant production in response to GlyAg as by flow cytometry (Fig. 1D, green bar) and Griess Reagent (Fig. 1E).
To facilitate the use of APCs from processing-deficient iNOS ablated (iNOS−/−) animals (3) in dissecting the regulation mechanism for GlyAg processing, we next expanded our analysis to include primary murine thioglycollate-recruited PMs and BMDCs (Supplemental Fig. 1) from C57BL/6 animals. As seen with the immortalized cell lines, substantial GlyAg-dependent NO production was detected over several days (Fig. 1F). Furthermore, the necessity of NO production by GlyAg-stimulated APCs for T cell activation was examined using IFN-γ production as a marker of T cell activation (Supplemental Fig. 2). Cocultures of WT APCs and CD4+ T cells produce significantly more IFN-γ in response to GlyAg stimulation than do iNOS−/− cocultures, demonstrating that NO production and subsequent oxidation of GlyAg is fundamental for GlyAg processing, presentation, and T cell activation. These data demonstrate that GlyAgs stimulate the NO response via iNOS expression in a broad spectrum of primary and cultured APCs, with a peak production point of 24 h, and this NO production and oxidation is vital for the generation of a GlyAg specific T cell response.
GlyAg oxidation via NO leads to vesicular acidification
Given the importance of pH for conventional Ag processing (22) and the strong NO response shown in murine RAW macrophages, PMs, and BMDCs, we assessed the relationship between NO production in the presence of GlyAg and intravesicular pH. First, we used the pH-sensitive probe LysoSensor Green DND-189 (LysoSensor), which is modestly fluorescent at neutral pH but increases in fluorescence within acidic environments (Supplemental Fig. 3). To verify that we can detect acidic pH in cells using LysoSensor, we treated WT and iNOS−/− PMs with the probe and analyzed the fluorescence using flow cytometry (Fig. 2A, 2B). To control for constitutive vesicular acidification generated by the V-type ATPase proton influx pump, we pretreated the cells overnight with the inhibitor BafA and then treated them with Lyso. The addition of BafA reduced Lyso fluorescence by ~45% in both cell types, verifying that we can reduce constitutive acidification and analyze vesicular pH using LysoSensor over a 24-h period.
FIGURE 2.

BafA inhibits intracellular acidification. WT (A) or iNOS−/− (B) peritoneal macrophages were treated with (+) and without (−) 40 nM BafA overnight, then all were treated with 2 μM LysoSensor Green (Lyso) and fluorescence was measured by flow cytometry to evaluate vesicular pH. Additional cells were not treated with BafA or Lyso (unt). Cells not treated with BafA displayed high levels of Lyso fluorescence (i.e., vesicular acidification [gray bar and histogram]), and the addition of BafA (black bar and histogram) reduced the fluorescence by ~45% in both WT and iNOS−/−. Number above bars on the bar graph indicate corresponding mean fluorescence intensity.
Next, RAW macrophages and WT PMs and BMDCs were incubated with AlexaFluor594-conjugated GlyAg, and then confocal microscopy was performed with each live cell population to assess the influence of GlyAg on vesicular pH. Control experiments in the absence of GlyAg confirm that BafA reduces LysoSensor fluorescence in these cells, indicating that the vesicular pH was almost neutral (Fig. 2). For all WT cells (RAW macrophages, PMs, and BMDCs), vesicles containing carbohydrate (i.e., red) also displayed bright green LysoSensor fluorescence, indicating that vesicles rich in GlyAg become acidic. This can be seen in the red (GlyAg) and green (LysoSensor) colocalized areas of each NO-positive cell population (Fig. 3A; yellow in Merge column and blue in Colocalization column).
FIGURE 3.

GlyAg oxidation leads to intracellular acidification. All images taken with a 63× oil immersion lens. A, APCs were treated with 40 nM BafA to block normal acidification and 2 μM Lyso to detect vesicular pH and then incubated with 50 μg/ml AlexaFluor594-conjugated GlyAg (GlyAg-594) for 18 h. We found that RAW macrophages and WT primary cells showed intense green fluorescence, indicating acidic pH, and significant colocalization (yellow), indicating that the acidic environment occurred primarily in vesicles loaded with GlyAg. In contrast, iNOS−/− cells showed little colocalization, and the green signal remained unchanged (no increase in fluorescence over background levels), collectively suggesting that NO-mediated oxidation in the presence of GlyAg was required for acidification. Colocalization was determined using Imaris imaging software. Scale bar, 20 μm. B, Representative scatterplots of each fluorescent pixel from confocal images with LysoSensor Green fluorescent intensity along the x-axis and GlyAg fluorescent intensity along the y-axis. The shaded area in the upper right quadrant represents colocalized pixels (i.e., double-positive for red and green) above background with the associated Pearson correlation coefficient indicated for all colocalized pixels, as calculated using Imaris CoLoc software. NO-producing cells showed a direct correlation between GlyAg and acidification, which was lost in the absence of NO-mediated oxidation.
To determine whether these acidic vesicles were generated because of NO-mediated oxidation of ingested GlyAg, we used PMs and BMDCs from processing and NO-deficient mice (iNOS−/−) (2, 3). iNOS−/− PMs and BMDCs endocytosed GlyAg (Fig. 3A, red), but those vesicles did not become acidic, as indicated by a lack of vesicles that demonstrated increased LysoSensor fluorescence or any substantial colocalization. These data suggest that NO and GlyAg collectively contribute directly to APC endosomal acidification.
Quantitative analysis of the colocalization between GlyAg and induced acidification was performed for all images and is displayed as two-dimensional scatterplots (analogous to flow cytometry dot plots) of LysoSensor versus GlyAg fluorescence intensity (Fig. 3B). The shaded area in the upper right quadrant represents colocalized (double positive) pixels above baseline threshold, and the associated Pearson’s correlation coefficient for all the included pixels is shown. The data reveal that RAW macrophages and WT PMs and BMDCs exhibit more colocalized pixels and with stronger positive correlation between the two fluorescent signals than seen in the iNOS−/− cells. These data indicate that the presence of red signal (i.e., GlyAg) is strongly associated with green signal (i.e., acidic environment) in an NO-dependent fashion.
To determine whether the concentration of GlyAg correlates with changes in pH, as measured by fluorescence intensity, we performed confocal experiments as before and then measured the mean fluorescent intensities of GlyAg and LysoSensor signals in 100 independent and randomized regions of interest (ROIs) for each cell type. The data were then statistically evaluated to determine the degree of correlation between the two signals (Fig. 4A–D). In comparing PMs, we found that as the GlyAg signal increases, the LysoSensor signal (i.e., acidity) in WT (r = 0.4046; Fig. 4A) but not iNOS−/− cells (r = 0.0461; Fig. 4C) also increases. Likewise, WT BMDCs show a strong statistical correlation between GlyAg and LysoSensor intensity (r = 0.7451; Fig. 4B) that is significantly reduced in iNOS−/− BMDCs (r = 0.3770; Fig. 4D). This trend is apparent in cells not treated with BafA (Supplemental Fig. 4A); however, the correlation is stronger and more apparent when constitutive acidification is attenuated. Although there appears to be a difference in correlation strength between BafA-treated PMs and BMDCs, each WT cell type demonstrates a significantly stronger correlation than its treated NO-deficient counterpart. These data reveal a dose-dependent relationship between vesicular GlyAg concentration and induction of an acidic environment independent from proton pump activity.
FIGURE 4.

Vesicular acidification is GlyAg-concentration–dependent and overcomes BafA inhibition. Live APCs were treated with 40 nM BafA and 50 μg/ml AlexaFluor-conjugated GlyAg overnight, washed, and treated with 2 μM LysoSensor Green for 25 min, after which 10 confocal images in the z-axis were captured for each sample. The mean intensity of GlyAg and LysoSensor signals were quantified for 100 subcellular ROIs using the Leica Application Suite software and graphed in order of brightest to weakest GlyAg signal. WT PMs (A) and BMDCs (B) showed a positive correlation between GlyAg intensity (black bars) and Lyso intensity (gray bars), in that as GlyAg concentration increased, the degree of acidification followed in a colocalized manner. This correlation was significantly reduced in the iNOS−/− PMs (C) and BMDCs (D), demonstrating that acidification (increased Lyso intensity) was locally sensitive to GlyAg concentration and depended on NO-mediated oxidation. Furthermore, global fluorescence intensity values for each image were normalized to LysoSensor-only samples (100%) and BafA-treated cells (0%) of each respective cell type. The percent acidification recovery was then determined for GlyAg-treated WT and iNOS−/− cells. In cells capable of NO synthesis (E–G, filled bars), GlyAg led to significant recovery of acidification. iNOS−/− PMs (F, open bars) showed a significant decrease in recovery compared with WT PMs, whereas the NO-deficient BMDCs were completely unable to recover (G, open bars). Statistical analysis was performed between Lyso-only samples and GlyAg-treated samples. In iNOS−/− PMs and BMDCs, there is a significant statistical difference indicating that the percent recovery failed to achieve BafA-negative levels, whereas the WT cells achieved BafA-negative levels. Data represent eight separate images for each treatment group, and cell type and error bars represent SEM. ND, none detected (i.e., no increased LysoSensor fluorescence over BafA treated samples).
Using overall LysoSensor fluorescence intensity, we also performed confocal experiments to quantify the degree of cellular acidification recovery in BafA-treated APCs upon the addition and oxidation of carbohydrate. Live cell three-dimensional confocal microscopy experiments were performed, and the mean intensities of all the fluorescent pixels above baseline were quantified for each three-dimensionally reconstructed Z-stack (images not shown; n = 8 per group). For clarity, the data were scaled to 100% and 0%—without and with BafA, respectively, for each individual cell type and genotype—and the percent acidification recovery was calculated based on the LysoSensor fluorescence intensity upon exposure to GlyAg. All cells demonstrated decreased LysoSensor fluorescence when treated with BafA, indicating proper drug efficacy to inhibit acidification in live cells. RAW macrophages (Fig. 4E), WT PMs (Fig. 4F, filled bars), and WT BMDCs (Fig. 4G, filled bars) were each able to achieve a substantial degree of acidification recovery upon the addition of GlyAg (52.6%, 66.9%, and 48.7%, respectively). In contrast, iNOS−/− PMs (Fig. 4F, open bars) and BMDCs (Fig. 4G, open bars) were not able to achieve the same levels of recovery as their WT counter parts (39.9 and −77.8%, respectively), although some recovery was seen in the iNOS−/− PMs. These observations suggest that NO-mediated oxidation in the presence of ingested carbohydrate can bypass the requirement for the normal acidification pathway by directly promoting acidification.
GlyAg oxidation facilitates protein Ag processing
LysoSensor experiments are directly sensitive to the pH of vesicles containing the probe, but they fail to measure any functional consequences of NO-driven carbohydrate processing and acidification. As such, we first sought to examine whether the acidification generated by GlyAg oxidation could promote acid-dependent proteolytic processing of protein Ags. We used OVA heavily conjugated with BODIPY (DQ-OVA), which is self-quenched within the intact OVA protein, but becomes highly fluorescent upon cleavage. Untreated APCs and APCs treated with BafA were incubated overnight with or without AlexaFluor594-GlyAg overnight. The cells were then given DQ-OVA, and live cell confocal images were captured over a 25-min period.
All five untreated cell populations readily processed DQ-OVA, producing a bright green signal (Fig. 5, first column). Because this proteolytic cleavage is dependent on an acidic pH near 5.0, it was not surprising to find that BafA significantly reduced the appearance of OVA cleavage-dependent fluorescence in all cell types (Fig. 5, second column). When provided with GlyAg (Fig. 5, red, fourth column), RAW macrophages, WT PMs and WT BMDCs regained the ability to process OVA (Fig. 5, green, third column). In contrast, GlyAg processing deficient iNOS−/− PMs and BMDCs failed to generate the acidic environment required to induce proteolytic cleavage of OVA when BafA is present (Fig. 5, third column), despite no obvious difference in the ability to endocytose GlyAg (Fig. 5, fourth column). This can be seen readily in the colocalization between GlyAg and processed OVA (Fig. 5, fifth column) in WT versus iNOS−/− cells, demonstrating that NO-mediated oxidation in the presence of endocytosed carbohydrate promotes protein Ag degradation through acidification and activation of resident proteases.
FIGURE 5.

NO oxidation of GlyAg leads to enhanced pH-dependent OVA processing. All images taken with a 63× oil immersion lens. Confocal images of untreated APCs (left column), APCs treated with 40 nM BafA to inhibit normal acidification (second column), and BafA-treated APCs incubated with 50 μg/ml AlexaFluor594-conjugated GlyAg (three right columns). All cells were incubated with 50 μg/ml DQ-OVA for 25 min before image capture. All cells readily processed DQ-OVA upon internalization (green), but cleavage was strongly inhibited by BafA (second column) as expected. Although all cells were equally able to endocytose GlyAg (red), only RAW macrophages and WT primary APCs were able to process OVA above the BafA background (middle column; green) when incubated with GlyAg. Colocalization images (blue; Imaris CoLoc software) show that essentially all green regions of the cells were also GlyAg positive (compare the green and blue images), suggesting that the pH effect was strictly localized. In contrast, both NO-deficient cells were unable to initiate acid-dependent processing of OVA, indicating that NO-mediated oxidation in the presence of GlyAg generated an acidic environment that promotes protein Ag processing. Scale bars, 20 μm.
Using statistical analyses of these images, we calculated the percent recovery of OVA processing resulting from GlyAg oxidation-induced acidification. The overall green channel (i.e., processed OVA) fluorescence intensity of cells treated with DQ-OVA alone (i.e., no BafA or GlyAg) in a series of images was quantified and normalized to 100%. Using that scale as a standard, the effect of BafA and GlyAg oxidation was quantified. In all cases, BafA reduced the amount of OVA processing by atleast 70% (Fig. 6C, open bars) and as much as 98% (Fig. 6A, 6C, filled bars) compared with the controls. RAW macrophages (Fig. 6A), WT PMs (Fig. 6B, filled bars) and BMDCs (Fig. 6C, filled bars) all achieved at least 70% recovery of OVA processing following GlyAg endocytosis, whereas the iNOS PMs (Fig. 6B, open bars) and BMDCs (Fig. 6C, open bars) failed to overcome the BafA acidification inhibition.
FIGURE 6.

NO-capable cells demonstrate GlyAg-induced recovery of inhibited protein processing. Confocal images for each cell type and treatment condition (DQ-OVA for 25 min in cells treated ± BafA ± GlyAg overnight as shown in Fig. 5) were collected and quantified using the mean ROI intensity (n ≥ 40 ROIs per sample) and then normalized to the respective untreated samples to determine the percent pH-dependent proteolysis recovery following BafA treatment. Error bars represent SEM. Cells capable of NO production (A–C, filled bars) showed significant recovery of protein processing when BafA-treated cells were given GlyAg. This effect was lost in NO-deficient cells (B, C, open bars). Statistical analysis was performed between Lyso, BafA-treated samples, and GlyAg-treated samples. In both WT PMs and BMDCs, there is a statistically significant change in OVA cleavage induced by the addition of GlyAg to NO-capable cells, but this difference is not present in iNOS−/− cells. *There is a statistical difference between the mean fluorescence of iNOS−/− BMDCs when treated with BafA only or with BafA with GlyAg; however, the addition of GlyAg results in a lower mean fluorescence rather than recovery. D, We examined the strength of the relationship between NO- and GlyAg-induced acidification and protein processing by evaluating the mean ROI intensities (n ≥ 40 ROIs per sample) as fluorometric ratios of DQ-OVA fluorescence:GlyAg fluorescence, because DQ-OVA fluorescence is pH-sensitive whereas GlyAg fluorescence is pH-insensitive. Both WT PMs and BMDCs demonstrated a much higher fluorescence ratio than did their iNOS−/− counterparts. These data show that carbohydrate oxidation by NO generates an acidic environment conducive to protein Ag processing within endosomes.
Because DQ-OVA fluorescence is pH-sensitive (i.e., cleavage by acid-dependent proteases) and GlyAg fluorescence is pH-insensitive, we further examined the strength of the relationship between NO-and GlyAg-induced acidification and protein processing by evaluating the mean ROI intensities as fluorometric ratios of DQ-OVA fluorescence:GlyAg fluorescence (Fig. 6D). WT PMs and BMDCs (Fig. 6D, filled bars) demonstrated a higher fluorescence ratio than their iNOS−/− counterparts (Fig. 6D, open bars). These data substantiate our conclusion that NO-dependent GlyAg processing induces acidification even in the presence of BafA.
Published reports have demonstrated that treatment of cells with acidification inhibitors including BafA can also diminish receptor-mediated endocytosis and receptor-ligand dissociation (23–28). To examine this possibility, we monitored uptake of cleavage-independent fluorescent FITC-OVA in RAW macrophages treated with 40 nM BafA with or without GlyAg (Supplemental Fig. 5). Treatment of the cells with BafA reduced the internalization of the protein Ag resulting in surface accumulation of the FITC-OVA. Because receptor dissociation of many ligands into endosomal vesicles requires receptor conformational changes induced by an acidic pH (29), it is likely that BafA inhibited the release of OVA from its receptor, leading to receptor-ligand recycling and OVA accumulation at the cell surface. The addition of GlyAg to the cells overcame BafA inhibition and promoted FITC-OVA internalization and retention. Because we can visualize internalized and cleaved DQ-OVA (Fig. 5) and FITC-OVA (Supplemental Fig. 5) in BafA-treated cells in the presence of NO-mediated oxidization and GlyAg, these data indicate that GlyAg processing induces an acidic environment that promotes not only protein Ag proteolysis, but also pH-sensitive receptor mediated endocytosis and intravesicular dissociation of protein Ags from their cognate receptors. Furthermore, stimulation of non-BafA treated cells with GlyAg induced greater uptake of FITC-OVA than in cells not given GlyAg (Supplemental Fig. 4B) providing evidence that GlyAg oxidative processing generates increased acidity within vesicles and promotes protein Ag uptake and retention, even in the absence of BafA.
NO oxidation of GlyAg induces protein processing only in GlyAg+ endosomes
It remained possible that NO-oxidized GlyAg could trigger a cell-wide signaling cascade that induces BafA-resistant vesicular acidification in all vesicles, or the oxidation reaction could simply release protons into the local vesicular environment. To differentiate these possibilities, we performed colocalization analyses of confocal images collected as described for Fig. 5. RAW macrophages incubated with DQ-OVA without BafA are able to process OVA, as indicated by the pixels spread along the DQ-OVA fluorescence gradient on the x-axis of the scatterplot (Fig. 7A). In agreement with the data presented in Fig. 5, RAW macrophages pretreated with BafA are not able to process DQ-OVA because of a lack of pH-sensitive proteolytic activity, as demonstrated by the lack of pixels along the x-axis (Fig. 7B). However, when BafA-treated cells were also given GlyAg, OVA processing was restored (Fig. 7C), demonstrating that GlyAg oxidation is sufficient to promote protein Ag processing. More importantly, essentially no pixels were single-positive for OVA processing (green-only pixels, bottom right quadrant), demonstrating that vesicles without GlyAg do not become acidic. As before, we found that strong colocalization of OVA processing and GlyAg was dependent on the induction of NO oxidation. WT cells (Fig. 7D, 7F) showed higher correlation between the fluorescent signals and had a larger percentage of colocalized pixels than did the NO-deficient cells (Fig. 7E, 7G). Because of the highly localized nature of the acidification and proteolytic cleavage (upper right quadrants), these data argue against a cell-wide signaling cascade that activates a BafA-insensitive pathway and suggest that the pH changes are limited to the GlyAg+ vesicle microenvironment.
FIGURE 7.
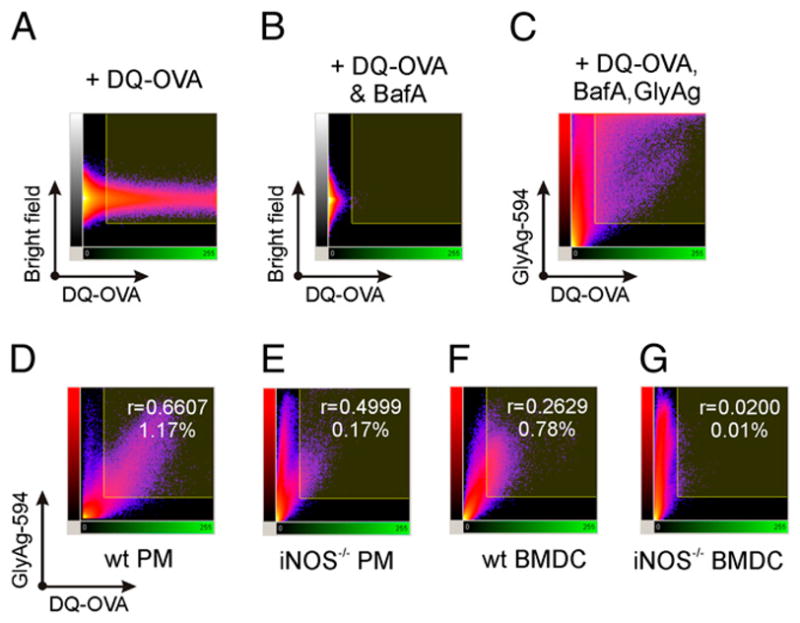
GlyAg oxidation-mediated acidification is limited to GlyAg+ vesicles. Using three-dimensional reconstructions of the data sets (Figs. 5, 6), the individual pixel intensities were also mapped in scatterplots to quantify colocalization of OVA processing and GlyAg. Cells given DQ-OVA only (no GlyAg or BafA) displayed a large number of green pixels, which represent processed OVA (A), whereas BafA blocks proteolysis, as seen with a significantly reduced number of green pixels (B). When RAW macrophages were incubated with BafA and GlyAg (C), all bright green regions (i.e., processed OVA) were also positive for GlyAg (double positive, upper right quadrant). Many cell regions were positive for GlyAg only, but no regions were positive for OVA processing alone. The same pattern was observed in primary WT cells (D, F), in that green pixels were nearly always positive for red, but not vice versa. Conversely, NO-deficient cells show dramatically reduced numbers of green pixels and colocalization (E, G). These data confirm that carbohydrate oxidation by NO had a local pH effect within individual GlyAg+ endosomes. All values, including the Pearson correlation coefficients (r values) were determined by the Imaris CoLoc software.
NO production in the absence of GlyAg is insufficient to generate acidic endosomes
GlyAgs are known TLR2 agonists (4) that induce NO production (Fig. 1). To determine whether NO induction via TLR2 signaling was sufficient to induce vesicular acidification, cells were stimulated with the TLR2 agonist P3C to induce NO production (Fig. 8A). The stimulation of TLR2 and production of NO in WT cells had no observable effect on pH in the absence of GlyAg within the vesicles (compare WT cells in Figs. 5 and 8B). In contrast, both BafA-treated WT and iNOS−/− PMs (Fig. 8B, 8C) and BMDCs (data not shown) failed to generate the appropriate acidic environment required to promote OVA processing when stimulated with P3C, suggesting that NO is not acting as a signal to the cell to induce acidification, but is acting through oxidation of GlyAg.
FIGURE 8.

P3C-mediated TLR2 signaling and NO production is inadequate to induce acidification, yet GlyAg oxidation promotes CpG-mediated TLR9 signaling (A). To verify P3C-induced NO production, RAW macrophages were stimulated with 15 nM P3C (P), 100 ng/ml LPS (L), 100 μg/ml GlyAg (G), or left untreated (M); spent media were analyzed for nitrite concentration at 48 h as determined by the Griess reagent (n = 3). All Ags stimulated significant NO production. B, PMs were treated with 40 nM BafA then 15 nM P3C overnight, washed, and incubated with 50 μg/ml DQ-OVA for 25 min. Multiple confocal images (63×) for both WT and iNOS−/− PMs and each treatment condition were taken, which showed little to no green signal and therefore no OVA processing in BafA-treated cells given P3C. Scale bar, 20 μm. C, Images were analyzed using the Leica Application Suite for ROI mean intensity values (n ≥ 40 ROIs per sample; error bars are SEM) and normalized to the respective DQ-OVA–only positive control samples. Despite P3C-mediated, TLR2-dependent synthesis of NO (not shown), P3C failed to induce acidification in PMs over the BafA-treatment, suggesting that both NO and NO oxidation of GlyAg were collectively necessary to achieve acidification. D, RAW macrophages were treated with 40 nM BafA overnight to inhibit TLR9 signaling and then stimulated with 1 μg/ml CpG with and without 50 μg/ml GlyAg. Supernatants were removed 24 h later, and the amount of TNFα produced was determined by ELISA. TNFα production was normalized to the control (CpG without BafA) and compared with the cells incubated with and without GlyAg and BafA. As expected, BafA eliminated TLR9 signaling, but GlyAg oxidation was able to restore 43.98% of the TNFα production induced by CpG and TLR9. Error bars represent SEM. ND, not detected.
GlyAg oxidation promotes TLR9 signaling
Two recent reports have demonstrated that signaling through the PRR molecule TLR9, which recognizes double-stranded microbial DNA (e.g., CpG) inside endosomal compartments, requires proteolytic cleavage of the TLR9 ectodomain for appropriate signal transduction and the initiation of the innate immune response (14, 15). To determine whether GlyAg oxidation could promote TLR9 signaling through the generation of acidic endosomes, we first measured TNFα production in RAW macrophages with and without BafA. Our results confirm that TNFα production in response to CpG was eliminated by BafA-mediated pH neutralization (Fig. 8D). However, when the BafA-treated macrophages were also provided GlyAg, TLR9 recognition and signaling in response to CpG was restored by ~44% (Fig. 8D), which closely matches the 52.6% degree of acidification recovery measured by LysoSensor detection (Fig. 5E). These data indicate that GlyAg oxidative cleavage can promote innate responses via TLR9 signaling and TNFα production.
Oxidative GlyAg processing is negatively regulated through proton release
GlyAg is processed by NO via attack on the free amine within each repeating unit at neutral pH (9). Given that each repeating unit is identical and that GlyAg fragments must be larger than four repeating units (~4 kDa) to associate with MHC II (11) and elicit an immune response (12), we were interested in understanding the possible functional role for pH in downregulating NO oxidation to prevent complete degradation of the 4–10-kDa GlyAg epitope.
GlyAg was oxidized in vitro to mimic the microenvironment of an endosome to measure the functional correlation between oxidative cleavage and pH. GlyAg was dissolved in diH2O or PBS and then subjected to oxidative cleavage in vitro for 1 h. At various time points, aliquots were removed and analyzed for pH and molecular mass of the major product by analytical HPLC. During the first 15 min of oxidation, the GlyAg dissolved in diH2O was cleaved from >50 to 37.4 kDa, while the pH of the system rapidly dropped from ~7.0 to 4.85 (Fig. 9A). Slow cleavage was seen following this pH drop, ending at a major product with an average molecular mass of 9 kDa at 60 min, which strongly correlates in size to the major product found inside APC endosomes and bound to MHC II at the cell surface (3). In the absence of GlyAg, no pH change was observed (data not shown). However, when the GlyAg solution was buffered with phosphate, the pH changed much more slowly during the first 15 min of oxidation, from 6.98 to 6.69, and this correlated to highly efficient processing from >50 to 4.4 kDa (Fig. 9B). As time was extended, the pH never reached below 5.7, and the extended oxidation resulted in small single monosaccharide fragments that are known to be unable to associate with MHC II proteins (3, 11). These data indicate that carbohydrate oxidation yields protons as a reaction product, and that high proton concentration inhibits further oxidation and preserves appropriately sized fragments for MHC II presentation in a self-regulatory feedback mechanism.
FIGURE 9.

GlyAg oxidation releases protons and self-limits subsequent cleavage. GlyAg was dissolved in diH2O or PBS at 1 mg/ml and treated with ozone gas for 0, 15, 30, 45, or 60 min to induce oxidative cleavage. Each time point aliquot was analyzed for molecular mass on a Superdex 75 size-exclusion column and pH. A, When carbohydrate was oxidized in a nonbuffered solution (diH2O), the pH dropped to <5.0 within the first several minutes (inset), and this correlated to only modest cleavage following the acidic pH change and maintenance of fragments broadly averaging 9 kDa. B, When carbohydrate was oxidized in a buffered system (PBS), the pH remained above 6.0 for most of the time course (inset), and this correlated to dramatically increased cleavage that resulted in large concentrations of single monosaccharide fragments (EV = ~22 ml), which have never been detected in APC vesicles and are incapable of MHC II binding and presentation. These data revealed that GlyAg oxidation resulted in the rapid release of protons from the GlyAg, which inhibited further cleavage in a classical product-inhibition feedback manner.
Discussion
The results presented in this study reveal a number of important insights. Murine macrophages and dendritic cells responded to GlyAg stimulation through the production of NO. More importantly, the NO-driven oxidation of engulfed GlyAg led directly to the release of protons and ultimately endosomal acidification. The pH-sensitive probe LysoSensor Green showed that cells capable of producing NO have a strong correlation between GlyAg oxidation and vesicular acidification independent of resident proton pump activity, whereas NO-deficient cells failed to show acidified endosomal compartments. This relationship was detectable in both BafA-treated and untreated cells. In addition, the induction of NO alone via P3C-mediated TLR2 stimulation failed to generate acidic vesicles, demonstrating that GlyAg oxidation by NO was the key to the generation of acidic vesicular microenvironments.
The physiologic significance of these fundamental observations was assessed under three circumstances: conventional protein antigen processing, TLR9 signaling, and GlyAg processing. First, OVA processing was strongly inhibited by BafA treatment, yet was largely restored in WT but not NO-deficient cells after GlyAg incubation. These experiments conclusively demonstrate that GlyAg-induced acidification directly supports conventional protein Ag processing through activation of resident proteases. Second, CpG DNA stimulation of TLR9 resulting in TNFα production was eliminated with BafA treatment, but the TNFα response was restored to ~50% of that of BafA negative control cells when the BafA-treated cells were also incubated with GlyAg. These results show that GlyAg-induced acidification is sufficient to promote TLR9 signaling. Finally, in vitro oxidation of GlyAg revealed the release of protons as a reaction product, which lowered the pH of the local environment and inhibited further GlyAg cleavage. These data suggest a novel feedback mechanism of GlyAg oxidation via the release of protons into the endosomal compartment that protects the GlyAg epitope from complete degradation. Our findings point to a novel model in which capsular carbohydrate oxidation leads to vesicular acidification and subsequently promotes adaptive immune responses through the promotion of conventional Ag processing and negative regulation of GlyAg processing as well as innate immune responses against microbial DNA through TLR9 recognition and signaling.
The results described in this study are highly compatible with previous findings, as these classical immune mechanisms are known to be highly sensitive to pH. Most recently, TLR9-mediated TNFα production in response to microbial DNA was shown to be dependent on vesicular pH-sensitive proteolysis of the luminal TLR9 ectodomain (14, 15). Similarly, conventional protein Ag processing is triggered by acidic pH because of the proteolytic enzymes, such as the cathepsin family, which relies on low pH for activation (30–32). As a consequence, the observation that NO-mediated oxidation of endocytosed carbohydrate and the resulting low pH leads TLR9 signaling and OVA processing is in harmony with these mechanisms through the common link of acid-dependent proteolysis. These findings also provide an explanation for why GlyAg fragments <~4 kDa have never been reported within endosomal compartments (2, 3), because oxidation generally favors neutral or alkaline pH (33). This is a key point because fragments <4 kDa fail to trigger a T cell response (12), likely owing to their failure to associate with MHC II (11), thus providing specific functionality to the self-limiting nature of GlyAg oxidation in APCs.
Many microbes, including commensal organisms of the gut microbiota, are encapsulated by carbohydrates. Upon phagocytosis, these microbes are lysed through the action of oxidant molecules that cleave the surface polysaccharides into fragments. This results in the spilling of microbial contents, including nucleic acids and antigenic proteins, into the lumen of the endosome. This endosomal milieu is rich in potential immune targets, including GlyAgs—molecules that are recognized by PRR molecules such as TLR9 and microbial proteins that can be processed by proteases for MHC II loading and T cell activation. GlyAg molecules are known ligands of pattern recognition receptors (e.g., NOD, TLR) that initiate signaling cascades, which trigger the innate microbial clearance pathways and can shape the adaptive immune response (4). In addition, GlyAgs expressed by commensal organisms have been implicated in directing the maintenance of immune homeostasis within the gut. The B. fragilis GlyAg PSA was shown to normalize the TH1/TH2 imbalance found in gnotobiotic mice (34), whereas CD4+ T cells recognizing GlyAg via MHC II presentation (3) can downregulate inflammation in the IL-10−/− model of inflammatory bowel disease (35). It is clear from these studies that the importance of carbohydrates within the immune response is becoming more widely recognized as a critical portion of the overall immune response to microbes. Our findings show that the pathways surrounding GlyAg oxidation, protein processing and TLR9 signaling mechanistically intersect in the endosomal compartment because of pH, thus providing a novel view of the events immediately following oxidative death of encapsulated microbes via oxidation within phagocytes.
Although our findings are focused on NO-mediated oxidation, there is also strong corroborating data in the literature pointing to the general importance of oxidation and pH in the immune response. In agreement with our findings, the NADPH oxidase complex that produces superoxide is effective only at near-neutral pH, because a more neutral environment has been found to be more conducive to oxidation-mediated killing of pathogens (36). Interestingly, phagocytes isolated from chronic granulomatous disease (CGD) model mice, a primary immunodeficiency in which a genetic defect in the NADPH oxidase results in diminished reactive oxygen species production, have been shown to contain more acidic phagosomes than seen in normal WT cells and are thus unable to kill ingested pathogens (37–39) despite the presence of normal to high concentrations of NO (40, 41). Given our findings, it is not surprising that patients with CGD are particularly susceptible to infection by heavily encapsulated microbes (42, 43), including Staphylococcus aureus that carry T cell activating GlyAgs in their capsule (44) and Aspergillus species. Our model suggests that the lack of carbohydrate oxidation and cleavage at acidic pH in CGD directly contributes to decreased microbial killing and leads to a failure to provide MHC II and other PRR molecules with the agonists required for appropriate innate and adaptive immune responses.
The importance of achieving and maintaining a proper pH gradient along the endocytic pathway is also highlighted by findings that some pathogenic bacterial and fungal species can modulate vesicular acidification by various mechanisms as a means to circumvent detection and killing by immune cells. For example, Mycobacterium tuberculosis inhibits acidification and persists in phagosomes by preventing phagosomal maturation and the acquisition of the V-type adenosine triphosphatase (45–47). The pathogenic fungus Histoplasm capsulatum also inhibits acidification by preventing acquisition of the proton pump (48). If Helicobacter pylori crosses the gastric epithelium and undergoes phagocytosis, it can prevent vesicular acidification by expressing urease, which breaks urea down and buffers the vesicles carrying the bacteria to neutrality (46, 49). Other bacteria including Salmonella, Legionella pneumophilia, and Chlamydia can alter vesicular pH by blocking vesicular fusion and maturation (50–53). In all of these cases, it is conceivable that administration of GlyAg could induce microbicidal acidification within the endocytic pathway independent of the V-type adenosine triphosphatase and endosomal maturation, thereby assisting in the eradication of the resident pathogen.
We have found that NO-mediated oxidation of endocytosed carbohydrates leads to the release of protons that acidify the local endosomal environment, resulting in GlyAg epitope protection, conventional Ag retention and processing, and TLR9 signaling. Our model therefore provides important new insights into the induction of TLR9-dependent innate as well as protein and GlyAg-mediated adaptive immune responses to microbial products from heavily encapsulated pathogens. These insights may also point to a novel antibiotic approach for some intracellular pathogens.
Supplementary Material
Acknowledgments
We thank Alex Huang for use of an Imaris imaging suite workstation and many helpful discussions. We also thank Lori S. C. Kreisman and Derek W. Abbott for critical evaluation of this manuscript.
This work was suported by National Institutes of Health Grants AI062707 and OD004225 and Chronic Granulomatous Disorder Research Trust Grant J4G/06/01 (to B.A.C.).
Abbreviations used in this paper
- 1400W
N-[[3-(aminomethyl)phenyl]methyl]ethanimidamide, dihydrochloride
- BafA
bafilomycin A1
- BMDC
bone marrow-derived dendritic cell
- CGD
chronic granulomatous disease
- DAF-FM
4-amino-5methylamino-2′7′-difluorofluorescein diacetate
- em
emission
- ex
excitation
- GlyAg
glycoantigen
- iNOS
inducible NO synthase
- L-NAME
Nω-nitro-L-arginine methyl ester hydrochloride
- MHC II
MHC class II
- ND
not detected
- P3C
Pam3Csk4
- PSA
polysaccharide A from Bacteroides fragilis
- PM
peritoneal macrophage
- RAW
RAW 264.7
- ROI
region of interest
- PRR
pattern-recognition receptor
- unt
untreated
- WT
wild type
Footnotes
The online version of this article contains supplemental material.
Disclosures
The authors have no financial conflicts of interest.
References
- 1.Cobb BA, Kasper DL. Zwitterionic capsular polysaccharides: the new MHC II-dependent antigens. Cell Microbiol. 2005;7:1398–1403. doi: 10.1111/j.1462-5822.2005.00591.x. [DOI] [PubMed] [Google Scholar]
- 2.Velez CD, Lewis CJ, Kasper DL, Cobb BA. Type I Streptococcus pneumoniae carbohydrate utilizes a nitric oxide and MHC II-dependent pathway for antigen presentation. Immunology. 2009;127:73–82. doi: 10.1111/j.1365-2567.2008.02924.x. [DOI] [PMC free article] [PubMed] [Google Scholar]
- 3.Cobb BA, Wang Q, Tzianabos AO, Kasper DL. Polysaccharide processing and presentation by the MHC II pathway. Cell. 2004;117:677–687. doi: 10.016/j.cell.2004.05.001. [DOI] [PMC free article] [PubMed] [Google Scholar]
- 4.Wang Q, McLoughlin RM, Cobb BA, Charrel-Dennis M, Zaleski KJ, Golenbock D, Tzianabos AO, Kasper DL. A bacterial carbohydrate links innate and adaptive responses through Toll-like receptor 2. J Exp Med. 2006;203:2853–2863. doi: 10.1084/jem.20062008. [DOI] [PMC free article] [PubMed] [Google Scholar]
- 5.Brubaker JO, Li Q, Tzianabos AO, Kasper DL, Finberg RW. Mitogenic activity of purified capsular polysaccharide A from Bacteroides fragilis: differential stimulatory effect on mouse and rat lymphocytes in vitro. J Immunol. 1999;162:2235–2242. [PubMed] [Google Scholar]
- 6.Chung DR, Kasper DL, Panzo RJ, Chitnis T, Grusby MJ, Sayegh MH, Tzianabos AO, Chtinis T. CD4+ T cells mediate abscess formation in intra-abdominal sepsis by an IL-17-dependent mechanism. J Immunol. 2003;170:1958–1963. doi: 10.4049/jimmunol.170.4.1958. [DOI] [PubMed] [Google Scholar]
- 7.Tzianabos AO, Onderdonk AB, Rosner B, Cisneros RL, Kasper DL. Structural features of polysaccharides that induce intra-abdominal abscesses. Science. 1993;262:416–419. doi: 10.1126/science.8211161. [DOI] [PubMed] [Google Scholar]
- 8.Baumann H, Tzianabos AO, Brisson JR, Kasper DL, Jennings HJ. Structural elucidation of two capsular polysaccharides from one strain of Bacteroides fragilis using high-resolution NMR spectroscopy. Biochemistry. 1992;31:4081–4089. doi: 10.1021/bi00131a026. [DOI] [PubMed] [Google Scholar]
- 9.Duan J, Avci FY, Kasper DL. Microbial carbohydrate depolymerization by antigen-presenting cells: deamination prior to presentation by the MHC II pathway. Proc Natl Acad Sci USA. 2008;105:5183–5188. doi: 10.1073/pnas.0800974105. [DOI] [PMC free article] [PubMed] [Google Scholar]
- 10.Stephen TL, Niemeyer M, Tzianabos AO, Kroenke M, Kasper DL, Kalka-Moll WM. Effect of B7-2 and CD40 signals from activated antigen-presenting cells on the ability of zwitterionic polysaccharides to induce T-Cell stimulation. Infect Immun. 2005;73:2184–2189. doi: 10.1128/IAI.73.4.2184-2189.2005. [DOI] [PMC free article] [PubMed] [Google Scholar]
- 11.Kreisman LS, Friedman JH, Neaga A, Cobb BA. Structure and function relations with a T-cell-activating polysaccharide antigen using circular dichroism. Glycobiology. 2007;17:46–55. doi: 10.1093/glycob/cwl056. [DOI] [PMC free article] [PubMed] [Google Scholar]
- 12.Kalka-Moll WM, Tzianabos AO, Wang Y, Carey VJ, Finberg RW, Onderdonk AB, Kasper DL. Effect of molecular size on the ability of zwitterionic polysaccharides to stimulate cellular immunity. J Immunol. 2000;164:719–724. doi: 10.4049/jimmunol.164.2.719. [DOI] [PubMed] [Google Scholar]
- 13.Watts C, Powis S. Pathways of antigen processing and presentation. Rev Immunogenet. 1999;1:60–74. [PubMed] [Google Scholar]
- 14.Ewald SE, Lee BL, Lau L, Wickliffe KE, Shi GP, Chapman HA, Barton GM. The ectodomain of Toll-like receptor 9 is cleaved to generate a functional receptor. Nature. 2008;456:658–662. doi: 10.1038/nature07405. [DOI] [PMC free article] [PubMed] [Google Scholar]
- 15.Park B, Brinkmann MM, Spooner E, Lee CC, Kim YM, Ploegh HL. Proteolytic cleavage in an endolysosomal compartment is required for activation of Toll-like receptor 9. Nat Immunol. 2008;9:1407–1414. doi: 10.1038/ni.1669. [DOI] [PMC free article] [PubMed] [Google Scholar]
- 16.Lacraz S, Dayer JM, Nicod L, Welgus HG. 1,25-dihydroxyvitamin D3 dissociates production of interstitial collagenase and 92-kDa gelatinase in human mononuclear phagocytes. J Biol Chem. 1994;269:6485–6490. [PubMed] [Google Scholar]
- 17.Holsti MA, Chitnis T, Panzo RJ, Bronson RT, Yagita H, Sayegh MH, Tzianabos AO. Regulation of postsurgical fibrosis by the programmed death-1 inhibitory pathway. J Immunol. 2004;172:5774–5781. doi: 10.4049/jimmunol.172.9.5774. [DOI] [PubMed] [Google Scholar]
- 18.Tzianabos AO, Pantosti A, Baumann H, Brisson JR, Jennings HJ, Kasper DL. The capsular polysaccharide of Bacteroides fragilis comprises two ionically linked polysaccharides. J Biol Chem. 1992;267:18230–18235. [PubMed] [Google Scholar]
- 19.Gibson FC, 3rd, Onderdonk AB, Kasper DL, Tzianabos AO. Cellular mechanism of intraabdominal abscess formation by Bacteroides fragilis. J Immunol. 1998;160:5000–5006. [PubMed] [Google Scholar]
- 20.Rees DD, Palmer RM, Schulz R, Hodson HF, Moncada S. Characterization of three inhibitors of endothelial nitric oxide synthase in vitro and in vivo. Br J Pharmacol. 1990;101:746–752. doi: 10.1111/j.1476-5381.1990.tb14151.x. [DOI] [PMC free article] [PubMed] [Google Scholar]
- 21.Garvey EP, Oplinger JA, Furfine ES, Kiff RJ, Laszlo F, Whittle BJ, Knowles RG. 1400W is a slow, tight binding, and highly selective inhibitor of inducible nitric-oxide synthase in vitro and in vivo. J Biol Chem. 1997;272:4959–4963. doi: 10.1074/jbc.272.8.4959. [DOI] [PubMed] [Google Scholar]
- 22.Watts C. Capture and processing of exogenous antigens for presentation on MHC molecules. Annu Rev Immunol. 1997;15:821–850. doi: 10.1146/annurev.immunol.15.1.821. [DOI] [PubMed] [Google Scholar]
- 23.Presley JF, Mayor S, McGraw TE, Dunn KW, Maxfield FR. Bafilomycin A1 treatment retards transferrin receptor recycling more than bulk membrane recycling. J Biol Chem. 1997;272:13929–13936. doi: 10.1074/jbc.272.21.13929. [DOI] [PubMed] [Google Scholar]
- 24.Mellman I, Fuchs R, Helenius A. Acidification of the endocytic and exocytic pathways. Annu Rev Biochem. 1986;55:663–700. doi: 10.1146/annurev.bi.55.070186.003311. [DOI] [PubMed] [Google Scholar]
- 25.Harford J, Bridges K, Ashwell G, Klausner RD. Intracellular dissociation of receptor-bound asialoglycoproteins in cultured hepatocytes. A pH-mediated nonlysosomal event. J Biol Chem. 1983;258:3191–3197. [PubMed] [Google Scholar]
- 26.Gekle M, Mildenberger S, Freudinger R, Silbernagl S. Endosomal alkalinization reduces Jmax and Km of albumin receptor-mediated endocytosis in OK cells. Am J Physiol. 1995;268:F899–F906. doi: 10.1152/ajprenal.1995.268.5.F899. [DOI] [PubMed] [Google Scholar]
- 27.Bayer N, Schober D, Prchla E, Murphy RF, Blaas D, Fuchs R. Effect of bafilomycin A1 and nocodazole on endocytic transport in HeLa cells: implications for viral uncoating and infection. J Virol. 1998;72:9645–9655. doi: 10.1128/jvi.72.12.9645-9655.1998. [DOI] [PMC free article] [PubMed] [Google Scholar]
- 28.Xu J, Feng HT, Wang C, Yip KH, Pavlos N, Papadimitriou JM, Wood D, Zheng MH. Effects of Bafilomycin A1: an inhibitor of vacuolar H (+)-ATPases on endocytosis and apoptosis in RAW cells and RAW cell-derived osteoclasts. J Cell Biochem. 2003;88:1256–1264. doi: 10.1002/jcb.10477. [DOI] [PubMed] [Google Scholar]
- 29.Alberts B, Johnson A, Lewis J, Raff M, Roberts K, Walter P. Intracellular vesicular traffic. In: Gibbs S, editor. Molecular Biology of the Cell. Garland Science; New York: 2002. p. 712. [Google Scholar]
- 30.Plüger EB, Boes M, Alfonso C, Schröter CJ, Kalbacher H, Ploegh HL, Driessen C. Specific role for cathepsin S in the generation of antigenic peptides in vivo. Eur J Immunol. 2002;32:467–476. doi: 10.1002/1521-4141(200202)32:2<467::AID-IMMU467>3.0.CO;2-Y. [DOI] [PubMed] [Google Scholar]
- 31.Riese RJ, Wolf PR, Brömme D, Natkin LR, Villadangos JA, Ploegh HL, Chapman HA. Essential role for cathepsin S in MHC class II-associated invariant chain processing and peptide loading. Immunity. 1996;4:357–366. doi: 10.1016/s1074-7613(00)80249-6. [DOI] [PubMed] [Google Scholar]
- 32.Shi GP, Villadangos JA, Dranoff G, Small C, Gu L, Haley KJ, Riese R, Ploegh HL, Chapman HA. Cathepsin S required for normal MHC class II peptide loading and germinal center development. Immunity. 1999;10:197–206. doi: 10.1016/s1074-7613(00)80020-5. [DOI] [PubMed] [Google Scholar]
- 33.Morrison RT, Boyd RN. Organic Chemistry. Prentice Hall; Englewood Cliffs, NJ: 1992. [Google Scholar]
- 34.Mazmanian SK, Liu CH, Tzianabos AO, Kasper DL. An immunomodulatory molecule of symbiotic bacteria directs maturation of the host immune system. Cell. 2005;122:107–118. doi: 10.1016/j.cell.2005.05.007. [DOI] [PubMed] [Google Scholar]
- 35.Mazmanian SK, Round JL, Kasper DL. A microbial symbiosis factor prevents intestinal inflammatory disease. Nature. 2008;453:620–625. doi: 10.1038/nature07008. [DOI] [PubMed] [Google Scholar]
- 36.Segal AW. The function of the NADPH oxidase of phagocytes and its relationship to other NOXs in plants, invertebrates, and mammals. Int J Biochem Cell Biol. 2008;40:604–618. doi: 10.1016/j.biocel.2007.10.003. [DOI] [PMC free article] [PubMed] [Google Scholar]
- 37.Granzotto M, Leone V, Lepore L, Zerial M, Tommasini A, Ciambra R, Gombac F, Ventura A. Amantadine in chronic granulomatous disease. Pediatr Hematol Oncol. 2005;22:147–151. doi: 10.1080/08880010590907267. [DOI] [PubMed] [Google Scholar]
- 38.Mantegazza AR, Savina A, Vermeulen M, Perez L, Geffner J, Hermine O, Rosenzweig SD, Faure F, Amigorena S. NADPH oxidase controls phagosomal pH and antigen cross-presentation in human dendritic cells. Blood. 2008;112:4712–4722. doi: 10.1182/blood-2008-01-134791. [DOI] [PMC free article] [PubMed] [Google Scholar]
- 39.Odell EW, Segal AW. Killing of pathogens associated with chronic granulomatous disease by the non-oxidative microbicidal mechanisms of human neutrophils. J Med Microbiol. 1991;34:129–135. doi: 10.1099/00222615-34-3-129. [DOI] [PubMed] [Google Scholar]
- 40.Condino-Neto A, Muscará MN, Grumach AS, Carneiro-Sampaio MM, De Nucci G. Neutrophils and mononuclear cells from patients with chronic granulomatous disease release nitric oxide. Br J Clin Pharmacol. 1993;35:485–490. doi: 10.1111/j.1365-2125.1993.tb04174.x. [DOI] [PMC free article] [PubMed] [Google Scholar]
- 41.Tsuji S, Taniuchi S, Hasui M, Yamamoto A, Kobayashi Y. Increased nitric oxide production by neutrophils from patients with chronic granulomatous disease on trimethoprim-sulfamethoxazole. Nitric Oxide. 2002;7:283–288. doi: 10.1016/s1089-8603(02)00110-6. [DOI] [PubMed] [Google Scholar]
- 42.Heyworth PG, Cross AR, Curnutte JT. Chronic granulomatous disease. Curr Opin Immunol. 2003;15:578–584. doi: 10.1016/s0952-7915(03)00109-2. [DOI] [PubMed] [Google Scholar]
- 43.Shatwell KP, Segal AW. NADPH oxidase. Int J Biochem Cell Biol. 1996;28:1191–1195. doi: 10.1016/s1357-2725(96)00084-2. [DOI] [PubMed] [Google Scholar]
- 44.Tzianabos AO, Wang JY, Lee JC. Structural rationale for the modulation of abscess formation by Staphylococcus aureus capsular polysaccharides. Proc Natl Acad Sci USA. 2001;98:9365–9370. doi: 10.1073/pnas.161175598. [DOI] [PMC free article] [PubMed] [Google Scholar]
- 45.Sturgill-Koszycki S, Schlesinger PH, Chakraborty P, Haddix PL, Collins HL, Fok AK, Allen RD, Gluck SL, Heuser J, Russell DG. Lack of acidification in Mycobacterium phagosomes produced by exclusion of the vesicular proton-ATPase. Science. 1994;263:678–681. doi: 10.1126/science.8303277. [DOI] [PubMed] [Google Scholar]
- 46.Huynh KK, Grinstein S. Regulation of vacuolar pH and its modulation by some microbial species. Microbiol Mol Biol Rev. 2007;71:452–462. doi: 10.1128/MMBR.00003-07. [DOI] [PMC free article] [PubMed] [Google Scholar]
- 47.Crowle AJ, Dahl R, Ross E, May MH. Evidence that vesicles containing living, virulent Mycobacterium tuberculosis or Mycobacterium avium in cultured human macrophages are not acidic. Infect Immun. 1991;59:1823–1831. doi: 10.1128/iai.59.5.1823-1831.1991. [DOI] [PMC free article] [PubMed] [Google Scholar]
- 48.Strasser JE, Newman SL, Ciraolo GM, Morris RE, Howell ML, Dean GE. Regulation of the macrophage vacuolar ATPase and phagosome-lysosome fusion by Histoplasma capsulatum. J Immunol. 1999;162:6148–6154. [PubMed] [Google Scholar]
- 49.Schwartz JT, Allen LA. Role of urease in megasome formation and Helicobacter pylori survival in macrophages. J Leukoc Biol. 2006;79:1214–1225. doi: 10.1189/jlb.0106030. [DOI] [PMC free article] [PubMed] [Google Scholar]
- 50.Horwitz MA, Maxfield FR. Legionella pneumophila inhibits acidification of its phagosome in human monocytes. J Cell Biol. 1984;99:1936–1943. doi: 10.1083/jcb.99.6.1936. [DOI] [PMC free article] [PubMed] [Google Scholar]
- 51.Horwitz MA. The Legionnaires’ disease bacterium (Legionella pneumophila) inhibits phagosome-lysosome fusion in human monocytes. J Exp Med. 1983;158:2108–2126. doi: 10.1084/jem.158.6.2108. [DOI] [PMC free article] [PubMed] [Google Scholar]
- 52.Garcia-del Portillo F, Finlay BB. The varied lifestyles of intracellular pathogens within eukaryotic vacuolar compartments. Trends Microbiol. 1995;3:373–380. doi: 10.1016/s0966-842x(00)88982-9. [DOI] [PubMed] [Google Scholar]
- 53.Buchmeier NA, Heffron F. Inhibition of macrophage phagosome-lysosome fusion by Salmonella typhimurium. Infect Immun. 1991;59:2232–2238. doi: 10.1128/iai.59.7.2232-2238.1991. [DOI] [PMC free article] [PubMed] [Google Scholar]
Associated Data
This section collects any data citations, data availability statements, or supplementary materials included in this article.