Abstract
Micro-free flow electrophoresis (μFFE) is a separation technique that continuously separates analyte streams as they travel through an electric field applied perpendicularly to the flow in a microdevice. Application of the technique has been limited by the generation of electrolysis bubbles at the electrodes, which results in unstable flow paths through the device. The current paper introduces the use of surfactants and nonaqueous solvents in the carrier buffer as a means of increasing stability of separated analyte streams. Adding surfactant or nonaqueous solvents lowers the surface tension of the carrier buffer, which we hypothesize promotes the formation of smaller electrolysis bubbles. A 6-fold improvement in the standard deviation of analyte stream position was observed upon addition of 10 mM SDS. Likewise, an approximately 12-fold improvement in stability was observed upon addition of 300 μM Triton X-100. Similar stability improvements were found in carrier buffers containing nonaqueous solvents. An 8-fold improvement in stability was found with a carrier buffer containing 50% methanol and a 6-fold improvement was found with a carrier buffer containing 37.5% acetonitrile. Long term use was demonstrated with a carrier buffer containing 300 μM Triton X-100 in which separated analyte streams remained stable for nearly two hours.
Introduction
Free-flow electrophoresis (FFE) is an electrophoretic separation technique used to continuously separate a stream of charged analytes.1 Briefly, a sample is continuously streamed into a planar flow channel. An electric field is applied perpendicularly to the pressure driven flow and analyte streams are deflected laterally according to their mobility. Since its inception over fifty years ago,2, 3 FFE has been used to separate a wide range of analytes including cell populations,4-6 liposomes,7, 8 enzymes,9, 10 and proteins for proteomic applications.11-14
A drawback of conventional FFE is the significant Joule heating that results from the poor heat dissipation of the relatively large flow channel. This heating limits the potential that can be applied to 60-90 V/cm.15, 16 Miniaturization of FFE onto microscale formats, which increases the surface-area-to-volume ratio of the separation chamber, has proven to allow better heat dissipation than preparative scale FFE devices. Raymond et al.17 introduced the first μFFE device, fabricated in silicon, in 1994. This device demonstrated Joule heating improvements over preparative FFE devices, however the electrical breakdown voltage of this silicon device limited the potential that could be applied across the separation channel to 100 V. Since then, μFFE devices have been fabricated using substrates that accommodate higher field strengths including polydimethylsiloxane (PDMS),18 and glass.19, 20 Electric fields as high as 589 V cm−1 have been reported using an all glass device before significant Joule heating occurs.21
While miniaturizing FFE clearly minimizes Joule heating, heat dissipation has not proven to be the limiting factor in the practical implementation of μFFE devices. Instead the formation of bubbles at the electrode surface due to electrolysis has proven to be the most difficult issue. These bubbles disrupt the flow pattern and electric field in the device, giving rise to unpredictable analyte flow paths.22 Devices fabricated which do not incorporate design aspects to mediate the effect of electrolysis bubbles are limited to very low applied voltages. For example, Macounova et al.23, 24 and Lu et al.25 have recently reported such devices in which the applied voltage could not exceed 3 V before interference from electrolysis bubbles occurred.
Numerous design features aimed at controlling or removing electrolysis bubbles have been reported. Many early μFFE devices included arrays of microchannels fashioned to act as “membrane” barriers isolating the electrodes from the separation space,17-19, 26, 27 which were meant to mimic the ion-exchange membranes employed in conventional FFE devices. While these designs effectively prevented electrolysis bubbles from entering the separation space, the reduced cross sectional area of the membrane channels caused the majority of the applied potential to be experienced in the side channels, not the separation channel.18, 19 Photopolymerized acrylamide membranes have recently been incorporated into μFFE devices. Kohlheyer et al.28, 29 describe devices in which acrylamide membranes were used to isolate open electrode reservoirs from the separation space to enable ventilation of gas bubbles. Electrolysis bubbles did not enter the separation space and voltage efficiencies of 40-60% were reported using these devices. A similar result was achieved by de Jesus et al.30 using acrylamide membranes in side reservoirs and a complex module for separated electrolysis (MSE). An MSE acts to separate the electrodes from the separation space by containing them in an electrolyte-filled syringe connected to side reservoirs via polyethylene tubing. The authors reported continuous operation with an electric field of 192 V cm−1 in the separation channel for 3 hours without disturbances from electrolysis bubbles. Isolation of the electrodes using multiple depth designs has proven to be one of the simplest methods for decreasing electrolysis bubble interference while maintaining high voltage efficiencies. Fonslow and Bowser introduced a multiple depth design in which the electrode channels were four times deeper than the separation chamber resulting in a linear flow velocity over the electrodes that was 16 times greater than that in the separation channel, which effectively washed away electrolysis bubbles without interfering with the separation.20,21 Kobayashi et al.31 have also reported a multiple depth design in which the electrodes are isolated by shallow side banks running along the edge of the separation space.
While much effort has been made to design devices that are better equipped to handle the formation of electrolysis bubbles while keeping the voltage efficiency high, there has been less success removing or controlling electrolysis bubbles through buffer modification. Kohlheyer et al.32 have reported bubble-free operation of a μFFE device by adding a redox couple, quinhydrone, to the flow streams near the electrodes. The oxidation and reduction of the redox couple generates the electrical current without formation of electrolysis bubbles. While this approach was successful in improving the resolution of separated analyte streams, local pH changes near the electrodes due to the oxidation and reduction of the redox species caused a pH gradient to form across the separation chamber.
Decreasing the surface tension of aqueous buffers has been shown to have favorable effects on minimizing bubble size during electrolysis. For example, addition of surfactant to aqueous buffers has been shown to decrease the size of bubbles generated at electrode surfaces.33 Addition of an organic solvent has produced similar results.34, 35 Likewise, addition of surfactant or organic solvent has been shown to stabilize bubbles and increase coalescence time,36, 37 effectively keeping smaller bubbles from combining into larger ones. In this work, we examine the effect of two surfactants (anionic sodium dodecyl sulfate and nonionic Triton X-100) and two organic solvents (methanol and acetonitrile) on the stability of flow streams in a μFFE device.
Experimental
Chemicals and reagents
Deionized water (18.3 MΩ, Barnstead, Dubuque, IA) was used for all buffer and sample preparations. HPLC-grade methanol (≥99.9%) was obtained from Sigma-Aldrich (St. Louis, MO). HPLC-grade acetonitrile (≥99.8%) was obtained from Mallinckrodt (Paris, KY). HEPES was obtained from Alfa Aesar (Heysham, Lancashire, UK) in 99% purity. Triton X-100 and sodium dodecyl sulfate (SDS, ~99%) were obtained from Sigma-Aldrich. Buffers were adjusted to appropriate pH by addition of 50% NaOH obtained from Sigma-Aldrich. Aqueous buffers were vacuum filtered through a 0.2 μm nitrocellulose membrane filter (Fisher Scientific, Fairlawn, NJ) before use. Disodium fluorescein (Acros Organics, NJ), rhodamine 123 chloride (Sigma-Aldrich), and rhodamine 110 (Sigma-Aldrich) were prepared in 190 proof ethanol (Fisher Scientific) and diluted in separation buffer. Piranha solutions (4:1 H2SO4/H2O2)(Ashland Chemical, Dublin, OH) were used to clean glass wafers and etch unwanted Ti. GE-6 (Acton Technologies, Inc., Pittston, PA) was used to etch unwanted Au. Concentrated HF (49%)(Ashland Chemical) was used to etch the glass wafers. Silver conductive epoxy (MG Chemicals, Surrey, BC, Canada) was used to make electrical connections to the μFFE device.
Chip fabrication
A multiple depth μFFE chip was fabricated as previously described.20 Briefly, 58 μm deep electrode channels were etched into a 1.1 mm borofloat wafer (Precision Glass & Optics, Santa Ana, CA) using standard photolithography techniques. A second photolithography procedure defined the remaining features, leaving a 20 μm deep × 1 cm wide × 2.5 cm long separation channel and 78 μm deep electrode channels. A 150 nm thick layer of Ti was deposited by a Temescal electron beam evaporator, followed by a 150 nm thick layer of Au. A final photolithography and etching procedure was used to remove the unwanted Ti and Au to define the electrodes. A second wafer with pre-drilled access holes and a ~90 nm thick layer of amorphous silicon (aSi) was aligned with the featured wafer and anodically bonded (900 V, 3 h, 450 °C, 5 μbar) using a Karl Suss SB-6 wafer bonder (Munich, Germany). Nanoports (IDEX, Oak Harbor, WA) were attached over access holes for fluidic connections. Silver conductive epoxy was used to attach lead wires to the electrodes. The chip was perfused with 1M NaOH to remove aSi from the channels.
Separation conditions
Syringe pumps (Harvard Apparatus, Holliston, MA) were used to pump separation buffer through the chip at a flow rate of 0.4 mL/min (~0.13 cm/sec in the separation channel) and sample into the sample inlet at 50 nL/min (~0.12 cm/sec in the separation channel). SDS and Triton X-100 stability studies were performed with 150 V applied to the right electrode while the left electrode was held at ground. Long term Triton X-100 studies were performed with an applied voltage of 40 V. Methanol and acetonitrile stability studies were performed with an applied voltage of 75 V. 25 mM HEPES at pH 7.00 was used for SDS and Triton X-100 experiments. 10 mM HEPES at pH 7.50, 10 mM HEPES in methanol at pH* 7.50, and 10 mM HEPES in 75:25 acetonitrile/water at pH* 7.50 were used in the mixed solvent experiments. (Note: pH values listed for methanol and acetonitrile solutions are apparent values as measured by a pH meter and are only used to ensure reproducibility of the preparation) Aqueous and nonaqueous buffers were mixed to yield the following ratios: water/methanol (100/0, 85/15, 70/30, 50/50, 30/70, 15/85, 0/100) and water/acetonitrile (100/0, 88.75/11.25, 77.5/22.5, 62.5/37.5, 52.5/47.5, 25/75). Sample consisted of fluorescein (250 nM), rhodamine 123 (250 nM), and rhodamine 110 (125 nM) diluted in separation buffer. Rhodamine 123 was excluded from Triton X-100, methanol, and acetonitrile stability studies to simplify data analysis.
Instrumentation, data collection and processing
The separation channel was imaged using a QuantEM:512SC CCD camera (Photometrics, Tucson, AZ) attached to a SMZ1500 stereomicroscope (Nikon Corp., Tokyo, Japan) with a 1.6x objective lens. The microscope was equipped with an Endow GFP bandpass emission filter cube (Nikon Corp.) containing two bandpass filters (450-490 and 500-550 nm) and a dichroic mirror with a 495 nm cutoff. The microscope was focused (0.75x zoom) on a region ~1.4 cm downstream from the sample inlet. Laser induced fluorescence (LIF) detection performed using a 150 mW, Argon-ion laser (Melles Griot, Carlsbad, CA) expanded into a ~2.5 cm × ~150 μm line across the separation channel. The entire instrument setup was enclosed in black, rubberized fabric (Thorlabs, Newton, NJ). Micromanager software with Image J was used for imaging (camera gain 3, intensity 1000) and linescan acquisition. All linescans were one pixel in width. During SDS stability studies, images were recorded every 500 milliseconds for approximately 3.75 min. During long term Triton X-100 studies, images were acquired every 30 seconds for 2 hours. During Triton X-100, methanol, and acetonitrile stability studies, images were acquired every 250 milliseconds for approximately 3.75 minutes. The exposure time was varied to ensure a strong signal. Linescan data was processed using an in-house made LabView program. Individual linescans were analyzed using Cutter 7.0.38
Results and discussion
Surfactants
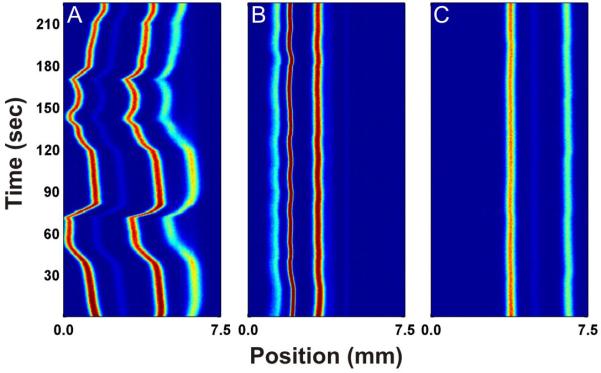
Figure 1A is a 2-D contour diagram that plots the linescans of multiple μFFE separations recorded over time. In this case 800 linescans were recorded over a period of approximately 4 minutes. This format is useful for tracking variations in μFFE stream position over time. The erratic behavior of the stream positions shown in Figure 1A is typical of those observed under conditions where electrolysis bubbles are forming at the electrodes. Formation of a bubble restricts flow on one side of the device shifting the analyte streams in opposite direction. Clearance of the bubble removes the restriction causing a sudden shift of the streams back to their original position. Once bubbles start to form in the system this behavior is random making prediction of stream position extremely difficult.
Fig 1.
Figure 1B shows the same μFFE separation with the addition of 10 mM SDS to the carrier buffer. Note that the addition of SDS increased the ionic strength of the buffer, increasing current in the device from 0.35 mA without SDS to 0.74 mA with 10 mM SDS. This increase in current means electrolysis increased two-fold with the addition of SDS, yet the stream positions remained stable. Figure 1C shows the same separation conditions where SDS is replaced with 300 μM Triton X-100, a non ionic surfactant. Again, the positions of the analyte streams remain constant throughout the course of the analysis. The addition of a nonionic surfactant like Triton X-100 does not change the conductivity of the carrier buffer, but does act to lower the surface tension. Intuitively, nonionic surfactants seem to be the best option for improving the stability of analyte streams because they lower the surface tension of the carrier buffer without increasing the overall conductivity.
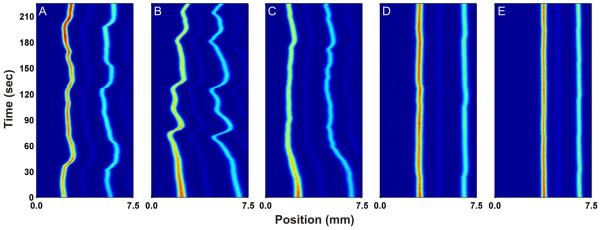
Figure 2 shows the effect of increasing Triton X-100 concentration on the separation of two fluorescent dyes (rhodamine 110 and fluorescein). Figure 2A shows the separation without Triton X-100 in the carrier buffer. The positions of the analyte streams shift erratically throughout the course of the analysis. The addition of 5 μM Triton X-100 to the carrier buffer (Figure 2B) does not have a significant effect on analyte stream stability. Figure 2C shows the separation with the addition of 30 μM Triton X-100 to the carrier buffer. There is a noticeable improvement in stream stability as compared to Figures 2A and 2B. After an initial shift in position over the first minute of separation time, the analyte streams show only minor fluctuations in position over the remaining three minutes. Figure 2D shows the separation with the addition of 100 μM Triton X-100 to the carrier buffer. Clearly, the addition of 100 μM Triton X-100 improves the stability of the analyte streams significantly compared to separation conditions with no added surfactant. Figure 2E shows the separation upon the addition of 300 μM Triton X-100 to the carrier buffer. The stability of the analyte streams improves even further with almost no fluctuations in position. 1500 μM Triton X-100 was also tested (data not shown) and yielded a similar result to that as shown in Figure 2E.
Fig 2.
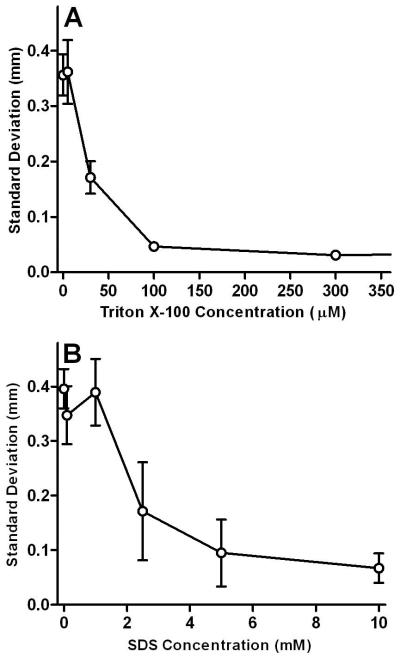
The standard deviation of the position of the fluorescein stream over a period of 4 minutes (800 consecutive linescans) was plotted versus Triton X-100 concentration in Figure 3A. Clearly, stream position stabilizes with increasing Triton X-100 concentrations up to approximately 100-300 μM. This corresponds well with the reported critical micelle concentration (CMC) of 240 μM for Triton X-100.39, 40 It is well known that addition of surfactant to aqueous solutions decreases surface tension as the concentration approaches the CMC.41 Jańczuk et al. have measured the relationship between Triton X-100 concentration and surface tension in aqueous solutions.42 They demonstrated a dramatic reduction in surface tension at Triton X100 concentrations near the CMC (10-1000 μM). This is in excellent agreement with the range of Triton X-100 concentrations that yielded the most improvement in analyte stream stability. We hypothesize that this reduction of surface tension promotes formation of smaller bubbles which have less effect on the stability of the analyte streams. At concentrations above the critical micelle concentration (CMC) the surface tension of the carrier buffer no longer decreases and stability doesn’t show further improvement. It should be noted that the standard deviation recorded at 1500 μM Triton X-100 (not shown) is not statistically different from the data point at 300 μM at a 95% confidence level, indicating that the stability of the analyte streams is independent of surfactant concentration above the CMC.
Fig 3.
A similar plot of standard deviation versus concentration of SDS is shown in Figure 3B. The reported CMC of SDS in pure water is 8 mM.43, 44 Lunkenheimer et al. have demonstrated that surface tension of aqueous solutions decreases as SDS concentration increases from 1 to 10 mM.45 Again, this is in excellent agreement with the range of SDS concentrations where improvement in stream stability was observed. At concentrations above their respective CMCs, the standard deviation of the fluorescein stream in a carrier buffer containing Triton X-100 is approximately 50% lower than that of fluorescein in an SDS-containing carrier buffer. The data clearly suggests that Triton X-100 is a better option for increasing the stability of separated analyte streams when compared to SDS due to the lower current generated and the lower amount of additive required to achieve stable flow streams.
Mixed Solvents
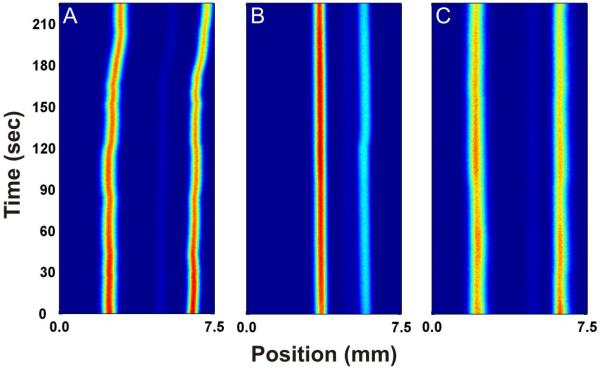
If the hypothesis that it is a reduction in surface tension that is the key parameter in minimizing the effect of electrolysis bubbles is valid then changing the buffer solvent should have a similar effect. Increasing the nonaqueous fraction in a mixed aqueous/nonaqueous carrier buffer decreases the surface tension of the buffer, similar to adding a surfactant.46 Figure 4A shows the separation of two fluorescent dyes, rhodamine 110 and fluorescein, in 10 mM HEPES at pH 7.50 in water. The position of the analyte streams slowly drifts towards the cathode throughout the separation. Figure 4B is recorded using the same separation conditions as in Figure 4A but with 10 mM HEPES in 50:50 water/methanol at an apparent pH of 7.50. The stability of the analyte streams improves greatly compared to the aqueous carrier buffer, showing only minor fluctuations in position over the course of 4 minutes. It is clear that the addition of methanol to the carrier buffer has a significant effect on improving the stability of the analyte streams. Similar experiments were performed with acetonitrile as the nonaqueous component. Figure 4C shows the same separation conditions as in Figure 4A but with 10 mM HEPES in 62.5/37.5 water/acetonitrile at an apparent pH of 7.50 as the carrier buffer. Again, the positions of the analyte streams become more stable than in pure aqueous carrier buffer.
Fig 4.
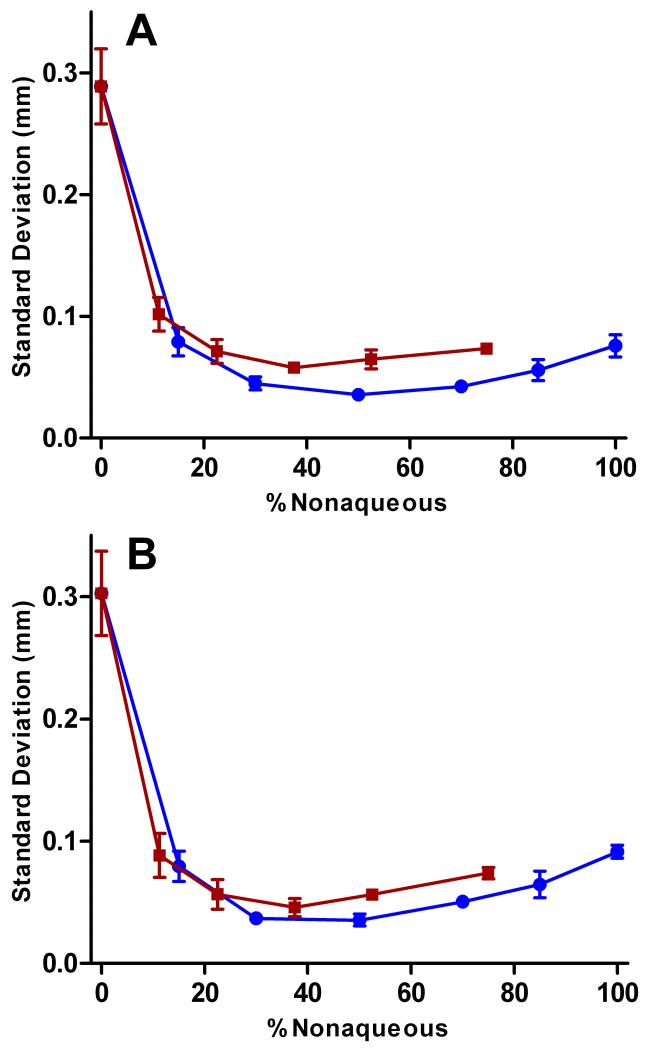
Figure 5 shows plots of standard deviation of peak position versus percentage of nonaqueous component in the carrier buffer for rhodamine 110 (A) and fluorescein (B). Increasing the methanol fraction (blue trace) in the carrier buffer improves the stability of the analyte streams until a 50:50 water/methanol mixture has been reached. The stability of the analyte streams worsens slightly as the methanol fraction is increased further, up to 100% methanol. The reason for this may be that methanol has a lower electrolysis potential than water, assuming the current density remains constant.47 Even though the surface tension of the carrier buffer continues to decrease, the lower electrolysis potential of methanol makes it easier for electrolysis bubbles to form, decreasing analyte stream stability.
Fig 5.
A similar trend is observed with increasing percentage of acetonitrile in the carrier buffer (red traces in Figure 5). After an initial improvement in stability with the addition of 11.25% acetonitrile to the carrier buffer, the data remained fairly constant up to 75% acetonitrile. Data was not collected above 75% due to the limited solubility of HEPES in acetonitrile. The data suggests that addition of even relatively small fractions of nonaqueous solvent to the carrier buffer (~12-15%) achieves significant improvements in stream stability. Only minimal gains are observed as the nonaqueous fraction is increased further.
Long Term Stability
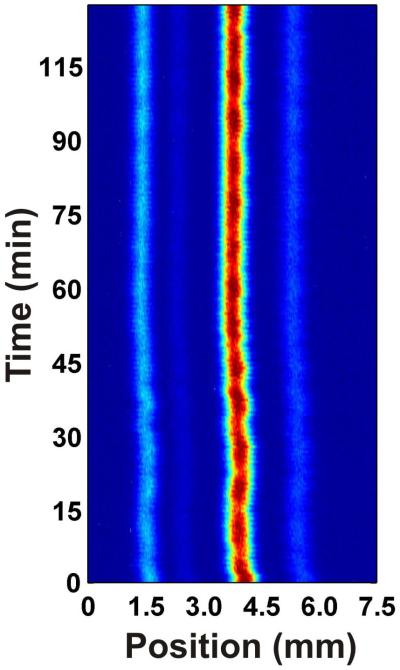
In order for μFFE to reach its full potential as a monitoring or microscale preparative device, it is essential that long-term separation stability be achieved. To date, stable μFFE separations have been demonstrated over a periods of minutes but longer separations have proven problematic.22 Figure 6 shows the separation of three fluorescent dyes (rhodamine 123, rhodamine 110, fluorescein) recorded over the course of approximately 2 hours in 25 mM HEPES at pH 7.00 with 300 μM Triton X-100 included in the carrier buffer. The analyte streams remain stable throughout the separation, with no major fluctuations in position. The ability to keep analyte streams in a constant position for prolonged periods of time opens up many possible uses for this device. Experiments requiring long-term monitoring are now possible with the addition of Triton X-100 to aqueous carrier buffers. Also, the ability to keep separated analyte streams stable lends itself to micropreparative separations. Macro-scale FFE is used primarily for fractionation of complex samples and it now seems reasonable that μFFE could offer similar preparative options on a much smaller scale.
Fig 6.
Conclusions
Lowering the surface tension of the carrier buffer dramatically improves the stability of analyte streams in μFFE. Addition of surfactants such as SDS or Triton X-100 to the aqueous carrier buffer improved the stability of the separated analyte streams. The nonionic surfactant Triton X-100 proved to stabilize the analyte streams more effectively than SDS, most likely due to the lower surface tension of aqueous Triton X-100 solutions and its nonionic nature, which doesn’t increase the conductivity of the carrier buffer. The addition of methanol or acetonitrile to the carrier buffer had similar stabilizing effects. Addition of fractions of nonaqueous solvent above approximately 12% has been shown to improve the stability of analyte streams when compared to pure aqueous carrier buffers.
Acknowledgements
Funding for this research has been provided by the National Institutes of Health (grants GM 063533 and NS 043304).
References
- 1.Roman MC, Brown PR. Anal. Chem. 1994;66:86A–94A. [Google Scholar]
- 2.Barrollier J, Watzke E, Gibian H. Z. Naturforschung. 1958;13B:754–755. [PubMed] [Google Scholar]
- 3.Hannig K. Z. fuer Anal. Chem. 1961;181:244–254. [Google Scholar]
- 4.Zeiller K, Loeser R, Pascher G, Hannig K. Hoppe-Seyler’s Z. Physiol. Chem. 1975;356:1225–1244. doi: 10.1515/bchm2.1975.356.2.1225. [DOI] [PubMed] [Google Scholar]
- 5.Graham JM, Wilson RBJ, Patel K. Methodol. Surv. Biochem. Anal. 1987;17:143–152. [Google Scholar]
- 6.Heidrich HG, Hannig K. Methods Enzymol. 1989;171:513–531. doi: 10.1016/s0076-6879(89)71028-4. [DOI] [PubMed] [Google Scholar]
- 7.De Cuyper M, Joniau M, Dangreau H. Biochem. Biophys. Res. Commun. 1980;95:1224–1230. doi: 10.1016/0006-291x(80)91604-6. [DOI] [PubMed] [Google Scholar]
- 8.Kessler R, Manz H-J. Electrophoresis. 1990;11:979–980. doi: 10.1002/elps.1150111119. [DOI] [PubMed] [Google Scholar]
- 9.Hoffstetter-Kuhn S, Wagner H. Electrophoresis. 1990;11:451–456. doi: 10.1002/elps.1150110603. [DOI] [PubMed] [Google Scholar]
- 10.Nath S, Schuette H, Weber G, Hustedt H, Deckwer WD. Electrophoresis. 1990;11:937–941. doi: 10.1002/elps.1150111110. [DOI] [PubMed] [Google Scholar]
- 11.Poggel M, Melin T. Electrophoresis. 2001;22:1008–1015. doi: 10.1002/1522-2683()22:6<1008::AID-ELPS1008>3.0.CO;2-A. [DOI] [PubMed] [Google Scholar]
- 12.Zischka H, Weber G, Weber PJA, Posch A, Braun RJ, Buehringer D, Schneider U, Nissum M, Meitinger T, Ueffing M, Eckerskorn C. Proteomics. 2003;3:906–916. doi: 10.1002/pmic.200300376. [DOI] [PubMed] [Google Scholar]
- 13.Zuo X, Lee K, Speicher DW. Proteome Analysis. 2004:93–118. [Google Scholar]
- 14.Wang Y, Hancock WS, Weber G, Eckerskorn C, Palmer-Toy D. J. Chromatogr. A. 2004;1053:269–278. [PubMed] [Google Scholar]
- 15.Clifton MJ, Jouve N, De Balmann H, Sanchez V. Electrophoresis. 1990;11:913–919. doi: 10.1002/elps.1150111106. [DOI] [PubMed] [Google Scholar]
- 16.Hoffmann P, Wagner H, Weber G, Lanz M, Caslavska J, Thormann W. Anal. Chem. 1999;71:1840–1850. doi: 10.1021/ac981178v. [DOI] [PubMed] [Google Scholar]
- 17.Raymond DE, Manz A, Widmer HM. Anal. Chem. 1994;66:2858–2865. [Google Scholar]
- 18.Zhang C-X, Manz A. Anal. Chem. 2003;75:5759–5766. doi: 10.1021/ac0345190. [DOI] [PubMed] [Google Scholar]
- 19.Fonslow BR, Bowser MT. Anal. Chem. 2005;77:5706–5710. doi: 10.1021/ac050766n. [DOI] [PubMed] [Google Scholar]
- 20.Fonslow BR, Bowser MT. Anal. Chem. 2008;80:3182–3189. doi: 10.1021/ac702367m. [DOI] [PMC free article] [PubMed] [Google Scholar]
- 21.Fonslow BR, Barocas VH, Bowser MT. Anal. Chem. 2006;78:5369–5374. doi: 10.1021/ac060290n. [DOI] [PubMed] [Google Scholar]
- 22.Turgeon RT, Bowser MT. Electrophoresis. 2009;30:1342–1348. doi: 10.1002/elps.200800497. [DOI] [PMC free article] [PubMed] [Google Scholar]
- 23.Macounova K, Cabrera CR, Holl MR, Yager P. Anal. Chem. 2000;72:3745–3751. doi: 10.1021/ac000237d. [DOI] [PubMed] [Google Scholar]
- 24.Macounova K, Cabrera CR, Yager P. Anal. Chem. 2001;73:1627–1633. doi: 10.1021/ac001013y. [DOI] [PubMed] [Google Scholar]
- 25.Lu H, Gaudet S, Schmidt MA, Jensen KF. Anal. Chem. 2004;76:5705–5712. doi: 10.1021/ac049794g. [DOI] [PubMed] [Google Scholar]
- 26.Raymond DE, Manz A, Widmer HM. Anal. Chem. 1996;68:2515–2522. doi: 10.1021/ac950766v. [DOI] [PubMed] [Google Scholar]
- 27.Xu Y, Zhang C-X, Janasek D, Manz A. Lab on a Chip. 2003;3:224–227. doi: 10.1039/b308476k. [DOI] [PubMed] [Google Scholar]
- 28.Kohlheyer D, Besselink GAJ, Schlautmann S, Schasfoort RBM. Lab Chip. 2006;6:374–380. doi: 10.1039/b514731j. [DOI] [PubMed] [Google Scholar]
- 29.Kohlheyer D, Eijkel JCT, Schlautmann S, van den Berg A, Schasfoort RBM. Anal. Chem. 2007;79:8190–8198. doi: 10.1021/ac071419b. [DOI] [PubMed] [Google Scholar]
- 30.de Jesus DP, Blanes L, do Lago CL. Electrophoresis. 2006;27:4935–4942. doi: 10.1002/elps.200600137. [DOI] [PubMed] [Google Scholar]
- 31.Kobayashi H, Shimamura K, Akaida T, Sakano K, Tajima N, Funazaki J, Suzuki H, Shinohara E. J. Chromatogr. A. 2003;990:169–178. doi: 10.1016/s0021-9673(02)01964-7. [DOI] [PubMed] [Google Scholar]
- 32.Kohlheyer D, Eijkel JCT, Schlautmann S, van den Berg A, Schasfoort RBM. Anal. Chem. 2008:4111–4118. doi: 10.1021/ac800275c. [DOI] [PubMed] [Google Scholar]
- 33.Brandon NP, Kelsall GH. J. Appl. Electrochem. 1985;15:475–484. [Google Scholar]
- 34.Blandamer MJ, Franks F, Haywood KH, Tory AC. Nature. 1967;216:783–784. [Google Scholar]
- 35.Venczel J. Electrochim. Acta. 1970;15:1909–1920. [Google Scholar]
- 36.Giribabu K, Ghosh P. Chem. Eng. Sci. 2007;62:3057–3067. [Google Scholar]
- 37.Jamialahmadi M, Mueller-Steinhagen H. Chem. Eng. J. 1992;50:47–56. [Google Scholar]
- 38.Shackman JG, Watson CJ, Kennedy RT. J. Chromatogr. A. 2004;1040:273–282. doi: 10.1016/j.chroma.2004.04.004. [DOI] [PubMed] [Google Scholar]
- 39.Helenius A, Simons K. Biochim. Biophys. Acta. 1975;415:29–79. doi: 10.1016/0304-4157(75)90016-7. [DOI] [PubMed] [Google Scholar]
- 40.Goheen SC, Matsor RS. J. Amer. Oil Chem. Soc. 1989;66:994–997. [Google Scholar]
- 41.Tadros TF, editor. Surfactants. Academic Press; London: 1984. [Google Scholar]
- 42.Jańczuk B, Bruque JM, González-Martín ML, Dorado-Calasanz C. Langmuir. 1995;11:4515–4518. [Google Scholar]
- 43.Tartar HV. J. Colloid Sci. 1959;14:115–122. [Google Scholar]
- 44.Oko UN, Venable RL. J. Colloid Interface Sci. 1971;35:53–59. [Google Scholar]
- 45.Lunkenheimer K, Czichocki G, Hirte R, Barzyk W. Colloids and Surfaces A: Physiochemical and Engineering Aspects. 1995;101:187–197. [Google Scholar]
- 46.Zdziennicka A. Journal of Colloid and Interface Science. 2009;335:175–182. doi: 10.1016/j.jcis.2009.03.038. [DOI] [PubMed] [Google Scholar]
- 47.Surampudi S, Narayanan SR, Vamos E, Frank H, Halpert G, LaConti A, Kosek J, Surya Prakash GK, Olah GH. Journal of Power Sources. 1994;47:377–385. [Google Scholar]


