Abstract
The regulation of Rho GTPase activities and expression is critical in the development and function of the kidney. Rho GTPase activities and cytosol-membrane cycling are regulated by Rho GDP Dissociation Inhibitor (RhoGDI), and RhoGDI knockout mice develop defects in kidney structure and function that lead to death due to renal failure. It is therefore important to understand the changes in RhoGDI-regulated Rho GTPase activities and cell morphology that lead to kidney failure in RhoGDI (−/−) mice.
Here, we characterize a renal mesangial cell line derived from the RhoGDI (−/−) mouse in which we verify the absence of GDI proteins. In the absence of RhoGDI, we show an increase in the specific activity of Rac1, and to a lesser extent, RhoA and Cdc42 GTPases in these cells. This is accompanied by a compensatory decrease in the steady-state protein levels of Rho GTPases. Morphological analysis of RhoGDI (−/−) mesangial cells reveals a decrease in cell spreading and in focal contacts compared to wild-type cells. Finally, RhoGDI (−/−) mesangial cells show a decreased ability to proliferate and survive. These functional and structural changes are likely to contribute to the defects in renal architecture and function observed in the RhoGDI (−/−) mouse.
Keywords: Rho GTPases, kidney, actin cytoskeleton
1. Introduction
The Rho GTPases have pivotal roles in regulating cytoskeletal organization, cell adhesive interactions, cell polarity, morphogenesis, migration, vesicle trafficking, cell cycle progression, transcriptional activity, and cell growth or death in all eukaryotic cells [1], [2], [3] and [4]. The defining members of the Rho GTPase family are strongly linked to changes in the filamentous actin system, regulating the formation of membrane ruffles/lamellipodia (Rac1), stress fibers (RhoA), filopodia (Cdc42) and the assembly of focal adhesions and associated structures [3], [5].
As a consequence of their varied biological activities, Rho GTPases play critical roles in the development, maintenance, and function of the kidney. During kidney development, Rac1, RhoA, and Cdc42 are required for normal formation and function of kidney epithelial layers and tubules, including organization of adherens and tight junctions [6], [7]. Rac1 and RhoA are also required for renewal and maintenance of renal epithelia, including morphology and polarity, in the adult kidney [8]. RhoA activation mediates proliferation of vascular endothelial cells associated with an alloimmune-induced chronic allograft nephropathy [9]. Rac and Rho function is also implicated in the etiology of renal fibrosis, being necessary for transcriptional upregulation of connective tissue growth factor by TGF-beta [8], [10]. The ROK inhibitor Y-27632 reduces tubulointerstitial fibrosis in a mouse unilateral ureteral obstruction model [11]. RhoA upregulation occurs in the renal cortex of diabetic rats [12], and during hypoxia in renal cell carcinoma [13]. Kidney ischemia and reperfusion are associated with increases in renal Rac1 expression and the Rac-dependent formation of reactive oxygen species [14], [15] .
Consistent with the importance of Rho GTPase activity to kidney function, it has been established that the integrity of the actin cytoskeleton is of critical import for maintenance of renal glomerular architecture by mesangial cells, as well as the normal glomerular filtration function by podocytes [16], [17], [18] and [19]. Podocytes are renal glomerular capillary epithelial cells that contribute unusual structural and functional properties to maintain the selective permeability barrier of the renal glomerulus [16], [19]. Accumulating evidence indicates that the actin cytoskeleton modulates podocyte and mesangial cell survival and recovery from injury, regulates cell properties critical to the architecture of the slit diaphragm, and controls filtration function in response to changing blood flow and pressure (reviewed in [16], [18], [19] and [20]). Mutations affecting podocyte adhesion/signaling proteins, such as nephrin, lead to cytoskeletal rearrangement, disruption of the filtration barrier (effacement), leakage of critical plasma proteins into the urine, and subsequent renal disease [18]. Cytoskeletal reorganization and/or stabilization appear to be effective in promoting recovery from effacement injury [18], [20].
The dynamics of Rho GTPase action are regulated by both an activity cycle and a cytosol-to-membrane cycle [21]. Rho GTPases are activated by the exchange of GDP for ambient GTP stimulated by guanine nucleotide exchange factors (GEFs) and are inactivated by hydrolysis of GTP to GDP catalyzed by GTPase-activating proteins (GAPs). Importantly, this activity cycle is regulated by guanine nucleotide dissociation inhibitors (GDIs), which act to sterically shield the Rho GTPases from the action of GEFs and GAPs. Thus for Rho GTPases to become active, it is believed that they must first be released from GDIs in order for membrane-associated GEFs to catalyze activation. Superimposed on this activity cycle is a cytosol/membrane cycle that determines the interaction of GTPases with their effectors, and which is directly controlled by GDIs [21], [22]. GDIs for Rho GTPase thus play critical regulatory roles in controlling Rho GTPase activity and function.
Three human GDIs have been identified: RhoGDI (or RhoGDIα) is the most abundant and ubiquitously expressed [23], [24]. It forms 1:1 cytosolic complexes with most Rho GTPases. In contrast, D4GDI (or RhoGDIβ) is abundantly expressed primarily in hematopoietic tissues [25], [26], while RhoGDIγ is specifically expressed in lung, brain and testis [27], [28]. Unlike the two other GDIs, RhoGDIγ is associated with vesicular membranes and exhibits specificity for interactions with RhoB and RhoG. In general, the cytosolic GDIs (RhoGDI and D4GDI) exhibit several activities (reviewed in [21], [22] and [29]): 1) They inhibit the dissociation of GDP from Rho GTPases, maintaining the Rho GTPases in an inactive form and sterically preventing Rho GTPase activation by GEFs. 2) They interact (with lower affinity) with the GTP-bound form of the Rho GTPases to inhibit GTP hydrolysis, thereby blocking both intrinsic and GAP-catalyzed GTPase activity and preventing interactions with effector targets. 3) RhoGDI and D4GDI modulate the cytosol/membrane cycle of Rho GTPases. These proteins maintain individual Rho GTPases as soluble cytosolic proteins by forming high affinity complexes in which the GTPase geranylgeranyl C-terminal membrane-targeting moiety is masked by insertion into a hydrophobic pocket within the immunoglobulin-like domain of RhoGDI [30], [31], [32], [33], [34] and [35]. When Rho proteins are released from GDIs, they insert into the plasma membrane through their isoprenylated C terminus, where they can be activated by membrane-associated GEFs to initiate association with effector targets. A re-association with GDIs, possibly resulting from GTP hydrolysis, is postulated to promote inactivation by recycling of the Rho GTPase back into the cytosol. Trafficking of Rho GTPases to the cell membrane and their activation/deactivation is thus a highly complex process. There is evidence that the mis-regulation of GDIs contributes to many diseases, including renal disease.
Mice lacking RhoGDI show morphological and functional defects in the kidney [36]. Their kidneys are characterized by age-related histological abnormalities, including cystic dilation of the proximal and distal renal tubules, flattening and detachment of epithelial cells from the tubular basement membrane, glomerular sclerosis, disrupted glomerular podosomes, and increased infiltration of inflammatory cells. Renal function is progressively impaired, including decreases in creatinine clearance, polyuria and proteinuria, and renal failure leading to death.
The knockout mouse data clearly indicate that RhoGDI acts as a crucial regulatory point for Rho GTPase activity in the kidney. It is surprising that, given the ubiquitous roles of RhoGDI in Rho GTPase regulation in many other tissues, that the RhoGDI (−/−) mouse exhibits primarily defects in renal function. It is therefore important to begin to understand the roles of RhoGDI in regulating Rho GTPase activity and cell morphology that lead to kidney failure in RhoGDI (−/−) mice. With this in mind, we characterize here a renal mesangial cell line derived from the RhoGDI (−/−) mouse, demonstrating biochemical and morphological changes that may account for detrimental effects on renal function observed in the RhoGDI knockout mouse.
2. Materials and Methods
2.1 Cell Culture
RhoGDI (−/−) mesangial cells [37], isolated from RhoGDI (−/−) mouse kidney [36], were provided by Dr. John Sedor and Dr. Amy Wilson-Delfosse (Case Western Reserve University, Cleveland, OH), with permission from Dr. Yoshimi Takai. Both wildtype (WT) and RhoGDI (−/−) (KO) cells were cultured in RPMI medium 1640 1x Gibco 21870 (Invitrogen) without L-glutamine containing 8.5% v/v fetal bovine serum (Germini), 8.5% bovine calf serum (SAFC Biosciences) and supplements: 50 U/ml penicillin, 50 µg/ml streptomycin, 2 mM HEPES, 2 mM L-glutamine (Invitrogen) and ITS liquid media supplement (100x) (Sigma). The cells were cultured in dishes coated with fibronectin (1 mg protein/ml in 0.5 M NaCl, 0.05 M Tris, pH 7.5, Sigma Aldrich) at a dilution 1:100 in 1x PBS, 1 hour at 37°C before use or on poly-L-lysine (P-1274, Sigma Aldrich), prepared according to Sigma Aldrich protocol, at 37°C, 5% CO2. Growing cells were split every three days and discarded within 30 passages to ensure that the phenotype of the cell population was maintained.
2.2 Western blot analysis
Whole cell extracts were prepared by washing the cells once with 1x PBS before disruption in cold lysis buffer (25 mM Tris, pH 7.4, 5 mM MgCl2, 150 mM NaCl, 20% glycerol, 1% NP40) supplemented with 1 mM leupeptin, 1 mM pepstatin A, 1 mM aprotinin, 1 mM sodium orthovanadate, and 1 mM PMSF. Lysates were clarified by centrifugation at 13,000 g, and the supernatant, containing the same amount of protein determined by BCA™ Protein Assay Kit after manufacturer’s protocol (Pierce), was subjected to 12% SDS-PAGE, transferred onto Hybond™-C Extra nitrocellulose membrane (Amersham Biosciences), and subsequently incubated in blocking buffer (50 mM Tris, pH8; 2 mM CaCl2; 80 mM NaCl and 5% milk powder) for 1 hour at RT, then appropriate antibodies applied overnight at 4°C. Anti-Rac (23A8), used in a dilution 1:500 and anti-Rho (−A,−B,−C) clone 55 (1:1000) were from Upstate. Anti-RhoGDI (A-20, sc-360) at 1:200, anti-RhoA (sc-418) at 1:1000 dilution, and anti-Cdc42 (sc-87) at 1:200 were from Santa Cruz. Anti-actin (clone 4) at 1: 30,000 or 1:60,000 was from MP Biomedicals, while RhoGDI R922 (1:5000) and D4GDI R975 (1:5000) were produced in-house.
Bound antibodies were visualized with horseradish peroxidase-conjugated anti-rabbit or anti-goat IgG, F(ab’)2-specific from Pierce using enhanced chemiluminescence (Amersham Pharmacia Biotech) and autoradiography (Genesee Scientific). Analysis of the Western blots was done by intensity measurements: Comparison of band intensities between WT and KO of the same immunoblot at the same protein concentration was done by measuring the ratio of sample band intensity to the actin control band within the same lane, and normalizing it to the ratio of the WT sample.
2.3 PBD and RBD affinity-based GTPase activity assays
Rac1 and Cdc42 activity were determined using the PBD-based pull down assay based upon co-precipitation with the GST (glutathione S-transferase)-tagged Rac1/Cdc42-binding domain of PAK, p21-activated kinase, (produced in-house), as previously described [38]. The RBD-based pull down assay to detect RhoA activity was essentially performed as described in [39]. For pulldowns, cells at ~90% confluency were lysed in binding buffer (25 mM Tris pH 7.5, 40 mM NaCl, 30 mM MgCl2, 1 % NP40, 10 µg/ml leupeptin, 10 µg/ml aprotinin, 1 mM PMSF) for Rac1-GTP or Cdc42-GTP, and (50 mM Tris-HCl, pH 7.5, 100 mM NaCl, 2 mM MgCl2, 10% glycerol, 1% NP-40, 1 mM PMSF) for RhoA, and cleared by centrifugation at 13,000 g for 30 min. A fraction of the cleared lysates was analyzed by Western blot with anti-α-actin as a loading control. 500–1000 µg of total protein was incubated with PBD or RBD beads for 1 h at 4°C with rotation. Subsequently, the beads were washed four times in binding buffer, boiled in 4x SDS sample buffer, and separated by 12 % SDS-PAGE, followed by immunoblotting with specific antibody for Rac1, Cdc42 or RhoA.
2.4 Immunofluorescence microscopy and analysis
RhoGDI (+/+) and (−/−) mesangial cells were plated on fibronectin-coated coverslips (15mm, Erie Scientific Company) in a 12 multiwell plate (Becton Dickinson) overnight at 37°C, 5% CO2. The cells were fixed in warm 4% paraformaldehyde for 10 minutes at 37°C and then permeabilized with warm 0.5% Triton X-100 in PBS for 10 minutes at 37°C, followed by 3% BSA blocking buffer for 1 hour at RT. Fluorescence microscopy was performed with the following antibodies: α-paxillin (BD Biosciences) (1:500 dilution) was used to visualize focal adhesions and focal complexes, α-tubulin (Sigma-Aldrich) (1:1000) for microtubules. The coverslips were subjected to a 1-hour incubation with fluorochrome-conjugated secondary antibody from Molecular Probes, Alexa-568 (red),−488 (green),−350 (blue) goat-anti mouse IgG for monoclonal primary antibodies and goat-anti-rabbit for polyclonal primary antibodies, at a dilution of 1:250 in 1% BSA. Additional actin staining with Alexa Fluor 488/568 (1:200) or 350 (1:10)-labeled phalloidin, 20 minutes at RT, and nuclear DAPI staining (1:3000), 10 minutes at RT, was performed after the secondary antibody. Cells were mounted with Prolong® Gold antifade reagent (Molecular Probes, Invitrogen) on glass slides (Fisher Scientific) and kept in the dark o/n. Samples were analyzed on an epifluorescence microscope (Nikon, Melville, NY; Eclipse TE2000U; 40x oil immersion objective), and images were processed using Metamorph software, version 6.1 (Universal Imaging, Downington, PA).
Morphological characterization was performed by quantifying three sizes of lamellipodia (small, <30 pixel; medium, 30–100 pixel; large, >100 pixel) and two sizes of extensions (short, <50 pixel; long, >50 pixel) from the cell structures observed. Cells were also classified into three phenotypic categories: lamellipodia-rich cells, stress fibre-rich cells, and contracted cells. An average of 10 random cells, from each of the six experiments, were scored using these categories. Focal contacts were characterized by shape (> 0.09), pixel area (>100 pixel) and length (> 20 pixel). The number of focal contacts (adhesions plus complexes) per cell was counted. The results for this analysis are based on three experiments, with an average of 100 cells counted per experiment.
2.5 Adhesion and viability assay
Cells were fixed in 4% PFA on fibronectin-coated coverslips after the indicated time points, 30 minutes, 2-hour, 5-hour and overnight, then stained with Alexa (488/568/350) fluorochrome–labeled phalloidin (Molecular Probes) in order to visualize the F-actin cytoskeleton. Samples were viewed and photographed using a 40x (oil) immersion objective, and processed with Metamorph software. Cell spreading was measured by threshold area, with an average of 100 cells per time point scored.
Cell viability was routinely determined by counting the number of trypan blue (1:2 dilution) (Invitrogen)-stained and -unstained cells on either fibronectin or poly L-lysine, in an improved Neubauer hemocytometer (Reichert, Buffalo, NY) in triplicate daily for a period of 6 days. Verification by MTT assay was as in [40].
3. Results
3.1 Absence of compensatory changes of GDI expression in renal mesangial cells derived from the RhoGDI (−/−) mouse
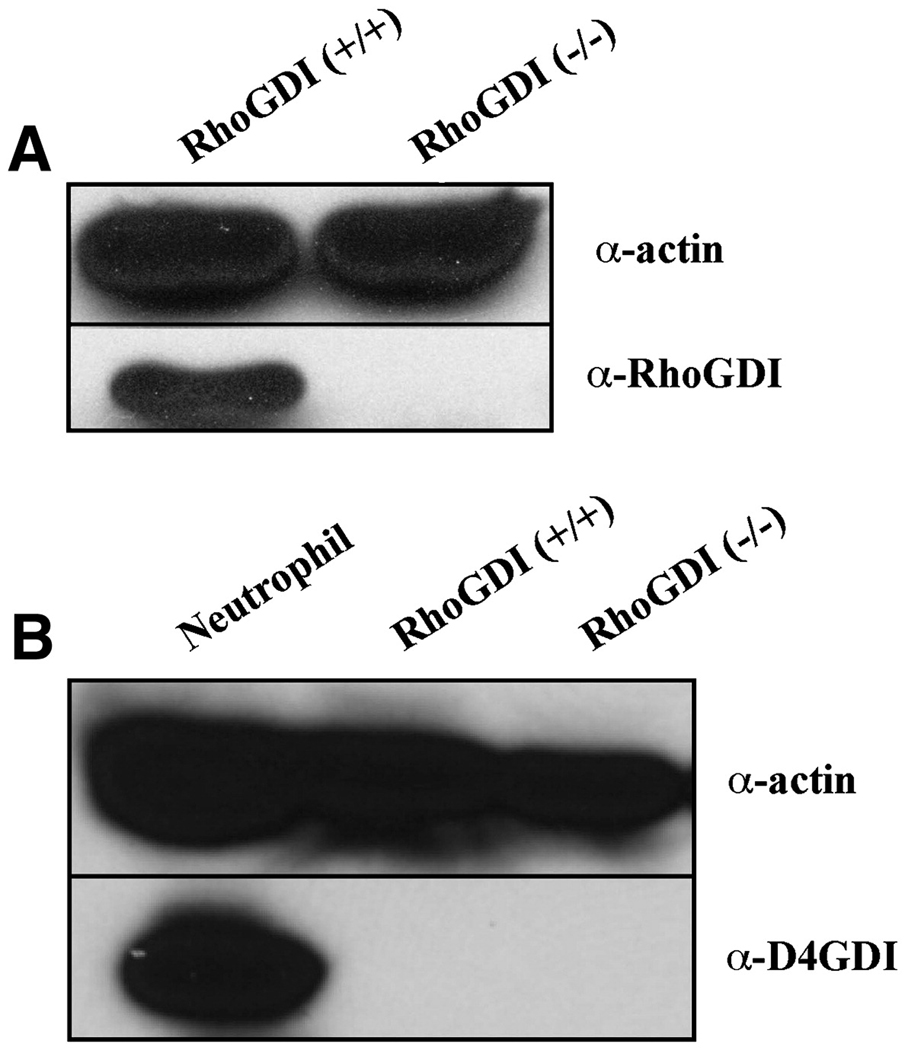
A renal mesangial cell line derived from the RhoGDI (−/−) mouse [36] was obtained for these studies [37]. In Figure 1A, we verified that RhoGDI was completely absent at the protein level from the RhoGDI (−/−) mesangial cells. To preclude the possibility that the changes observed in the RhoGDI-deficient cells were due to the aberrant upregulation or downregulation of the expression of the two other known GDI isoforms, RhoGDIβ/D4GDI and RhoGDIγ, we compared their expression levels in wild-type and RhoGDI (−/−) mesangial cells by western blot. While D4GDI expression was measurably robust in a neutrophil extract, it was virtually undetectable in the mesangial cells, independent of the expression of RhoGDI (Fig. 1B). Likewise, we saw no difference in the levels of RhoGDIγ between the control and RhoGDI (−/−) mesangial cells (data not shown).
Figure 1. RhoGDI expression levels in RhoGDI (−/−) and RhoGDI (+/+) (wild-type) mesangial cells (MSCs).
Total protein lysates from RhoGDI (+/+) MSCs, RhoGDI (−/−) MSCs and neutrophils were analyzed by Western blotting using [A] anti-RhoGDIα (28kD), [B] anti-D4GDI (28kD) antibodies. RhoGDIβ/D4GDI expression was verified to be undetectable in RhoGDI (−/−) but not (+/+) lysates. Equal protein lysate loading was assayed by immunoblotting the same membranes for α-actin (44kDa) (top panels). These results are representative of three independent experiments.
3.2 Morphological and cytoskeletal phenotype of RhoGDI (−/−) mesangial cells
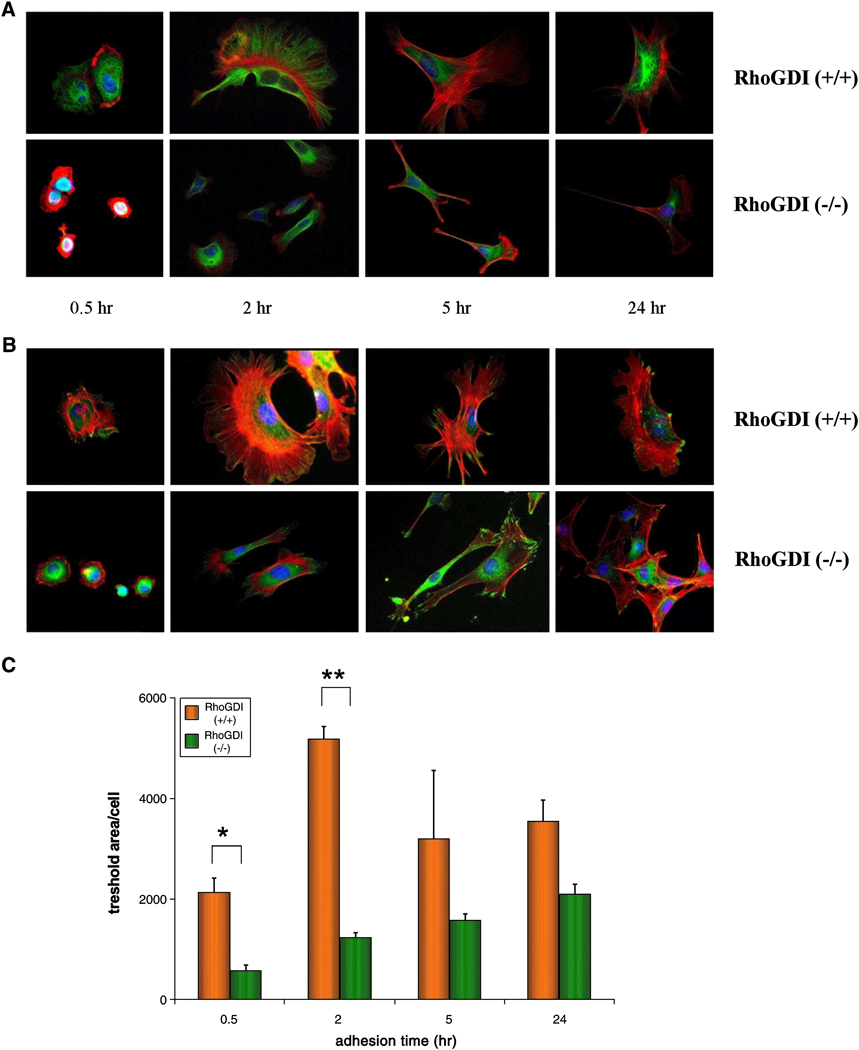
The progressive degeneration of kidney function in RhoGDI (−/−) mice correlates with significant histological abnormalities in the intraglomerular mesangium [36]. We compared the properties of the RhoGDI (−/−) mesangial cells to wild-type mesangial cell line grown in culture. Many cell types (eg. fibroblasts) in culture respond to surfaces coated with extracellular matrix (ECM) proteins, such as fibronectin, by adhering and spreading, and in so doing acquire a flattened morphology. This process, involving complex dynamic rearrangements of the actin cytoskeleton, is mediated by integrin signaling via Rho GTPases [41]. Using a standard culturing protocol for mesangial cells [37], the cells were trypsinized and allowed to spread on coverslips coated with fibronectin for different time periods, as indicated in Figure 2. Subsequently, the cells were stained with Alexa 568-phalloidin to detect F-actin structures, and with DAPI to label the nucleus. To visualize microtubules and focal complexes/adhesions at the various time points, cells were additionally immunostained with anti-tubulin (Fig. 2A) or anti-paxillin antibodies (Fig. 2B), respectively.
Figure 2. Aberrant cell spreading phenotype in RhoGDI (−/−) mesangial cells in comparison to wild-type.
After plating on fibronectin-coated glass coverslips, RhoGDI (−/−) and RhoGDI (+/+) mesangial cells were fixed at 30 min, 2 hr, 5 hr and overnight (24h). Actin filaments [A,B] were stained with fluorophore-labeled phalloidin (red) while nuclei [A,B] were stained with DAPI (blue). Microtubules [A] and focal contacts [B] were visualized by anti-α-tubulin (green) and anti-α-paxillin (green) immunostaining, respectively. [C] To quantify cell spreading, thresholded cell areas were measured over time. RhoGDI (−/−) cells spread significantly less at time points of 30 minutes (p < 0.05) and 2 hr (p < 0.01). The results represent mean +/− SD of three independent experiments.
A time-course of spreading for wild-type mesangial cells showed extensive multidirectional spreading accompanied by highly dynamic lamellipodia formation, reaching its peak within two hours and dissipating significantly by 24 hour after adhesion (Fig. 2C). The same phenotype was not observed in RhoGDI (−/−) mesangial cells. Notably, the knockout cells appeared to undergo much less spreading than the control cells, and the spreading that did occur was by means of narrow membrane extensions instead of by the typical broad lamellipodia observed in the wild-type cells (Fig. 2A,B; see also Fig. 4).
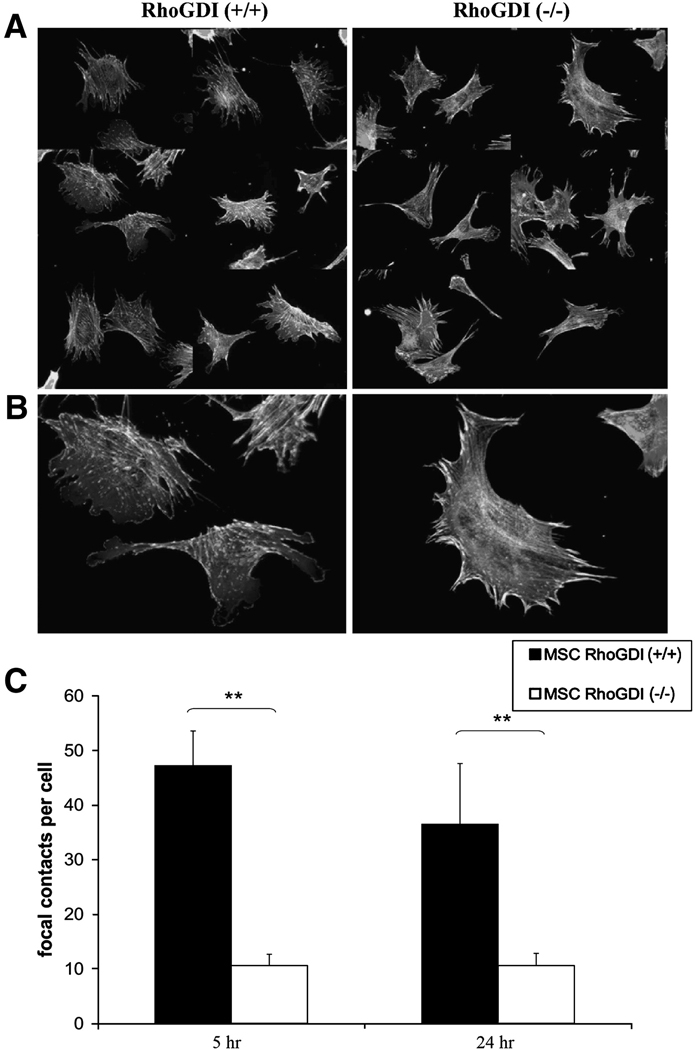
Figure 4. Loss of focal complexes in RhoGDI (−/−) mesangial cells.
Cells cultured overnight on fibronectin were stained for F-actin (red) and paxillin (green) to identify focal contacts. Randomly-selected populations of RhoGDI (−/−) and wild-type (+/+) mesangial cells are shown [A, low magnification; B, high magnification]. [C] RhoGDI (−/−) mesangial cells exhibit reduced numbers of focal contacts per cell at 5 hr and 24 hr post-adhesion to fibronectin-coated coverslips. Samples were analyzed on an epifluorescence microscope with 40x oil immersion objective and processed as described in Materials and Methods. Results shown are the mean +/− SD of three independent experiments (**, p < 0.01, from student t-test).
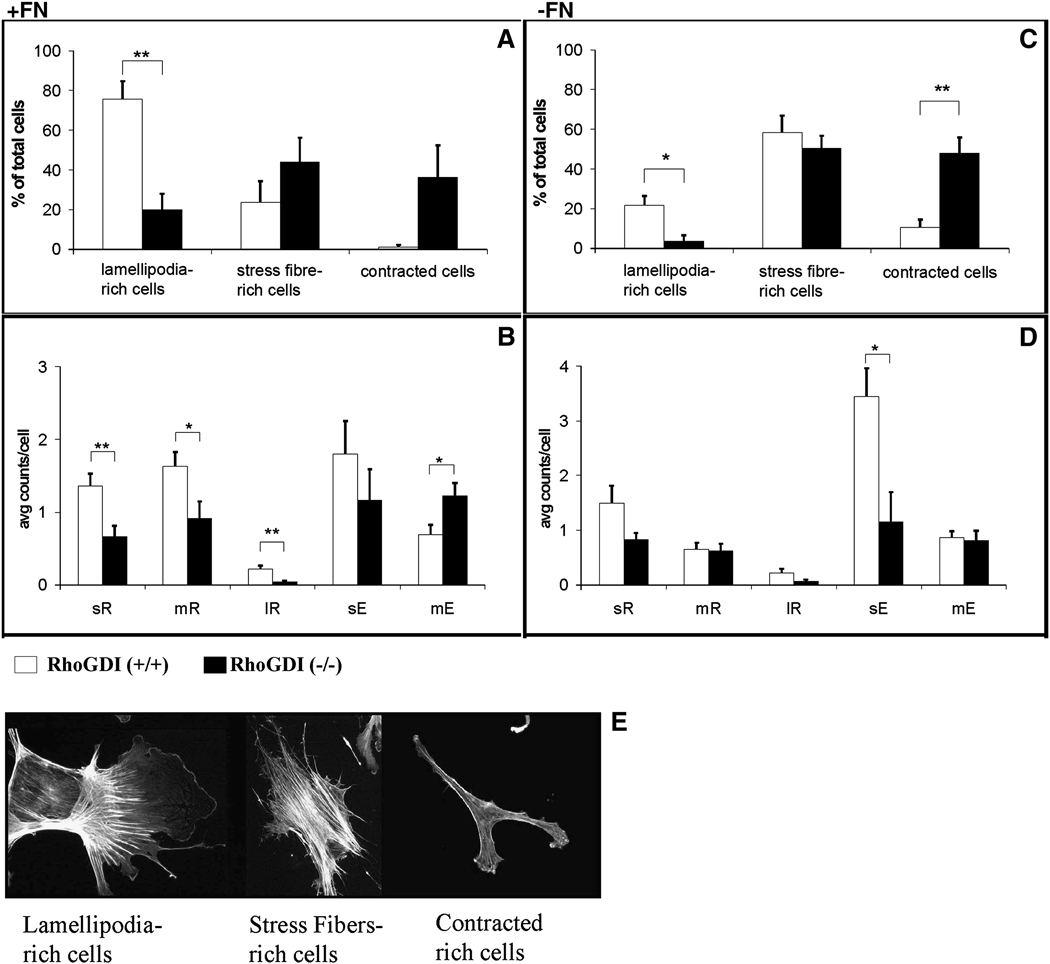
In the presence of a fibronectin matrix, almost 80% of wild-type mesangial cells grown in serum were rich in lamellipodia (Fig. 3A and 3E). Under the same conditions, a rather small percentage of RhoGDI (−/−) cells (20%) possessed lamellipodia, whereas a larger percentage (~40%) exhibited a contracted phenotype (Fig. 3A and 3E). When wild-type mesangial cells were cultured in the absence of fibronectin, the phenotype changed to predominantly internal actin stress fibers (60% of the cells), and the percentage of lamellipodia-rich cells was concomitantly reduced (Fig. 3C and 3E). RhoGDI (−/−) mesangial cell populations in the absence of fibronectin also exhibited a reduction in lamellipodia-positive cells (Fig. 3C and 3E). However, apart from a slight increase in the proportion of contracted cells, the RhoGDI (−FN) knockout cell phenotype did not change much overall from that seen in the presence of fibronectin.
Figure 3. Morphological analysis of RhoGDI (−/−) and wild-type (+/+) mesangial cell populations.
Mesangial cells were plated on coverslips, cultured overnight, and stained for F-actin with fluorophore-labeled phalloidin. Cells grown on fibronectin [A,B] or in its absence [C,D] were analyzed for lamellipodia (ruffles) and extension length. By visual inspection, cells were categorized as: lamellipodia-rich, stress-fibre-rich, or contracted [A,C] – examples of each phenotype are shown in [E]. RhoGDI (−/−) and wild-type (+/+) mesangial cell populations were additionally sub-characterized based on extension length [B,D]. (Abbreviations: sR: small ruffles (10 – 30 pixel length); mR: medium ruffles (30 – 100 pixel length); lR: large ruffles (> 100 pixel length); sE: small extensions (10 – 50 pixel length); lE: large extensions (> 100 pixel length). The results represent mean +/− SD of six independent experiments. (*, p < 0.05; **, p < 0.01, from student t-test).
Mesangial cell morphology was analyzed in further detail by sub-categorizing cells based on the size of the lamellipodia (small ruffles, sR; medium ruffles, mR; and large ruffles, lR) and filopodia-like structures (small extensions, sE; medium extensions, mE). Independent of the presence of fibronectin, all three-size categories of lamellipodia were less prominent in RhoGDI (−/−) mesangial cells compared to wild-type cells (Fig. 3B,D). In contrast, the loss of RhoGDI had a more complex effect on the size distribution of filopodia-like structures in mesangial cells. On fibronectin, while RhoGDI (−/−) mesangial cells exhibited a decrease in small filopodia extensions, there existed an increase in medium extension formation relative to wild-type cells (Fig. 3B). In the absence of fibronectin, however, there was no difference in the average number of medium-length filopodia when comparing RhoGDI knockout cells with control cells (Fig. 3D). This suggests that in addition to regulating lamellipodia formation, the presence of RhoGDI may also determine filopodia extension length depending on the presence or absence of extracellular cues.
In agreement with the generally more contracted morphology of the RhoGDI (−/−) mesangial cells, actin stress fibers also predominated in the knockout cells (Fig. 3A,C). Correlating with this phenotype, a decreased number of dynamic focal complexes were observed in RhoGDI (−/−) mesangial cells when compared to wild-type cells (Fig. 4). Either at 5 hour or 24 hour, there was a significant reduction in total focal contacts (focal complexes plus focal adhesions) in the RhoGDI (−/−) cells (Fig.4C). However, in the knockout cells, the focal contacts present were more likely to take the form of stable focal adhesions (see Fig. 2B). Since focal complexes are associated with cell movement, and in general turn over more rapidly than focal adhesions, these results suggest a possible explanation for the decreased spreading observed in RhoGDI null cells (Fig. 2C).
3.4 Changes in Rho GTPase activities in RhoGDI (−/−) mesangial cells
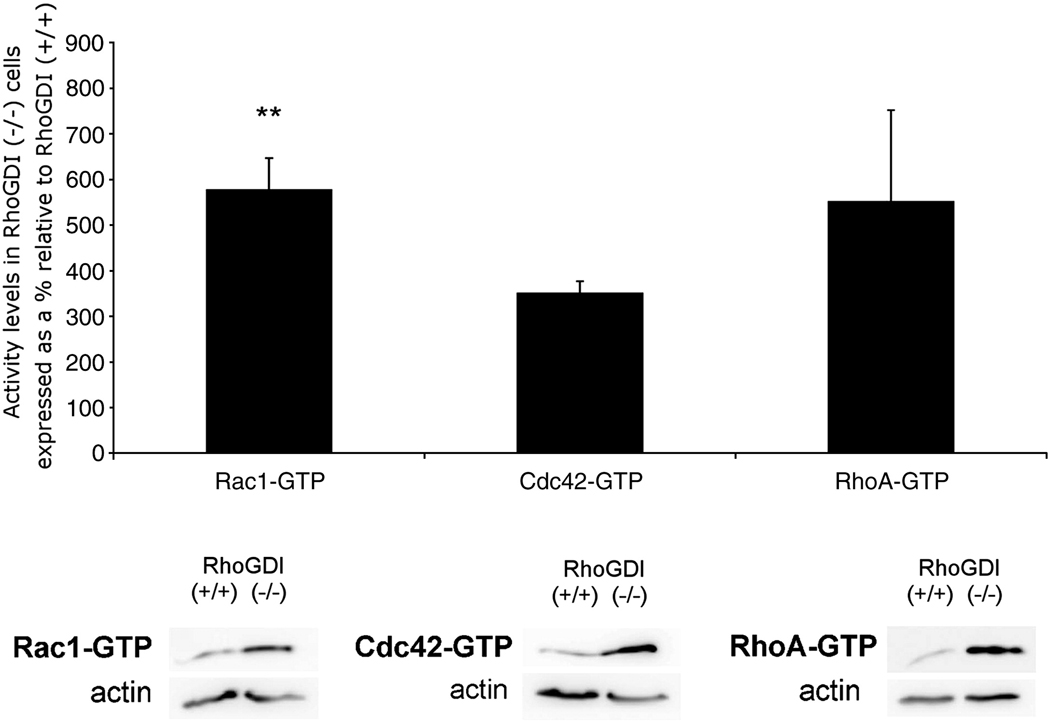
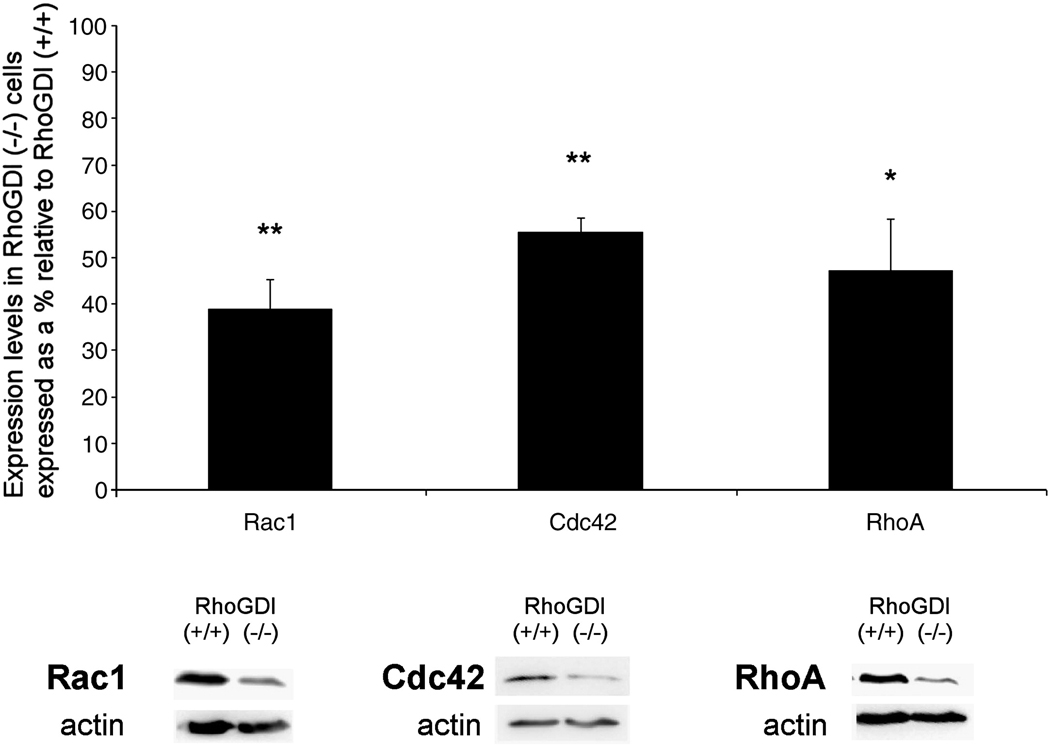
The alterations in cell morphology and actin dynamics observed in RhoGDI (−/−) mesangial cells are likely mediated, at least in part, by RhoGDI-dependent regulation of Rho family GTPases, such as Rac1 (lamellipodia), RhoA (stress fibers) and Cdc42 (filopodia). We investigated this using standard Rho GTPase activity affinity-based pull-down assay [38], [42]. We observed that total cellular Rac1 activity was significantly increased in RhoGDI null cells as compared to control cells (Fig. 5). The specific activity of Rac1 was even more dramatically increased, as we observed that the endogeneous levels of Rac1 were substantially lower in RhoGDI (−/−) cells compared to wild-type (Fig. 6). We also observed increases in Cdc42 and RhoA activity (Fig. 5). As with Rac1, this was accompanied by a 40–60% decrease in the overall expression of endogenous Cdc42 and RhoA protein in RhoGDI (−/−) mesangial cells (Fig. 6).
Figure 5. Rac1, Cdc42, and RhoA GTPase activity levels are elevated in RhoGDI (−/−) mesangial cells compared to wild-type.
Rac1, Cdc42, and RhoA GTPase activities were assayed in RhoGDI (−/−) and (+/+) MSCs by standard PBD pulldown assay, as described in Materials and Methods. A typical assay is shown for each GTPase (lower panels). In the upper panels, the activities were normalized to actin expression levels. Results are given as normalized GTPase activity levels in RhoGDI (−/−) as a percentage relative to that in RhoGDI (+/+) cells. The results shown represent the mean +/− SD (Rac1-GTP (n=6), Cdc42-GTP (n=3) and RhoA-GTP (n=3); * p < 0.01, **, p < 0.01, student t-test).
Figure 6. Reduction in Rac1, Cdc42, and RhoA GTPase protein expression in RhoGDI (−/−) mesangial cells relative to wild-type.
Whole cell lysates of mesangial RhoGDI (−/−) or wt (+/+) cells were analyzed by Western blotting for Rac1, Cdc42, RhoA, and actin (for protein normalization), followed by densitometric analysis. Typical Western blot results are shown in the lower panels. The densitometric results are given as normalized GTPase expression levels in RhoGDI (−/−) as a percentage relative to that in RhoGDI (+/+) cells. Results shown are the mean +/− SD (Rac1 (n=6), Cdc42 (n=15) and RhoA (n=5); * p < 0.01, **, p < 0.01, student t-test).
Since Rac1 activity is normally a positive function of its recruitment to cell membranes, we hypothesized that Rac1 would be more enriched at the membrane surface of RhoGDI (−/−) mesangial cells compared to wild-type. However, we were not able to detect any significant increase in plasma membrane-associated Rac1 in the RhoGDI (−/−) cells – data not shown. This was likely due to the overall decrease in Rac1 protein levels observed in this condition.
3.5 RhoGDI (−/−) mesangial cells exhibit differences in proliferation rate and viability
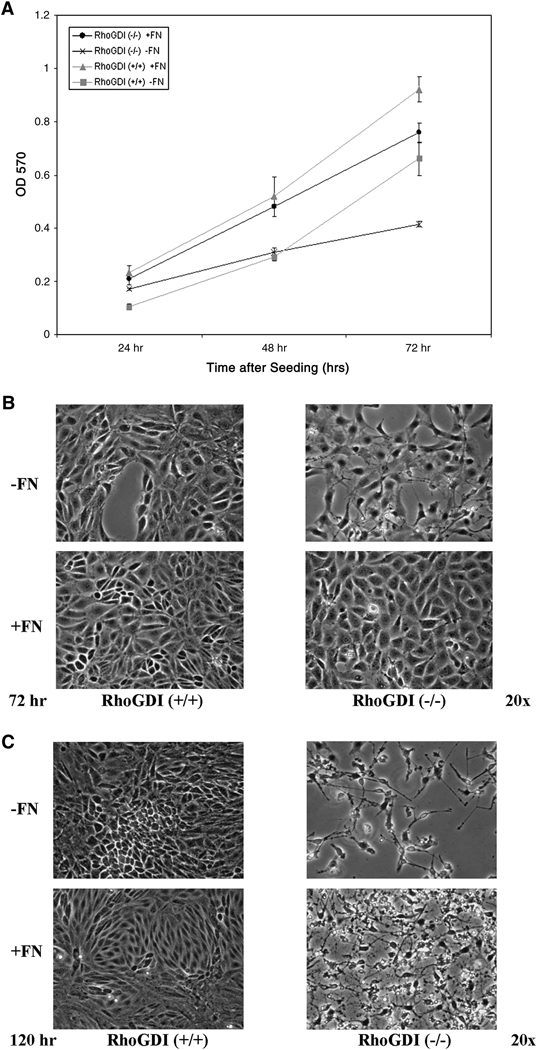
In addition to morphological changes, we observed differences in the proliferation rates and context-dependent viability of RhoGDI (−/−) versus wild-type cells in culture. Using a standard MTT-based cell viability/proliferation assay, we compared the growth rates of wild-type and knockout mesangial cells both in the presence and absence of fibronectin. As expected, the growth of both wild-type and RhoGDI knockout cells was significantly slower in the absence of fibronectin. However, RhoGDI (−/−) cells grew comparatively slower than wild-type under both conditions for the first 72 hours (Fig. 7A,B). The decreased proliferation did not appear to be due to increased cellular apoptosis, as the cells did not label with Annexin V over this 72 hour period (data not shown). In contrast, by 120 hour, while the wild-type mesangial cells continued to proliferate and maintain a cell monolayer, the RhoGDI (−/−) cells began to detach and undergo cell death (Fig. 7C). The severity of this phenotype was exacerbated in the absence of a fibronectin matrix.
Figure 7. RhoGDI (−/−) mesangial cell viability is confluence-dependent.
RhoGDI (−/−) and wild-type (+/+) mesangial cells were plated on plastic and cultured for up to 5 days (120 hours) in either the presence or absence of a fibronectin (FN) matrix. [A] Cell viability after 24, 48, and 72 hr of subconfluent proliferation in culture was determined using a standard MTT assay as described in Materials and Methods. The presence of a fibronectin matrix enhanced cell proliferation and viability for both RhoGDI (−/−) and wild-type mesangial cells. Differences in cell viability began to be seen at 72 hr in the absence, but not the presence, of FN. Error bars represent the SEM of at least three independent experiments. [B] RhoGDI (−/−) mesangial cells were able to achieve 100% cell confluency in culture by 72 hr in the presence of FN; however, [C] RhoGDI (−/−) cell viability dramatically decreased (as observed by a correlative increase in apoptosis) upon culturing for longer times; this was not observed in wild-type cells either +/− FN.
The cell death observed was not likely a function of serum depletion in culture, since growth media was replaced routinely every 48 hours. While we observed that primary wild-type mesangial cells did eventually lose viability, this only began to occur after approximately ten days in culture (data not shown). Based on these observations, it is possible that loss of RhoGDI expression sensitizes mesangial cells to a cell-cell contact-induced cell death or, alternatively, de-sensitizes them to a cell-cell contact-dependent prosurvival signal. Whether the molecular underpinnings of this RhoGDI-related phenotype represent a cell-autonomous or non-cell-autonomous mechanism remains to be investigated.
4. Discussion
RhoGDI appears to play critical roles in regulating renal function, as evidenced by the changes in kidney structure and function that result from the genetic deletion of RhoGDI in the mouse [36]. Among this is dilation of the distal and collecting tubules, podocyte degeneration accompanied by loss of foot processes, and mesangial sclerosis in most of the glomeruli. This resulted in massive proteinuria and progressive renal failure resulting in death. Since RhoGDI plays critical roles in regulating both the activation and cytosol-to-membrane cycling of Rho GTPases, it seems likely that these effects are due to disruptions in Rho GTPase function. Indeed, there is increasing evidence for the critical role(s) of Rho GTPases in regulating the function of the kidney, particularly the functioning of the renal glomerulus. Cell biological and mouse genetic studies have revealed that proteins regulating the architecture and plasticity of the podocyte actin cytoskeleton are of crucial importance for the sustained function of the glomerular filtration barrier. These proteins signal to the cytoskeleton through Rho GTPases.
Consistent with the idea that RhoGDI acts in the kidney through effects on Rho GTPase cycling, we observed that in a kidney mesangial cell line derived from the RhoGDI (−/−) mouse there was an increased level of active Rho GTPases as determined by affinity assay (Fig. 5). While Rac1 exhibited the greatest apparent increase in activation, both RhoA and Cdc42 activities were significantly elevated. This increase in Rho GTPase activity would be expected in the absence of RhoGDI, as the GTPases would then be free to associate with membranes and membrane-associated exchange factors. Consistent with this, the absence of RhoGDI in lungs from RhoGDI (−/−) mice, as well as in cultured endothelial cells in which RhoGDI was downregulated with siRNA, showed increased RhoA activity [43].
Of particular interest was our finding that the levels of protein expression for Rac1, RhoA and Cdc42 were all reduced. This reduction appeared to have some correlation with GTPase activity, as Rac1, which had the largest increase in proportion of active protein, also had the most significant reduction in expression levels. Overall, there seemed to be a balance achieved that limited the amounts of active Rho GTPases that were present in the cell. Because the absolute Rac1 protein level was decreased, we were unable to detect increased amounts of Rac1 present in the plasma membrane (indicative of active Rac1) of the RhoGDI-deficient cells by immunostaining.
The mechanism(s) accounting for Rho GTPase downregulation in the absence of RhoGDI are currently unknown. We note that treatment of HeLa cells with lovastatin, which inhibits interaction with RhoGDI by inhibiting GTPase isoprenylation, was associated with an increase in overall levels of Rho GTPase proteins [44]. One mechanism for GTPase downregulation that may occur is based on the observation that the complexation of Rho GTPases with RhoGDI in the cytosol normally stabilizes the GTPases from degradation. Smurf1-mediated ubiquitination of RhoA has been shown to be a major mechanism regulating the steady-state protein levels of RhoA in the podocyte, and this degradation is antagonized by the binding of RhoA to synaptopodin [45]. The binding of RhoGDI to RhoB has been reported to stabilize the GTPase from degradation as well [46]. Our data suggest that such mechanisms are likely to take place in the RhoGDI (−/−) mesangial cells, resulting in reduction of the steady-state levels of Rac1 and, to a lesser extent, Cdc42 as well.
How might the cellular phenotypes observed in the absence of RhoGDI account for the detrimental changes in kidney function observed in the RhoGDI knockout mouse? The increase in levels of active Rac1 resulting from the loss of RhoGDI would normally be expected to be undesirable in that they might increase filtration barrier permeability in the glomerulus, thus contributing to the resulting proteinuria and other symptoms. However, if the net decrease in overall Rac1 levels observed in the mesangial cell line holds for podocytes as well, then such Rac1-induced morphological changes are unlikely to be substantial. What may contribute more to the RhoGDI knockout renal phenotype is the decrease in cell growth observed in association with an increase in apoptotic cell death (Fig. 7). The death of cells lacking RhoGDI would cause dramatic defects in renal glomerular architecture and function, likely leading to eventual renal failure. Such cell death may be a direct result of the loss of cell survival signals resulting from decreases in overall active Rho GTPase levels and/or an increased sensitivity to a cell contact-induced death response.
In summary, we have characterized for the first time the biochemical and morphological effects of the genetic loss of the Rho GTPase regulatory protein RhoGDI on mesangial cells derived from the knockout mice. We show that while there are increases in the specific activity of Rac1, and to a lesser extent, RhoA and Cdc42, that would be expected from the loss of RhoGDI, there is also a compensatory decrease in the steady-state protein levels of these three Rho GTPases. Decreases in the ability of the mesangial cells to grow and survive in the absence of RhoGDI may significantly contribute to the defects in renal architecture and function observed in the RhoGDI (−/−) mouse.
Acknowledgement
The authors acknowledge Dr. Amy Wilson-Delfosse and Dr. John Sedor, Case Western Reserve University for kindly providing the RhoGDI- mesangial cell line used in these studies. We also acknowledge Dr. Yoshimi Takai for permission to use these cell lines derived from the RhoGDI knockout mouse. We thank Dr. Gary Bokoch and Dr. Dieter Pollet for advice and encouragement. Some of the work was completed (by HB) while in the laboratory of Prof. G. Schmidts. This work was supported by an AHA Beginning Grant-in-Aid (to CDM) and NIH grant HL48008 (HB). AA was supported by NIH Training grant # 5T32 HL007195.
Footnotes
Publisher's Disclaimer: This is a PDF file of an unedited manuscript that has been accepted for publication. As a service to our customers we are providing this early version of the manuscript. The manuscript will undergo copyediting, typesetting, and review of the resulting proof before it is published in its final citable form. Please note that during the production process errors may be discovered which could affect the content, and all legal disclaimers that apply to the journal pertain.
Reference
- 1.Burridge K, Wennerberg K. Cell. 2004;116(2):167. doi: 10.1016/s0092-8674(04)00003-0. [DOI] [PubMed] [Google Scholar]
- 2.Jaffe AB, Hall A. Annu.Rev.Cell Dev.Biol. 2005;21:247. doi: 10.1146/annurev.cellbio.21.020604.150721. [DOI] [PubMed] [Google Scholar]
- 3.Ridley AJ, Schwartz MA, Burridge K, Firtel RA, Ginsberg MH, Borisy G, Parsons JT, Horwitz AR. Science. 2003;302(5651):1704. doi: 10.1126/science.1092053. [DOI] [PubMed] [Google Scholar]
- 4.Van AL, Souza-Schorey C. Genes Dev. 1997;11(18):2295. doi: 10.1101/gad.11.18.2295. [DOI] [PubMed] [Google Scholar]
- 5.Burridge K, Doughman R. Nat.Cell Biol. 2006;8(8):781. doi: 10.1038/ncb0806-781. [DOI] [PubMed] [Google Scholar]
- 6.Fukuhara A, Irie K, Nakanishi H, Takekuni K, Kawakatsu T, Ikeda W, Yamada A, Katata T, Honda T, Sato T, Shimizu K, Ozaki H, Horiuchi H, Kita T, Takai Y. Oncogene. 2002;21(50):7642. doi: 10.1038/sj.onc.1205875. [DOI] [PubMed] [Google Scholar]
- 7.Rogers KK, Jou TS, Guo W, Lipschutz JH. Kidney Int. 2003;63(5):1632. doi: 10.1046/j.1523-1755.2003.00902.x. [DOI] [PubMed] [Google Scholar]
- 8.Sharpe CC, Hendry BM. J.Am.Soc.Nephrol. 2003;14(1):261. doi: 10.1097/01.asn.0000048223.05219.e4. [DOI] [PubMed] [Google Scholar]
- 9.Coupel S, Leboeuf F, Boulday G, Soulillou JP, Charreau B. J.Am.Soc.Nephrol. 2004;15(9):2429. doi: 10.1097/01.ASN.0000138237.42675.45. [DOI] [PubMed] [Google Scholar]
- 10.Heusinger-Ribeiro J, Eberlein M, Wahab NA, Goppelt-Struebe M. J.Am.Soc.Nephrol. 2001;12(9):1853. doi: 10.1681/ASN.V1291853. [DOI] [PubMed] [Google Scholar]
- 11.Nagatoya K, Moriyama T, Kawada N, Takeji M, Oseto S, Murozono T, Ando A, Imai E, Hori M. Kidney Int. 2002;61(5):1684. doi: 10.1046/j.1523-1755.2002.00328.x. [DOI] [PubMed] [Google Scholar]
- 12.Massey AR, Miao L, Smith BN, Liu J, Kusaka I, Zhang JH, Tang J. Life Sci. 2003;72(26):2943. doi: 10.1016/s0024-3205(03)00228-5. [DOI] [PubMed] [Google Scholar]
- 13.Turcotte S, Desrosiers RR, Beliveau R. J.Cell Sci. 2003;116(Pt 11):2247. doi: 10.1242/jcs.00427. [DOI] [PubMed] [Google Scholar]
- 14.Gorin Y, Ricono JM, Kim NH, Bhandari B, Choudhury GG, Abboud HE. Am.J.Physiol Renal Physiol. 2003;285(2):F219. doi: 10.1152/ajprenal.00414.2002. [DOI] [PubMed] [Google Scholar]
- 15.Yi F, Zhang AY, Janscha JL, Li PL, Zou AP. Kidney Int. 2004;66(5):1977. doi: 10.1111/j.1523-1755.2004.00968.x. [DOI] [PubMed] [Google Scholar]
- 16.Benzing T. J.Am.Soc.Nephrol. 2004;15(6):1382. doi: 10.1097/01.asn.0000130167.30769.55. [DOI] [PubMed] [Google Scholar]
- 17.Faul C, Asanuma K, Yanagida-Asanuma E, Kim K, Mundel P. Trends Cell Biol. 2007;17(9):428. doi: 10.1016/j.tcb.2007.06.006. [DOI] [PubMed] [Google Scholar]
- 18.Kerjaschki D. J.Clin.Invest. 2001;108(11):1583. doi: 10.1172/JCI14629. [DOI] [PMC free article] [PubMed] [Google Scholar]
- 19.Moeller MJ, Holzman LB. Nephron Exp.Nephrol. 2006;103(2):e69. doi: 10.1159/000090619. [DOI] [PubMed] [Google Scholar]
- 20.Ransom RF, Lam NG, Hallett MA, Atkinson SJ, Smoyer WE. Kidney Int. 2005;68(6):2473. doi: 10.1111/j.1523-1755.2005.00723.x. [DOI] [PubMed] [Google Scholar]
- 21.DerMardirossian C, Bokoch GM. Trends Cell Biol. 2005;15(7):356. doi: 10.1016/j.tcb.2005.05.001. [DOI] [PubMed] [Google Scholar]
- 22.Dovas A, Couchman JR. Biochem.J. 2005;390(Pt 1):1. doi: 10.1042/BJ20050104. [DOI] [PMC free article] [PubMed] [Google Scholar]
- 23.Fukumoto Y, Kaibuchi K, Hori Y, Fujioka H, Araki S, Ueda T, Kikuchi A, Takai Y. Oncogene. 1990;5(9):1321. [PubMed] [Google Scholar]
- 24.Leonard D, Hart MJ, Platko JV, Eva A, Henzel W, Evans T, Cerione RA. J.Biol.Chem. 1992;267(32):22860. [PubMed] [Google Scholar]
- 25.Gorvel JP, Chang TC, Boretto J, Azuma T, Chavrier P. FEBS Lett. 1998;422(2):269. doi: 10.1016/s0014-5793(98)00020-9. [DOI] [PubMed] [Google Scholar]
- 26.Lelias JM, Adra CN, Wulf GM, Guillemot JC, Khagad M, Caput D, Lim B. Proc.Natl.Acad.Sci.U.S.A. 1993;90(4):1479. doi: 10.1073/pnas.90.4.1479. [DOI] [PMC free article] [PubMed] [Google Scholar]
- 27.Adra CN, Manor D, Ko JL, Zhu S, Horiuchi T, Van AL, Cerione RA, Lim B. Proc.Natl.Acad.Sci.U.S.A. 1997;94(9):4279. doi: 10.1073/pnas.94.9.4279. [DOI] [PMC free article] [PubMed] [Google Scholar]
- 28.Zalcman G, Closson V, Camonis J, Honore N, Rousseau-Merck MF, Tavitian A, Olofsson B. J.Biol.Chem. 1996;271(48):30366. doi: 10.1074/jbc.271.48.30366. [DOI] [PubMed] [Google Scholar]
- 29.Dransart E, Olofsson B, Cherfils J. Traffic. 2005;6(11):957. doi: 10.1111/j.1600-0854.2005.00335.x. [DOI] [PubMed] [Google Scholar]
- 30.Gosser YQ, Nomanbhoy TK, Aghazadeh B, Manor D, Combs C, Cerione RA, Rosen MK. Nature. 1997;387(6635):814. doi: 10.1038/42961. [DOI] [PubMed] [Google Scholar]
- 31.Grizot S, Faure J, Fieschi F, Vignais PV, Dagher MC, Pebay-Peyroula E. Biochemistry. 2001;40(34):10007. doi: 10.1021/bi010288k. [DOI] [PubMed] [Google Scholar]
- 32.Hoffman GR, Nassar N, Cerione RA. Cell. 2000;100(3):345. doi: 10.1016/s0092-8674(00)80670-4. [DOI] [PubMed] [Google Scholar]
- 33.Keep NH, Barnes M, Barsukov I, Badii R, Lian LY, Segal AW, Moody PC, Roberts GC. Structure. 1997;5(5):623. doi: 10.1016/s0969-2126(97)00218-9. [DOI] [PubMed] [Google Scholar]
- 34.Longenecker K, Read P, Derewenda U, Dauter Z, Liu X, Garrard S, Walker L, Somlyo AV, Nakamoto RK, Somlyo AP, Derewenda ZS. Acta Crystallogr.D.Biol.Crystallogr. 1999;55(Pt 9):1503. doi: 10.1107/s090744499900801x. [DOI] [PubMed] [Google Scholar]
- 35.Scheffzek K, Stephan I, Jensen ON, Illenberger D, Gierschik P. Nat.Struct.Biol. 2000;7(2):122. doi: 10.1038/72392. [DOI] [PubMed] [Google Scholar]
- 36.Togawa A, Miyoshi J, Ishizaki H, Tanaka M, Takakura A, Nishioka H, Yoshida H, Doi T, Mizoguchi A, Matsuura N, Niho Y, Nishimune Y, Nishikawa S, Takai Y. Oncogene. 1999;18(39):5373. doi: 10.1038/sj.onc.1202921. [DOI] [PubMed] [Google Scholar]
- 37.Lakhe-Reddy S, Khan S, Konieczkowski M, Jarad G, Wu KL, Reichardt LF, Takai Y, Bruggeman LA, Wang B, Sedor JR, Schelling JR. J.Biol.Chem. 2006;281(28):19688. doi: 10.1074/jbc.M601110200. [DOI] [PMC free article] [PubMed] [Google Scholar]
- 38.Benard V, Bohl BP, Bokoch GM. J.Biol.Chem. 1999;274(19):13198. doi: 10.1074/jbc.274.19.13198. [DOI] [PubMed] [Google Scholar]
- 39.Stofega M, DerMardirossian C, Bokoch GM. Methods Mol.Biol. 2006;332:269. doi: 10.1385/1-59745-048-0:269. [DOI] [PubMed] [Google Scholar]
- 40.Decathelineau AM, Bokoch GM. Infect.Immun. 2009;77(1):348. doi: 10.1128/IAI.01005-08. [DOI] [PMC free article] [PubMed] [Google Scholar]
- 41.Price LS, Leng J, Schwartz MA, Bokoch GM. Mol.Biol.Cell. 1998;9(7):1863. doi: 10.1091/mbc.9.7.1863. [DOI] [PMC free article] [PubMed] [Google Scholar]
- 42.Benard V, Bokoch GM. Methods Enzymol. 2002;345:349. doi: 10.1016/s0076-6879(02)45028-8. [DOI] [PubMed] [Google Scholar]
- 43.Gorovoy M, Neamu R, Niu J, Vogel S, Predescu D, Miyoshi J, Takai Y, Kini V, Mehta D, Malik AB, Voyno-Yasenetskaya T. Circ.Res. 2007;101(1):50. doi: 10.1161/CIRCRESAHA.106.145847. [DOI] [PubMed] [Google Scholar]
- 44.Turner SJ, Zhuang S, Zhang T, Boss GR, Pilz RB. Biochem.Pharmacol. 2008;75(2):405. doi: 10.1016/j.bcp.2007.08.031. [DOI] [PMC free article] [PubMed] [Google Scholar]
- 45.Asanuma K, Yanagida-Asanuma E, Faul C, Tomino Y, Kim K, Mundel P. Nat.Cell Biol. 2006;8(5):485. doi: 10.1038/ncb1400. [DOI] [PubMed] [Google Scholar]
- 46.Ho TT, Merajver SD, Lapiere CM, Nusgens BV, Deroanne CF. J.Biol.Chem. 2008;283(31):21588. doi: 10.1074/jbc.M710033200. [DOI] [PubMed] [Google Scholar]


