

Abstract
Purpose
To present comprehensive examinations of the assumptions made in functional diffusion map (fDM) analyses and provide a biological basis for fDM classification.
Materials and Methods
Sixty-nine patients with gliomas were enrolled in this study. To determine the sensitivity of ADC to cellularity, cell density from stereotactic biopsy specimens was correlated with pre-operative ADC maps. For definition of ADC thresholds used for fDMs, the 95% confidence intervals (C.I.) for changes in voxel-wise ADC measurements in normal appearing tissue was analyzed. The sensitivity and specificity to progressing disease was examined using both radiographic and neurological criteria.
Results
Results support the hypothesis that ADC is inversely proportional to cell density with a sensitivity of 1.01 × 10⁻⁷ [mm2/s]/[nuclei/mm2]. The 95% C.I. for white matter = 0.25×10⁻³mm2/s, gray matter = 0.31×10⁻³mm2/s, a mixture of white and gray matter = 0.40×10⁻³mm2/s, and a mixture of white matter, gray matter, and cerebrospinal fluid = 0.75×10⁻³mm2/s. Application of these measurements as ADC thresholds produce varying levels of sensitivity and specificity to disease progression, which were all significantly better than chance.
Conclusion
This study suggests fDMs are valid biomarkers for brain tumor cellularity.
Keywords: Diffusion MRI, brain tumor, glioma, functional diffusion maps, fDM
Introduction
Apparent diffusion coefficients (ADCs) calculated from diffusion MRI data provide useful information about the tumor microenvironment. In neoplasms, a decrease in ADC has been shown to correlate with an increase in tumor cellularity (1-8), and an increased ADC has been shown to correlate with a decrease in cellularity as a result of successful treatment (2,9) and/or radiation-induced necrosis (2). Functional diffusion maps (fDMs) were developed to take advantage of these principles on a voxel-by-voxel basis, and have proven to be a powerful tool for predicting the effect of chemotherapy and radiotherapy (10-13).
Despite initial results suggesting fDMs may be a valuable predictive imaging biomarker for cytotoxic therapies, comprehensive examination of the change in ADC (ΔADC) necessary to classify voxels as increasing, decreasing, or not changing has not been performed, nor has the biological relevance of these thresholds been examined. For human fDMs, the ΔADC threshold has been previously defined as 0.55 × 10⁻³ mm2/s, based exclusively on the 95% confidence interval (C.I.) for normal-appearing white and gray matter in a single empirical dataset consisting of five patients scanned a total of 15 times (10). In a separate animal study, a ΔADC threshold of 0.4 × 10⁻³ mm2/s was suggested for the best balance between sensitivity and specificity (11). Perhaps most importantly, the current ΔADC threshold for human fDMs (0.55 × 10⁻³ mm2/s) was chosen without defining the biological detection sensitivity (i.e. the minimum change in cell density required for voxel classification). Further, the clinical sensitivity and specificity of fDMs to disease progression may rely heavily on the particular threshold used for voxel stratification. As such, a comprehensive study thoroughly defining the ΔADC C.I.s and both their biological and clinical sensitivity is warranted.
The purpose of the current study was to comprehensively examine many of the assumptions used in human fDM analysis and better define the basis of fDM tissue classification. Specifically, we examined the relationship between ADC and tumor cell density, ΔADC thresholds for use in human fDM analysis, the biological detection sensitivity of these thresholds, and the sensitivity and specificity of the different ΔADC thresholds to detecting progressing disease.
Materials and Methods
Patient Population
A total of 69 patients with confirmed gliomas that were previously enrolled in a study of MR perfusion imaging at our institution were enrolled in the current retrospective study. All patients gave informed written consent according to guidelines approved by the Institutional Review Board at our institution. Table 1 lists the study population data for each specific hypothesis tested.
Table 1. Patient Population Data.
| Specific Hypothesis | Number of Patients | WHO IV | WHO III | WHO II | ||
|---|---|---|---|---|---|---|
| Hypothesis 1: ADC vs. Cellularity | 17 | 8 | 5 | 4 | ||
| Hypothesis 2: Δ ADC vs. Time | 69 | 35 | 19 | 15 | ||
| Range | ||||||
| 1 Week | 4-8 days | 3 | 1 | 2 | 0 | |
| 2 Weeks | 14-16 days | 3 | 1 | 1 | 1 | |
| 1 Month | 28-38 days | 7 | 5 | 2 | 0 | |
| 2 Months | 55-73 days | 10 | 5 | 2 | 3 | |
| 3 Months | 83-120 days | 10 | 4 | 3 | 3 | |
| 6 Months | 168-194 days | 10 | 6 | 2 | 2 | |
| 9 Months | 246-298 days | 12 | 7 | 3 | 2 | |
| 1 Year | 341-398 days | 14 | 6 | 4 | 4 | |
| Hypothesis 3: Volume of Hyper-/Hypocellularity | 5 | 5 | 0 | 0 | ||
| Sensitivity/Specificity Analysis | 33 | 19 | 10 | 4 | ||
Clinical MRI
Clinical MRI scans included a spoiled gradient recalled (SPGR) anatomical scan, pre-contrast T1-weighted (T1) scan, post-contrast T1-weighted (T1+C) scan, and a fluid-attenuated inversion recovery scan (FLAIR) collected on a 1.5-T MR scanner (Signa Excite, CVi, or LX; GE Medical Systems, Milwaukee, WI). 3D SPGR images were acquired with echo-time (TE)/repetition time (TR) = 3.16 msec/8.39 msec, number of averages (NEX) = 2, slice thickness = 1.3 mm collected contiguously, flip angle = 10 degrees, field-of-view (FOV) = 240 mm, and a matrix size of 256 × 192 (zero-padded and interpolated to 256 × 256) resulting in a total of 123 to 128 images. Axial pre- and post-contrast T1-weighted images were acquired before and after administration of up to 10cc gadobenate dimeglumine (Multihance; Bracco Diagnostics Inc., Princeton, NJ) or up to 20cc of gadodiamine (Omniscan; GE Healthcare Systems) contrast agent with a fast spin-echo (FSE) sequence, TE/TR = 24.16 msec/666.7 msec, NEX = 1, slice thickness of 5 mm with 1.5 mm interslice gap, flip angle = 90 degrees, FOV = 240 mm, and a matrix size of 256 × 192 (zero-padded and interpolated to 256 × 256) resulting in a total of 22 to 24 images. Axial FLAIR images were collected with a FSE readout, inversion time (TI) = 2,200 msec, TE/TR = 125.2 msec/10,000 msec, NEX = 1, slice thickness of 5 mm with 1.5 mm interslice gap, flip angle = 90 degrees, FOV = 240 mm, and a matrix size of 256 × 224 (reconstructed images were zero-padded and interpolated to 256 × 256) resulting in a total of 22 to 24 images.
Diffusion MRI
Diffusion weighted images (DWIs) were collected with TE/TR = 102.2 msec/8,000 msec, NEX = 1, slice thickness of 5 mm with 1.5 mm interslice gap, flip angle = 90 degrees, FOV = 240 mm, and a matrix size of 128 × 128 (reconstructed images were zero-padded and interpolated to 256 × 256) using either an EPI or PROPELLER readout. DWIs were acquired with b = 0 and 1,000 s/mm2, using all gradients applied equally (isotropic). After collecting the images the apparent diffusion coefficient (ADC) images were calculated from the b = 1,000 s/mm2 and b = 0 images.
Functional Diffusion Maps (fDMs)
All images for each patient were registered to their own baseline, post-surgical, pre-treatment, SPGR anatomical images using a mutual information algorithm and a 12-degree of freedom transformation using FSL (FMRIB, Oxford, UK; http://www.fmrib.ox.ac.uk/fsl/). Fine registration (1-2 degrees & 1-2 voxels) was then performed using a Fourier transform-based, 6-degree of freedom, rigid body registration algorithm (14) followed by visual inspection to ensure adequate alignment. After proper registration was verified, voxel-by-voxel subtraction was performed between ADC maps acquired at subsequent time points and the baseline, post-surgical, pre-treatment, ADC maps to create ΔADC images. Individual voxels were stratified into three categories based on the change in ADC relative to baseline ADC maps. (Optimal ΔADC thresholds were explored in Hypothesis 2). Red voxels represented areas within the tumor where ADC increased beyond the ΔADC threshold (i.e. “hypocellular” voxels), blue voxels represented areas within the tumor where ADC decreased beyond the ΔADC threshold (i.e. “hypercellular” voxels), and green voxels represented no change in ADC beyond the ΔADC threshold. This process is summarized in Figure 1.
Figure 1.
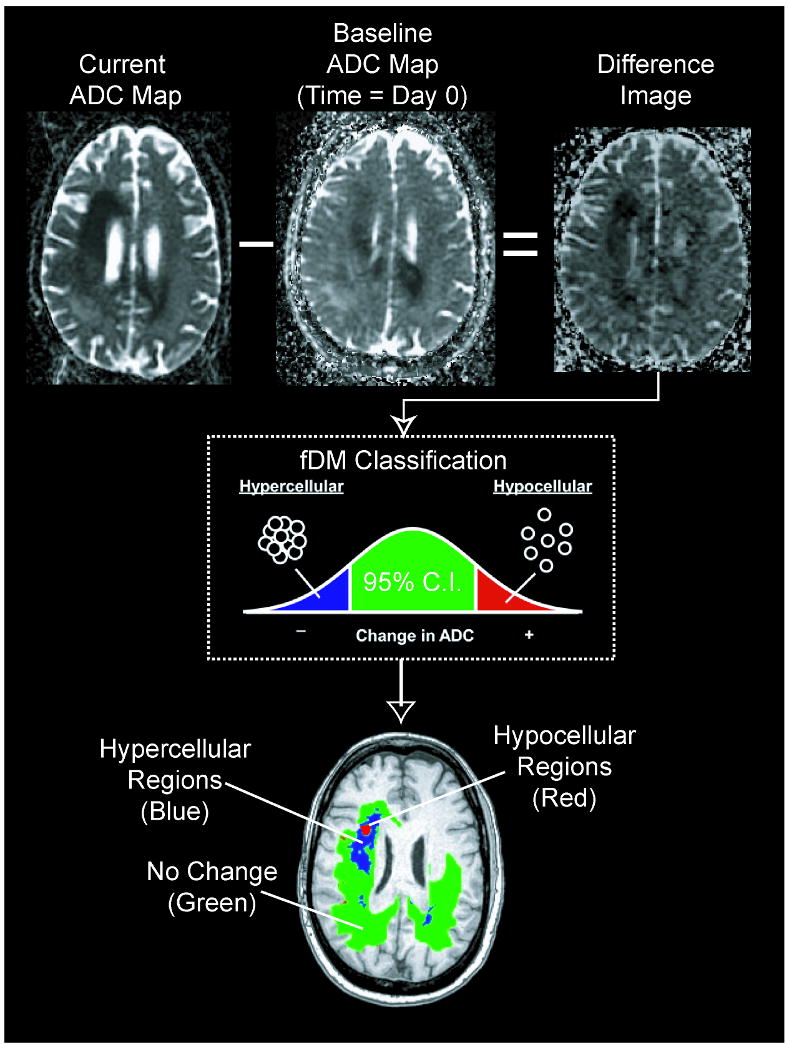
Calculation of functional diffusion maps from sequential apparent diffusion coefficient (ADC) maps. For each post-baseline time point, ADC maps from the current day are subtracted from baseline ADC maps. Each voxel within an ADC difference image is stratified into three categories based on the magnitude of the ADC change: a decrease in ADC suggestive of increased cellularity (blue voxels), an increase in ADC suggestive of decreased cellularity (red voxels), and those with no significant change in ADC (green voxels).
Use of the terms “hypercellularity” and “hypocellularity” instead of “decreasing ADC” and “increasing ADC” in the current study may be misleading, since many pathologies and clinical scenarios can alter ADC measurements. As such, the possibility of localized infection, subacute stroke, substantial gliosis, tissue swelling from seizure activity, and changes in steroid use must be considered during interpretation of fDMs. At our institution, for example, clinical translation of the fDM technique involves integration of interpretations from board certified neurologists and radiologists, as well as biophysicists, to rule out the possibility of confounding factors.
Hypothesis 1: Glioma cell density is inversely proportional to ADC measurement
To test the hypothesis that tissue cell density is inversely proportional to ADC within brain tumor tissue, seventeen patients with a variety of glioma grades (WHO grades II-IV) who previously underwent closed diagnostic stereotactic biopsy via StealthSystem™ surgical navigation were retrospectively examined (Table 1). Intra-operative computed tomography images and post-operative 3D anatomical MR images were used to spatially localize the biopsy regions (Figure 2A). The ADC measurements corresponding to the precise spatial regions of the biopsy samples were extracted from the pre-operative ADC maps, after they were first registered to post-operative anatomical MR images. The volume of tissue examined in ADC maps ranged from 0.25 – 3 mL (approximately 200 – 2500 voxels on SPGR and registered/interpolated ADC maps).
Figure 2.
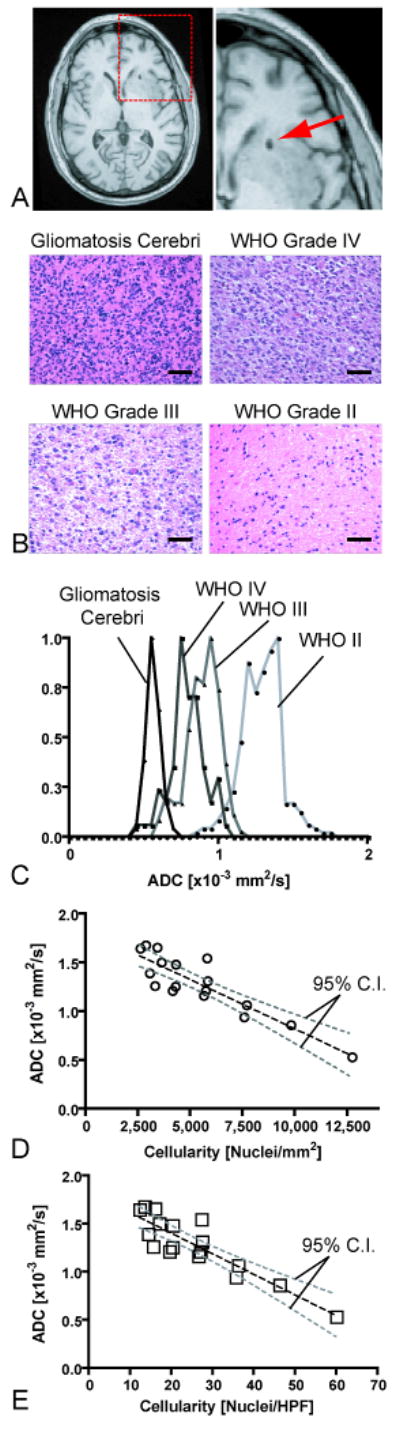
Correlation between spatially-matched ADC measurements and cell density from stereotactic biopsy samples. A) Post-operative, high-resolution 3D T1-weighted anatomical MR images showing the biopsy location in a single patient. B) Representative histological images (Hematoxylin & Eosin, 20× magnification) showing how cell density increases with an increase in tumor grade (scale bar = 50 μm). C) Spatially-matched ADC measurements taken from the biopsy location in the same four patients as (B), showing a decrease in ADC with an increase in tumor grade and cell density. D) Scatter plot of average ADC within stereotactic biopsy locations and average cellularity for 17 patients (circles) shows a significant linear correlation (Pearson's Correlation Coefficient, r2 = 0.7933; P < 0.0001) between mean ADC and mean cell density in nuclei/mm2. E) Correlation between mean ADC and mean cell density in nuclei per high power field (HPF). Dashed black line = linear regression line; dashed gray lines = 95% confidence intervals for the regression.
Hematoxylin and eosin (H&E)-stained slides of the biopsy specimens prepared by the Pathology Core at our institution were used for cell density measurements. The slides from biopsy samples were analyzed using MetaMorph™image analysis software. The numbers of nuclei were manually counted by a single investigator, blinded to the diffusion imaging results, in two to four different regions on the histological slides at 20× magnification to provide a more random sampling of the cell density within the tumor specimen. Each slide was calibrated to physical units prior to cell counting to provide estimates of the number of nuclei per mm2, as well as the number of nuclei per high power field (HPF).
Linear regression was performed between the mean ADC measurement spatially matched to the biopsy site and the mean cell density obtained from the biopsy specimen for each patient. We assumed a linear model of the form:
| [Equation 1] |
where ADCTumor is the mean ADC measurement from the biopsy site (in mm2/s), B is the sensitivity of ADC measurement to cell density in units of ([mm2/s] / [nuclei/mm2]) or ([mm2/s]/[nuclei/HPF]), ρC is cell density (in nuclei/mm2 or nuclei/HPF), and C is the intercept.
Hypothesis 2: A measure of normal ADC variability across scan days must be determined in order to properly set the thresholds for fDMs
To estimate the reproducibity of voxel-wise ADC measurements the 95% C.I.s for different mixtures of NAWM, NAGM, and CSF were determined. Specifically ADC difference images (ΔADC images) created by subtracting a baseline ADC map from an ADC map were obtained at various post-baseline time points after image registration (see Functional Diffusion Maps section above for image registration details). The ADC maps were obtained at 1 week (n = 3 patients), 2 weeks (n = 3 patients), 1 month (n = 7 patients), 2 months (n = 10 patients), 3 months (n = 10 patients), 6 months (n = 10 patients), 9 months (n = 12 patients), and 1 year (n = 14) after baseline ADC maps to ensure the C.I.s take into consideration the possible range of ADC changes that might occur over the wide range of survival times observed in low to high grade gliomas. Patient information used for testing this hypothesis is summarized in Table 1.
Approximately 3,000 voxels from ΔADC images were obtained from each patient's NAWM, 3,000 voxels from each patient's NAGM, and 2,000 voxels from each patient's CSF within the subarachnoid space at each time point based on high resolution, 3D T1-weighted anatomical images (Figure 3E) co-registered with ΔADC maps. If the data had equal variance according to Bartlett's test for equal variance, all voxels obtained from all patients for a particular (post-baseline) time point (e.g. at 1 month post-baseline) were pooled into a single distribution. Finally, all voxels from all patients and all time points were pooled to provide an overall distribution for calculation of ΔADC C.I.s for each tissue type. Note that the final distributions for NAWM+NAGM and NAWM+NAGM+CSF include the variability across multiple patients, tumor grades, post-baseline time points, tissue types (i.e. WM, GM, and CSF). Therefore, unavoidable artifactual covariance between tissue types may have occurred due to either mis-registration or partial volume averaging, along with actual variability that may have occurred due to global effects of standard therapy. Pooling the data by this method, therefore, allowed for a realistic estimate of the C.I.s that included many common factors found in our patient population.
Figure 3.
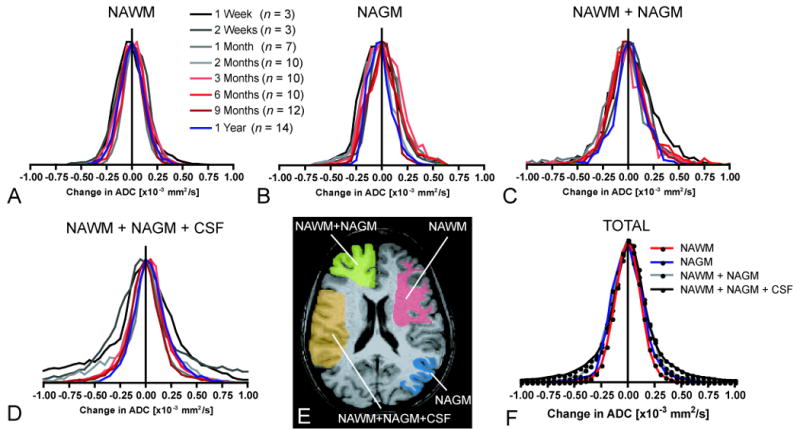
Distribution of ΔADC for different tissue types and different post-baseline times. A) ΔADC histograms for normal-appearing white matter (NAWM). B) ΔADC histograms for normal-appearing gray matter (NAGM). C) ΔADC histograms for a mixture of NAWM+NAGM. D) ΔADC histograms for a mixture of NAWM+NAGM+CSF (cerebrospinal fluid in subarachnoid space adjacent to cortical gray matter). E) Regions of interest (ROIs) containing mixtures of the various tissue types used in estimation of ΔADC variability. F) Pooled ΔADC distributions from all subjects and all post-baseline time points for each tissue type (n = 69 patients; N = 210,000 voxels).
Hypothesis 3: fDMs created with different ΔADC thresholds reflect different sensitivity and specificity to brain tumor progression
Five randomly chosen patients with recurrent glioblastoma having statistically similar total abnormal FLAIR volumes, from the 69 total patients enrolled in the current study, were used to test whether the 95% C.I.s for ΔADC (determined in Hypothesis 2) produced physically different fDMs to those produced using the standard ΔADC threshold of 0.55 × 10⁻³ mm2/s. Patient information used to test this hypothesis are summarized in Table 1. To test this hypothesis, the physical volumes of “hypercellularity” (voxels with decreased ADC relative to baseline) and “hypocellularity” (voxels with an increase in ADC relative to baseline) were calculated for these five patients using five ΔADC thresholds: 1) 95% C.I.s for NAWM, 2) 95% C.I.s for NAGM, 3) 95% C.I.s for a mixture of NAWM+NAGM, 4) 95% C.I.s for a mixture of NAWM+NAGM+CSF, and 5) the standard ADC thresholds recommended for human fDMs (10). It is important to note that these thresholds were determined initially from different tissue types; however, these thresholds were then applied globally to all tissue types in these fDM patients (i.e. The 95% C.I. determined from NAWM, for example, was applied as the ΔADC threshold in fDM analysis in regions that may contain gray matter or white matter). These volumes were calculated exclusively for regions of the brain containing abnormal FLAIR signal intensity, which, when present, also contained all regions of gadolinium contrast enhancement. Although most fDM studies have focused only on contrast-enhanced regions, recent data have suggested that evaluating abnormal FLAIR regions are also clinically valuable (15,16). A one-way, repeated measures ANOVA and Tukey's test for pairwise multiple comparisons were used to test this hypothesis.
In order to determine if different ΔADC thresholds used in fDMs applied to FLAIR regions differ in their sensitivity and specificity to progressive disease we closely examined 33 of the 69 patients enrolled in the current study who eventually showed disease progression according to our criteria for disease progression. Each patient's neurological and radiographic status during his or her clinical time-course was examined, and each session for each patient was categorized as either stable disease (SD) or progressing disease (PD). In this way, a single patient with many scan sessions may have sessions that were stable and a session that shows radiographic or neurological disease progression. “Progressive disease” was defined as having either neurological decline or radiographic progression, whereas “stable disease” was defined for all examinations that showed no change (or improvement) in neurological status and radiographic presentation.
To identify neurological progression we examined changes in the Karnofsky Performance Score (KPS). (The KPS scale ranges from 100 to 0, where 100 represents normal function and 0 represents expiration of the patient (17). This scale is accepted as a valuable tool for examining the general neurological status of a patient (18)). Fellowship-trained neuro-oncologists and trained physicians recorded KPS scores for each of the patients during routine clinical examinations, which were approximately every 8 weeks from the start of treatment unless shorter intervals were warranted. Neurological decline was defined on the basis of a greater than 20 point decrease in KPS score with respect to the previous exam, whereas a stable neurological exam was defined as no change or improvement in KPS score with respect to the previous exam.
Radiological status on a particular scan day was validated by a board certified radiologist by differential comparison with previous MR images (typically the images acquired approximately 8 weeks prior) using the Macdonald criteria when appropriate (19). Briefly, radiological recurrence/progression was defined as new or enlarging regions of contrast-enhancement while the patients were on stable or increasing doses of corticosteroids during standard therapy (cytotoxic drugs and radiotherapy following surgical biopsy or resection).
Receiver-operator characteristic (ROC) analysis was used to determine the sensitivity and specificity of the rate of change in hypercellular volume (in uL/day) for different ΔADC thresholds to progressive disease. Note that we defined the rate of change in hypercellular volume as the change in hypercellular volume between two sequential fDMs, divided by the time interval between maps. We hypothesize that the rate of change in hypercellular volume is more sensitive, but less specific, to disease progression using lower ΔADC thresholds. A one-way analysis of variance was used to test whether the area under the ROC curves differed between ΔADC thresholds.
Results
Hypothesis 1: Glioma cell density is inversely correlated with ADC measurement
Measurements of ADC within the region of stereotactic biopsy were significantly correlated with tumor cell density (Figure 2; Pearson's Correlation Coefficient, r2 = 0.7933, P < 0.0001). Representative tissue and ADC histograms (Figure 2B-C) demonstrate this effect for different tumor grades and characteristics. The sensitivity of threshold of detectability for ADC measurements to tumor cell density was approximately 1.01 × 10⁻⁷ [mm2/s] / [nuclei/mm2] (95% C.I.s = 0.726 × 10⁻⁷ to 1.293 × 10⁻⁷ [mm2/s] / [nuclei/mm2]). Alternatively, the sensitivity of ADC to tumor cell density can be written as 2.14 × 10⁻⁵ [mm2/s] / [nuclei/HPF] (95% C.I.s = 1.54 × 10⁻⁵ to 2.74 × 10⁻⁵ [mm2/s] / [nuclei/HPF]). These results appear to support the hypothesis that tumor cell density is inversely correlated with ADC measurements within human gliomas.
Hypothesis 2: A measure of normal ADC variability across scan days must be determined in order to properly set the thresholds for fDMs
To test this hypothesis, ΔADC values were extracted from 69 patients, over post-baseline times ranging from 1 week to 1 year, in regions of NAWM, NAGM, NAWM+NAGM, and NAWM+NAGM+CSF (Figure 3E). When voxel ADC differences (ΔADC) for NAWM from all patients were pooled together for a given post-baseline time point, all distributions were tightly centered with a mean around 0 mm2/s (Figure 3A). The maximum variability within NAWM occurred approximately 3 months post-baseline, having a standard deviation of near 0.15 × 10⁻³ mm2/s. Despite slight differences in variability, results suggested no significant statistical difference in ΔADC variability over time (Bartlett's test for equal variances, P > 0.05). Qualitatively, when voxel-wise ADC differences for NAGM from all patients were pooled for a given post-baseline time point, the distributions showed a higher variability compared to NAWM, but the mean difference was also centered around 0 mm2/s (Figure 3B). Closer examination suggested no significant statistical difference in ΔADC variability within NAGM over time (Bartlett's test for equal variances, P > 0.05). Similarly, ΔADC for a mixture of NAWM and NAGM, as well as a mixture of NAWM, NAGM, and CSF, showed even greater variability (Figure 3C,D). Interestingly, the maximum variability within a mixture of NAWM+NAGM and NAWM+NAGM+CSF occurred 1 -2 weeks post-baseline, which may suggest some transient chemotherapeutic or radiotherapy effects. As with NAWM and NAGM, mixtures of these tissues showed no significant statistical difference in ΔADC variability over time (Bartlett's test for equal variances, NAWM+NAGM, P > 0.05; NAWM+NAGM+CSF, P > 0.05). These results suggest that ΔADC is not significantly dependent on the time between ADC scans, which does not support our original hypothesis. It does, however, suggest that fDM analysis is relatively stable over time.
Voxel-wise ΔADC measurements for NAWM, NAGM, NAWM+NAGM, and NAWM+NAGM+CSF were then pooled across all patients and all post-baseline time points. The final distributions were normally distributed (Kolmogorov-Smirnov, P > 0.05) and are illustrated in Figure 3F. The 95% C.I. for NAWM was approximately 0.25 × 10⁻³ mm2/s, the 95% C.I. for NAGM was approximately 0.31 × 10⁻³ mm2/s, the 95% C.I. for NAWM+NAGM was approximately 0.40 × 10⁻³ mm2/s, and the 95% C.I. for a mixture of NAWM+NAGM+CSF was approximately 0.75 × 10⁻³ mm2/s. These results suggest that ΔADC measurements from NAWM and NAGM could not be considered independent random variables when estimating the variability for mixtures of NAWM+NAGM, since σ2NAWM+NAGM ≠ σ2NAWM + σ2NAGM. This effect is likely due to partial volume contamination in ADC maps. Results for various C.I.s and their biological sensitivities are detailed in Table 2.
Table 2. Confidence intervals, ΔADC thresholds, and cell density estimates for various mixtures of tissue types.
NAWM = normal-appearing white matter; NAGM = normal-appearing gray matter, NAWM+NAGM = mixture of normal-appearing white and gray matter; NAWM+NAGM+CSF = mixture of normal-appearing white matter, gray matter, and cerebrospinal fluid
| Tissue Type | Level of Significance [P-Value] |
Confidence Interval [%] |
Δ ADC Threshold [×10-3 mm2/s] |
Δ Cellularity (95% C.I.) [Nuclei/mm2] |
Δ Cellularity (95% C.I.) [Nuclei/HPF] |
9L Glioma (ref 3) [Nuclei/HPF] |
Human Glioma (ref 20) [Nuclei/HPF] |
|---|---|---|---|---|---|---|---|
| NAWM | 0.0250 | 95% | 0.25 | 2475 (1933-3444) | 11.67 (9.11-16.22) | 6.94 | 6.25 |
| NAGM | 0.0250 | 95% | 0.31 | 3069 (2397-4269) | 14.47 (11.30-10.12) | 8.61 | 7.75 |
| NAWM+NAGM | 0.0250 | 95% | 0.40 | 3960 (3094-5510) | 18.67 (14.58-25.96) | 11.11 | 10.00 |
| NAWM+NAGM+CSF | 0.0250 | 95% | 0.75 | 7426 (5800-10331) | 35.01 (27.33-48.67) | 20.83 | 18.75 |
| Standard Threshold | 0.0250 | 95% | 0.55 | 5446 (4254-7576) | 25.68 (20.04-35.69) | 15.28 | 13.75 |
Hypothesis 3: fDMs created with different ΔADC thresholds reflect different sensitivity and specificity to brain tumor progression
Using the 95% C.I.s for ΔADC defined for NAWM, NAGM, NAWM+NAGM, and NAWM+NAGM+CSF, fDMs were constructed in five representative patients with recurrent glioblastoma multiforme having statistically similar abnormal FLAIR volumes (Figure 4). Qualitatively, when the 95% C.I. for NAWM was used as the ΔADC threshold, there appeared to be a larger number of voxels classified as “hypercellular” and “hypocellular” compared to the other thresholds. One-way, repeated measures ANOVAs suggest there were significant differences in the volume of hypercellularity (ANOVA; P < 0.001) and the volume of hypocellularity (ANOVA; P < 0.001) between the five thresholds. Despite the relatively low number of patients used to test this hypothesis, there was adequate statistical power to draw these conclusions (ANOVA; 1-β > 0.9).
Figure 4.
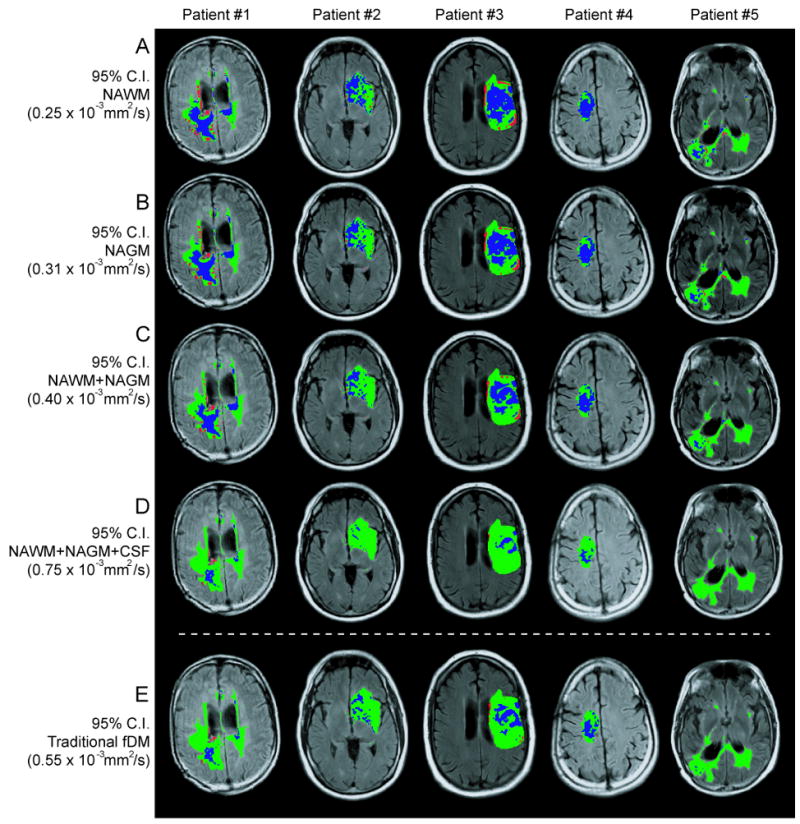
Functional diffusion maps for five representative glioblastoma patients, evaluated with five ΔADC thresholds: A) 95% confidence interval (C.I.) for normal-appearing white matter (NAWM), B) 95% C.I. for normal-appearing gray matter (NAGM), C) 95% C.I. for NAWM+NAGM, D) 95% C.I. for NAWM+NAGM+CSF (cerebrospinal fluid), and E) the standard fDM threshold used in human analysis.
In agreement with qualitative observations, Tukey's test for multiple comparisons suggested significant differences between hypercellular volumes calculated using the 95% C.I. for NAWM compared with the standard threshold (Tukey; NAWM vs. Standard Threshold, P < 0.01) and the 95% C.I. for NAWM+NAGM+CSF (Tukey; NAWM vs. NAWM+NAGM+CSF, P < 0.001). Similarly, there were significant differences between hypercellular volumes calculated using the 95% C.I. for NAGM compared with the standard threshold (Tukey; NAGM vs. Standard Threshold, P < 0.05) and the 95% C.I. for NAWM+NAGM+CSF (Tukey; NAGM vs. NAWM+NAGM+CSF, P < 0.01). There was also a significant difference between hypocellular volumes calculated using the 95% C.I. for NAWM compared with the standard threshold (Tukey; NAWM vs. Standard Threshold, P < 0.01) and the 95% C.I. for NAWM+NAGM+CSF (Tukey; NAWM vs. NAWM+NAGM+CSF, P < 0.01). There were no significant statistical differences between the hypercellular or hypocellular volumes calculated using the 95% C.I. for NAWM+NAGM or NAWM+NAGM+CSF compared to the standard fDM thresholds (Tukey, P > 0.05). These results suggest that ΔADC thresholds that represent only a single tissue type (NAWM or NAGM) tend to have a significantly higher sensitivity when compared to the standard thresholds. Further, these results support the hypothesis that the current estimates of the 95% C.I. for a mixture of NAGM+NAWM produce similar results compared to the standard ΔADC threshold used in human fDM analysis (10). Results from this analysis are illustrated in Figure 5A-B.
Figure 5.

Functional diffusion map results from volume and receiver-operator curve (ROC) analysis. A) Volume of “hypercellularity”, or decreasing ADC, for each ΔADC threshold shows significant differences between NAWM/NAGM ΔADC thresholds compared to standard thresholds. B) Volume of “hypocellularity”, or increasing ADC, shows significant differences between the NAWM ΔADC threshold and the standard thresholds. C) ROC curves for the different ΔADC thresholds. D) Area under the ROC curve (AUC) for the different ΔADC thresholds. * = P < 0.05; ** = P < 0.01, *** = P < 0.001.
ROC curves classifying progressive disease from stable disease using the time rate of change in hypercellular volume for each of the ΔADC thresholds are illustrated in Figure 5C. Qualitatively, the ΔADC threshold defined by the 95% C.I. of NAWM+NAGM (ΔADC = 0.4 × 10⁻³ mm2/s) appeared to have both a higher sensitivity and specificity compared to the other ΔADC thresholds (red line in Figure 5C). The ΔADC threshold defined by the 95% C.I. of NAWM (ΔADC = 0.25 × 10⁻³ mm2/s) appeared to have lower specificity compared to other thresholds, but higher sensitivity as indicated by the shape of the blue line in Figure 5C. Quantitatively, all ΔADC thresholds could classify progressive from stable disease better than chance (AUC, P<0.001 compared to chance); however, there were no statistical differences between the AUC between the ΔADC thresholds (One-way ANOVA, P = 0.6783; Figure 5D). These results suggest the fDM analysis is reasonably robust, regardless of the particular threshold used for voxel stratification.
Biological Sensitivity of fDMs
Using the sensitivity of ADC measurement to tumor cell density determined after testing Hypothesis 1, it was possible to estimate the minimum increase in cell density required for hypercellular classification using each of the five ΔADC thresholds defined in Hypothesis 2. When using the 95% C.I. for NAWM as the ΔADC threshold (i.e. ΔADC > 0.25 × 10⁻³ mm2/s), a minimum increase in cell density of 2475 nuclei/mm2 (or approximately 12 nuclei/HPF) is required before a voxel will be classified as hypercellular. Using the 95% C.I. for NAGM as the ΔADC threshold (i.e. ΔADC > 0.31 × 10⁻³ mm2/s), a minimum increase in cell density of 3069 nuclei/mm2 (or approximately 15 nuclei/HPF) is required for a voxel to be classified as hypercellular. In addition, a minimum increase in cell density of 3960 nuclei/mm2 (or 19 nuclei/HPF) was required for hypercellular classification using the 95% C.I. for NAWM+NAGM (i.e. ΔADC > 0.4 × 10⁻³ mm2/s), a minimum increase in cell density of 7426 nuclei/mm2 (or 35 nuclei/HPF) was required for hypercellular classification using the 95% C.I. for NAWM+NAGM+CSF (ΔADC > 0.75 × 10⁻³ mm2/s), whereas a minimum increase in cell density of 5445 nuclei/mm2 (or approximately 26 nuclei/HPF) was required for hypercellular classification using the standard ADC thresholds typically used for human fDM analysis (ΔADC > 0.55 × 10⁻³ mm2/s). Table 2 summarizes the different tissue mixtures, ΔADC thresholds, and the biological sensitivities to these thresholds.
Discussion
To our knowledge, this was the first study to comprehensively examine, validate, and clarify the biological and clinical implications of the ΔADC thresholds used for human fDM analysis. The current study suggests fDMs should be constructed using a ΔADC threshold of 0.40 × 10⁻³ mm2/s, which was based on the 95% C.I. for NAWM and NAGM in a large patient population (n = 69) evaluated for time intervals ranging from 1 week to 1 year post-baseline. This particular ΔADC threshold was chosen based on a slightly better performance on ROC analysis compared to the other thresholds as measured by the AUC; however, all ΔADC thresholds were able to separate progressive disease from stable disease, differing only in their relative sensitivity and specificity. This particular threshold (0.4×10⁻³ mm2/s) is also in agreement with ΔADC thresholds regularly used in pre-clinical models (11). Results from the current study also suggest that the standard ADC threshold of 0.55 × 10⁻³ mm2/s will produce statistically similar measures of hypercellular or hypocellular volumes (and fractional volumes) compared to the 0.4×10⁻³ mm2/s ΔADC threshold, albeit slightly worse sensitivity for detecting progressive disease, which supports the possibility of future comparisons between results obtained with the new thresholds and previous human fDM studies using the standard ΔADC thresholds (12,13).
In addition to better defining the basis for ΔADC thresholds used in fDM classification, this is the first study to quantitatively determine the biological implications of the ΔADC thresholds used in human fDM analysis. Consistent with the literature (1-8), results from the current study support the hypothesis that tumor cell density is inversely proportional to ADC measurement. Based on our results, an ADC threshold of 0.40 × 10⁻³ mm2/s corresponds to an approximate increase in tumor cellularity of 3960 nuclei/mm2, or approximately 19 nuclei/HPF. These estimates of cell density are slightly higher than those reported in 9L glioma cells in pre-clinical models (3) and human gliomas evaluated upon resection (20), as illustrated in Table 2; however, our estimates were within one standard deviation of these studies (3,20). Therefore, the results from the current study support the hypothesis that fDMs can be used as a relatively simple imaging biomarker for monitoring changes in human glioma cellularity.
Results from the current study suggest that a ΔADC threshold of 0.25 × 10⁻³ mm2/s may be useful when higher sensitivity to changes in cellularity (at the expense of specificity) are desired (minimum change in cell density of approximately 2475 nuclei/mm2, or 12 nuclei/HPF). This lower ΔADC threshold may also be useful for visualizing and quantifying tumor migration in patients suspected of having predominantly infiltrating tumors, which migrate preferentially along white matter tracts (21). Further, this threshold appears high enough to exclude normal changes in ADC that may occur during steroid use in gliomas, estimated near 0.18 × 10⁻³ mm2/s in some studies (22), which could potentially confound fDM interpretation. Alternatively, the 95% C.I. for NAWM+NAGM+CSF may be beneficial when high specificity of disease progression is desired, such as searching for satellite tumors or visualizing the entire tumor burden within the whole brain (Figure 6A).
Figure 6.
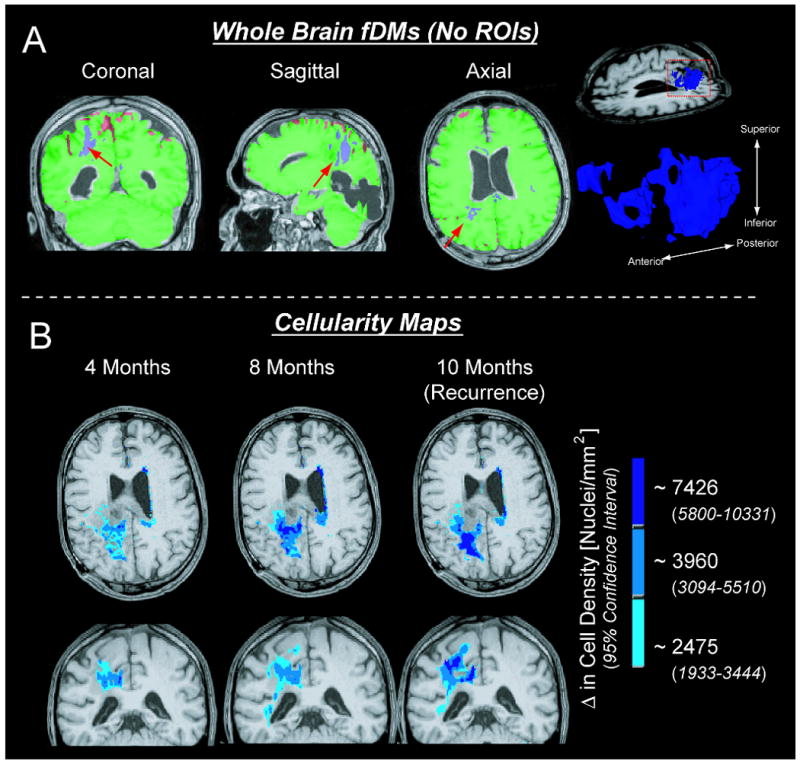
Novel applications of the fDM technique using ΔADC thresholds and cell density estimates found in the current study. A) By using the 95% confidence interval for a mixture of normal-appearing white matter, gray matter, and cerebrospinal fluid as the ΔADC threshold, no regions of interest need to be defined (whole brain fDMs). Arrows show regions of suspected tumor. B) Using the cell density estimates for ΔADC thresholds allows for “cellularity maps” to be generated, showing both the relative degree of cellularity and volume of suspected tumor.
Cell Density Mapping
An intuitive extension to the current study is the possibility of creating “cellularity maps”, which could illustrate spatial growth of hypercellular regions as well as the relative degree of cell density within these regions. As an example, we created composite fDMs by labeling hypercellular voxels (voxels with a decrease in ADC) that fall into all three ΔADC regimes (ΔADC > 0.25 × 10⁻³ mm2/s, ΔADC > 0.40 × 10⁻³ mm2/s, and ΔADC > 0.75 × 10⁻³ mm2/s), or cell density ranges (Δ cellularity > 2475 nuclei/mm2 or 12 nuclei/HPF, Δ cellularity > 3069 nuclei/mm2 or 15 nuclei/HPF, and Δ cellularity > 7426 nuclei/mm2 or 35 nuclei/HPF). Figure 6B shows these maps in a single patient evaluated at three different post-baseline time points leading up to radiographic recurrence as indicated by an increase in the contrast-enhanced volume of post-contrast T1-weighted images. To illustrate the degree of cellularity distributed spatially throughout the brain, we have labeled each ΔADC threshold according to the minimum change in cellularity needed to exceed that threshold. As suggested by the data in Figure 6B, the volume of hypercellularity, as well as the relative degree of cellularity, increased prior to radiographic tumor recurrence.
Biologically-based ΔADC Thresholds
Currently, the standard fDM technique involves using a specified ΔADC threshold to classify a voxel as having increasing or decreasing cellularity. Alternatively, one might propose using a specific change in cell density as a factor for voxel classification instead of using a ΔADC threshold. As an initial estimate of this possible threshold, the simulation and experimental work by Swanson et al. (23,24) proposes a change in cell density near 10 nuclei/HPF, which was suggested to be the threshold of detection for an expert histopathologist. According to our results, this change in cell density corresponds approximately to a ΔADC threshold near 0.21 × 10⁻³ mm2/s. This particular threshold can also be characterized as reflecting the 90% C.I. for NAWM, 80% C.I. for NAGM, or 77% C.I. for NAWM+NAGM.
Although a biologically-based ΔADC threshold may be useful, studies by Swanson et al. (23,24) and Murray (25) suggest that both a change in cell density and tumor volume growth rate are necessary for completely characterizing proliferation and motility of gliomas. The “cellularity mapping” technique illustrated in Figure 6B, for example, allows for both the relative degree of cellularity (proliferation) and the volume of hypercellularity (volume growth rate) to be non-invasively quantified. In summary, a combination of a minimum ΔADC threshold, minimum change in cellularity, and tumor volume growth rate may be necessary for fDMs to predict the pattern and timing of tumor recurrence.
Technical and Clinical Considerations
Although the fDM approach is fairly straightforward, a few technical and clinical challenges should be addressed. First, proper alignment of sequential images to the baseline images is critical for accurate fDMs. Significant mass effect from tumor growth or intracranial pressure induced by edema may skew registration between DWI datasets. Suspected tumor regions near gyri, sulci, or the ventricles can also cause erroneous results from misregistration effects. To overcome these challenges, we chose to use two sequential automated registration steps followed by manual inspection. In addition, our experience suggests an additional form of elastic (non-linear) registration is beneficial for the registration of significantly distorted datasets, such as the ART algorithm developed and tested by Ardekani et al. (26).
Proper choice of b-values used to accurately estimate ADC is an important aspect of fDM implementation that must be addressed. Per the recommendations of the National Cancer Institute Diffusion MRI Consensus Conference (27), three or more b-values (0 s/mm2, >100 s/mm2, and >500 s/mm2) should be used for an adequate estimate of ADC that is also perfusion-insensitive (by using at least two b-values > 100 s/mm2). Additionally, the choice of b-values greater than 1500 s/mm2 results in a multi-exponential signal decay, where a single estimate of ADC may not be appropriate. Unfortunately, the current study was performed retrospectively and so many of the consensus recommendations could not be implemented.
As previously noted, use of the terms “hypercellularity” and “hypocellularity” instead of “decreasing ADC” and “increasing ADC” in the current study may be misleading, since many pathologies and clinical scenarios can alter ADC measurements. According to our recommendations, clinical translation of the fDM technique to monitor tumor growth should involve integration of interpretations from various specialists to rule out the possibility of confounding factors.
In summary, we have comprehensively evaluated the ΔADC thresholds used for fDM tissue classification, defining both the biological and clinical sensitivity of these thresholds. Our results support the hypothesis that ADC is inversely proportional to glioma cell density. Based on our findings and the recommendations from the literature, we have determined specific ΔADC thresholds defined by a minimum biological sensitivity. Additionally, we briefly introduced a new imaging tool (cellularity maps) that may allow for non-invasive quantification of both proliferation and motility of human gliomas.
Acknowledgments
Grant Support: NIH/NCI R21-CA109820; MCW Advancing Healthier Wisconsin; MCW Translational Brain Tumor Research Program; MCW Cancer Center Fellowship
References
- 1.Sugahara T, Korogi Y, Kochi M, Ikushima I, Shigematu Y, Hirai T, Okudo T, Liang L, Ge Y, Komohara Y, Ushio Y, Takahashi M. Usefulness of diffusion-weighted MRI with echo-planar technique in the evaluation of cellularity in gliomas. J Magn Reson Imaging. 1999;9:53–60. doi: 10.1002/(sici)1522-2586(199901)9:1<53::aid-jmri7>3.0.co;2-2. [DOI] [PubMed] [Google Scholar]
- 2.Lyng H, Haraldseth O, Rofstad EK. Measurements of cell density and necrotic fraction in human melanoma xenografts by diffusion weighted magnetic resonance imaging. Magn Reson Med. 2000;43(6):828–836. doi: 10.1002/1522-2594(200006)43:6<828::aid-mrm8>3.0.co;2-p. [DOI] [PubMed] [Google Scholar]
- 3.Chenevert TL, Stegman LD, Taylor JM, Robertson PL, Greenberg HS, Rehemtulla A, Ross BD. Diffusion magnetic resonance imaging: an early surrogate marker for therapeutic efficacy in brain tumors. J Natl Cancer Inst. 2000;92(24):2029–2036. doi: 10.1093/jnci/92.24.2029. [DOI] [PubMed] [Google Scholar]
- 4.Hayashida Y, Hirai T, Morishita S, Kitajima M, Murakami R, Korogi Y, Makino K, Nakamura H, Ikushima I, Yamura M, Kochi M, Kuratsu JI, Yamashita Y. Diffusion-weighted imaging of metastatic brain tumors: comparison with histologic type and tumor cellularity. AJNR Am J Neuroradiol. 2006;27(7):1419–1425. [PMC free article] [PubMed] [Google Scholar]
- 5.Manenti G, Di Roma M, Mancino S, Bartolucci DA, Palmieri G, Mastrangeli R, Miano R, Squillaci E, Simonetti G. Malignant renal neoplasms: correlation between ADC values and cellularity in diffusion weighted magnetic resonance imaging at 3 T. Radiol Med. 2008;113(2):199–213. doi: 10.1007/s11547-008-0246-9. [DOI] [PubMed] [Google Scholar]
- 6.Gauvain KM, McKinstry RC, Mukherjee P, Perry A, Neil JJ, Kaufman BA, Hayashi RJ. Evaluating pediatric brain tumor cellularity with diffusion-tensor imaging. AJR Am J Roentgenol. 2001;177(2):449–454. doi: 10.2214/ajr.177.2.1770449. [DOI] [PubMed] [Google Scholar]
- 7.Kinoshita M, Hashimoto N, Goto T, Kagawa N, Kishima H, Izumoto S, Tanaka H, Fujita N, Yoshimine T. Fractional anisotropy and tumor cell density of the tumor core show positive correlation in diffusion tensor magnetic resonance imaging of malignant tumors. Neuroimage. 2008;43(1):29–35. doi: 10.1016/j.neuroimage.2008.06.041. [DOI] [PubMed] [Google Scholar]
- 8.Kono K, Inoue Y, Nakayama K, Shakudo M, Morino M, Ohata K, Wakasa K, Yamada R. The role of diffusion-weighted imaging in patients with brain tumors. AJNR Am J Neuroradiol. 2001;22(6):1081–1088. [PMC free article] [PubMed] [Google Scholar]
- 9.Chenevert TL, McKeever PE, Ross BD. Monitoring early response of experimental brain tumors to therapy using diffusion magnetic resonance imaging. Clin Cancer Res. 1997;3:1457–1466. [PubMed] [Google Scholar]
- 10.Moffat BA, Chenevert TL, Lawrence TS, Meyer CR, Johnson TD, Dong Q, Tsien CI, Mukherji S, Quint DJ, Gebarski SS, Robertson PL, Junck L, Rehemtulla A, Ross BD. Functional diffusion map: A noninvasive MRI biomarker for early stratification of clinical brain tumor response. Proc Nat Acad Sci. 2005;102(15):5524–5529. doi: 10.1073/pnas.0501532102. [DOI] [PMC free article] [PubMed] [Google Scholar]
- 11.Moffat BA, Chenevert TL, Meyer CR, McKeever PE, Hall DE, Hoff BA, Johnson TD, Rehemtulla A, Ross BD. The functional diffusion map: An imaging biomarker for the early prediction of cancer treatment outcome. Neoplasia. 2006;8(4):259–267. doi: 10.1593/neo.05844. [DOI] [PMC free article] [PubMed] [Google Scholar]
- 12.Hamstra DA, Galbán CJ, Meyer CR, Johnson TD, Sundgren PC, Tsien CI, Lawrence TS, Junck L, Ross DJ, Rehemtulla A, Ross BD, Chenevert TL. Functional diffusion map as an early imaging biomarker for high-grade glioma: correlation with convensional radiologic response and overall survival. J Clin Oncol. 2008;26(10):3387–3394. doi: 10.1200/JCO.2007.15.2363. [DOI] [PMC free article] [PubMed] [Google Scholar]
- 13.Hamstra DA, Chenevert TL, Moffat BA, Johnson TD, Meyer CR, Mukherji S, Quint DJ, Gebarski SS, Fan X, Tsien CI, Lawrence TS, Junck L, Rehemtulla A, Ross BD. Evaluation of the functional diffusion map as an early biomarker of time-to-progression and overall survival in high-grade glioma. Proc Nat Acad Sci. 2005;102(46):16759–16764. doi: 10.1073/pnas.0508347102. [DOI] [PMC free article] [PubMed] [Google Scholar]
- 14.Cox RW, Jesmanowicz A. Real-time 3D image registration for functional MRI. Magn Reson Med. 1999;42:1014–1018. doi: 10.1002/(sici)1522-2594(199912)42:6<1014::aid-mrm4>3.0.co;2-f. [DOI] [PubMed] [Google Scholar]
- 15.Ellingson BM, Malkin MG, Rand SD, Bedekar DP, Schmainda KM. Functional diffusion maps applied to FLAIR abnormal areas are valuable for the clinical monitoring of recurrent brain tumors. Proc Intl Soc Mag Reson Med. 2009;17:285. [Google Scholar]
- 16.Ellingson BM, Malkin MG, Rand SD, Hoyt A, Connelly J, Bedekar DP, Kurpad SN, Schmainda KM. Comparison of cytotoxic and anti-angiogenic treatment responses using functional diffusion maps in FLAIR abnormal regions. Proc Intl Soc Mag Reson Med. 2009;17:1010. [Google Scholar]
- 17.Karnofsky DA, Burchenal JH. The clinical evaluation of chemotherapeutic agents in cancer. In: MacLeod CM, editor. Evaluation of Chemotherapeutic Agents. New York: Columbia University Press; 1949. pp. 191–205. [Google Scholar]
- 18.Mor V, Laliberte L, Morris JN, Wiemann M. The Karnofsky performance scale: An examination of its reliability and validity in a research setting. Cancer. 1984;53:2002–2007. doi: 10.1002/1097-0142(19840501)53:9<2002::aid-cncr2820530933>3.0.co;2-w. [DOI] [PubMed] [Google Scholar]
- 19.Macdonald DR, Cascino TL, Schold SC, Jr, Cairncross JG. Response criteria for phase II studies of supratentorial malignant glioma. J Clin Oncol. 1990;8(7):1277–1280. doi: 10.1200/JCO.1990.8.7.1277. [DOI] [PubMed] [Google Scholar]
- 20.Gupta RK, Cloughesy TF, Sinha U, Garakian J, Lazareff J, Rubino G, Rubino L, Becker DP, Vinters HV, Alger JR. Relationships between choline magnetic resonance spectroscopy, apparent diffusion coefficient and quantitative histopathology in human gliomas. J Neurooncol. 2000;50:215–226. doi: 10.1023/a:1006431120031. [DOI] [PubMed] [Google Scholar]
- 21.Mørk S, Laerum OD, deRitter L. Invasiveness of tumours of the central nervous system. In: Mareel MM, Calman K, editors. Tumor Invasion. New York, NY: Oxford University Press; 1984. pp. 79–125. [Google Scholar]
- 22.Armitage PA, Schwindack C, Bastin ME, Whittle IR. Quantitative assessment of intracranial tumor response to dexamethasone using diffusion, perfusion and permeability magnetic resonance imaging. Magn Reson Imaging. 2007;25:303–310. doi: 10.1016/j.mri.2006.09.002. [DOI] [PubMed] [Google Scholar]
- 23.Swanson KR, Alvord EC, Jr, Murray JD. A quantitative model for differential motility of gliomas in grey and white matter. Cell Prolif. 2000;33(5):317–329. doi: 10.1046/j.1365-2184.2000.00177.x. [DOI] [PMC free article] [PubMed] [Google Scholar]
- 24.Swanson KR, Bridge C, Murray JD, Alvord EC., Jr Virtual and real brain tumors: using mathematical modeling to quantify glioma growth and invasion. J Neurol Sci. 2003;16(1):1–10. doi: 10.1016/j.jns.2003.06.001. [DOI] [PubMed] [Google Scholar]
- 25.Murray JD. Mathematical Biology. New York, NY: Springer-Verlag; 2002. [Google Scholar]
- 26.Ardekani BA, Guckemus S, Bachman A, Hoptman MJ, Wojtasek M, Nierenberg J. Quantitative comparison of algorithms for inter-subject registration of 3D volumetric brain MRI scans. J Neurosci Methods. 2005;142(1):67–76. doi: 10.1016/j.jneumeth.2004.07.014. [DOI] [PubMed] [Google Scholar]
- 27.Padhani AR, Liu G, Mu-Koh D, Chenevert TL, Thoeny HC, Takahara T, Dzik-Jurasz A, Ross BD, Van Cauteren M, Collins D, Hammoud DA, Rustin GJS, Taouli B, Choyke PL. Diffusion-weighted magnetic resonance imaging as a cancer biomarker: consensus and recommendations. Neoplasia. 2009;11(2):102–125. doi: 10.1593/neo.81328. [DOI] [PMC free article] [PubMed] [Google Scholar]