

Abstract
The development of acquired epilepsy after a perinatal hypoxic–ischemic (HI) insult was investigated in rats. After unilateral carotid ligation with hypoxia on postnatal day 7, cortical electroencephalographic and behavioral seizures were recorded with continuous radio-telemetry and video. Chronic recordings were obtained between 2 and 12 months of age in freely behaving HI-treated and sham control rats. The hypotheses were that the acquired epilepsy is directly associated with an ischemic infarct (i.e., no lesion, no epilepsy), and the resultant epilepsy is temporally progressive. Every HI-treated rat with a cerebral infarct developed spontaneous epileptiform discharges and recurrent seizures (100%); in contrast, no spontaneous epileptiform discharges or seizures were detected with continuous monitoring in the HI-treated rats without infarcts. The initial seizures at 2 months generally showed focal onset and were nonconvulsive. Subsequent seizures had focal onsets that propagated to the homotopic contralateral cortex and were nonconvulsive or partial; later seizures often appeared to have bilateral onset and were convulsive. Spontaneous epileptiform discharges were initially lateralized to ipsilateral neocortex but became bilateral over time. The severity and frequency of the spontaneous behavioral and electrographic seizures progressively increased over time. In every epileptic rat, seizures occurred in distinct clusters with seizure-free periods as long as a few weeks. The progressive increase in seizure frequency over time was associated with increases in cluster frequency and seizures within each cluster. Thus, prolonged, continuous seizure monitoring directly demonstrated that the acquired epilepsy after perinatal HI was progressive with seizure clusters and was consistently associated with a cerebral infarct.
Introduction
Sequelae of perinatal hypoxic–ischemic (HI) encephalopathy include cerebral palsy, mental retardation, and epilepsy (Sarnat and Sarnat, 1976; Finer et al., 1981; Bergamasco et al., 1984; Marín-Padilla, 2000a,b; Aneja et al., 2001; Badawi et al., 2005; Nelson, 2008). Thus, perinatal HI is a significant cause of mortality and morbidity in children (Volpe, 1981). Epilepsy in the setting of perinatal brain injury and cerebral palsy is often intractable (Hadjipanayis et al., 1997). It is unknown whether intractability is a consequence of the initial insult or whether the epilepsy progresses to intractability as a consequence of “seizures begetting seizures” (Gower, 1885) or as a consequence of normal developmental processes occurring in a previously damaged brain. Both cerebral palsy and the associated epilepsy correlate with the neuroimaging evidence of brain injury (Kulak and Sobaniec, 2003; Wu et al., 2006), suggesting that the severity of brain injury is an important determinant of subsequent epilepsy.
Animal models of neonatal stroke are potentially useful to study the temporal evolution of acquired pediatric epilepsy (Kelly, 2002). Although the evolution of epileptogenesis after status epilepticus has been studied in adult rodents (Bertram and Cornett, 1993, 1994; Nissinen et al., 2000; Williams et al., 2009), the natural history of the development of spontaneous recurrent seizures after experimental perinatal stroke remains to be investigated. In the Rice–Vannucci model (Rice et al., 1981) of perinatal stroke, progressive histopathogical changes occur over time after ischemic lesions (Kadam and Dudek, 2007), and these alterations are similar to those reported for ischemic lesions in immature human brains (Marín-Padilla, 2000a,b). Additionally, the detection of spontaneous recurrent seizures after stroke in this model (Williams et al., 2004; Williams and Dudek, 2007) provides an opportunity to examine the progression of epilepsy after HI lesions in adults and immature animals. Understanding the temporal profile of the post-stroke epilepsy has important implications for identifying the mechanisms underlying epileptogenesis.
Previous studies in hypoxia-treated rat pups at postnatal day 10 have reported increased seizure susceptibility to flurothyl 2 months after hypoxia (Jensen et al., 1992; Jensen, 1999). On histological examination, however, no neuronal loss was reported. The significance of increased seizure susceptibility in animal models of neonatal hypoxia without neuronal death to the evolution of post-stroke epilepsy (i.e., spontaneous recurrent seizures) is not well understood. In the present study, the natural history of the epilepsy after perinatal HI was investigated in a model with and without clear ischemic infarcts. These experiments tested the hypotheses that epilepsy occurs only when perinatal HI induces an infarct (i.e., no infarct, no epilepsy) and that the epilepsy is temporally progressive (i.e., the frequency and severity of spontaneous recurrent seizures increases over time). To address these hypotheses, virtually continuous radio-telemetry recording of electroencephalograms (EEGs) and their behavioral correlates were obtained over many months during the first year of life after an HI insult at postnatal day 7.
Materials and Methods
Surgical procedure for the HI model.
The modified Levine's method (Levine, 1960; Rice et al., 1981) in postnatal day 7 rat pups was used to model the parasagittal “watershed” cortical infarcts commonly seen in human neonates after hypoxic encephalopathy (Volpe, 1981). This model leads to infarcts with lesions of variable size, and not all animals have a lesion. Sprague Dawley male and female rats 7 d of age were anesthetized using a 2% isoflurane/oxygen mixture. The ventral midline of the neck was surgically prepared and infused with bupivicane (0.5%, 0.2 ml). A 0.5 cm ventral midline incision was made, and the right common carotid artery was exposed and double ligated unilaterally with 4-0 surgisilk (polyglactin/braided). The skin was closed with 4-0 surgisilk. Age-matched sham controls had the carotid artery exposed under the same anesthesia but were not ligated. After a 2 h recovery period, the rat pups with the ligated carotid artery were placed in a hypoxia chamber in which the temperature and humidity were maintained at 37°C and 90%, respectively. The chamber was then filled with 8% oxygen and 92% nitrogen mixture. The rat pups were exposed to 8% oxygen for 2 h, then allowed to recover in room air, and placed with their mother and littermates. Histology was conducted by cresyl violet staining of coronal sections from the brains of HI-treated rats with infarcts (i.e., porencephalic cysts and gliotic scars predominantly in the watershed zones and perfusion territory of the middle cerebral artery, which were likely amenable to detection by imaging), HI-treated rats without detectable infarcts (i.e., no detectable infarction or cell death with microscopic examination), and sham control rats (Kadam and Dudek, 2007). Brains from HI-treated rats with no infarcts appeared grossly similar to controls (Fig. 1 A,B). Brains from HI-treated rats with lesions revealed that the contralateral hemisphere showed no obvious lesions (Fig. 1 D), whereas the ipsilateral parasagittal infarcts were seen with relatively intact cingulate and paracingulate cortices (Fig. 1 C).
Figure 1.
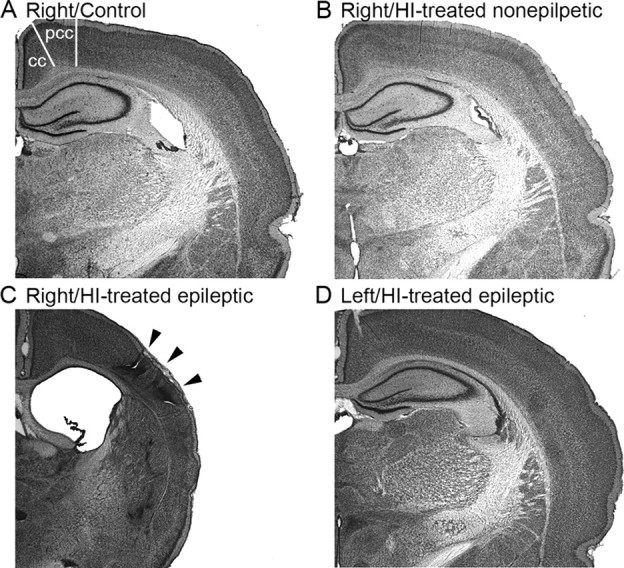
Unilateral infarct after ligation of the right carotid artery at postnatal day 7. A–C, Coronal sections from control animal (A), HI-treated animal without an ischemic lesion (B), and an HI-treated rat with a clear ischemic lesion (C, D). The rat brains were stained with cresyl violet (i.e., Nissl stain). Right hemispheres in A and B are comparable, in contrast to C, which shows the parasagittal infarct (arrowheads) and related cortical atrophy and an enlarged lateral ventricle. The contralateral (left) hemisphere (D) is shown from the same section as in C and illustrates that the left hemisphere was not lesioned. cc, Cingulate cortex; pcc, paracingulate cortex.
Radio-telemetry.
The radio-telemetry recording and analysis equipment for the continuous recording of EEG and behavioral monitoring has been described previously (White et al., 2006; Williams et al., 2006). Briefly, male and female Sprague Dawley rats that underwent surgery for continuous recording of cortical EEGs were individually housed in cages under a 12 h light/dark cycle (lights on at 6:00 A.M.). Single-housed freely behaving HI-treated or control rats implanted with telemetry units (DSI model TL10M3-F50-EEE magnet-activated transmitters; Transoma Medical) that had three bipolar electrographic channels were positioned on a receiver plate (RPC-1; Transoma Medical) that collected and sent EEG signals from the telemetry unit to the data exchange matrices (Data Sciences International). The digital data were converted to an analog signal by the DSI A.R.T. analog software (Transoma Medical). This analog signal was reconverted into digital data to be recorded and stored on a computer with custom-written software (White et al., 2006) in Visual Basic 6.0 (Microsoft) that created a new file for each animal every 24 h, beginning at 12:00 A.M.
Video monitoring.
Every rat was also simultaneously video monitored 24 h/d throughout the duration of the EEG recordings with video cameras. Two Color Quad Observation Systems (SOD14C4LN; Samsung), which allowed for the video recording of eight animals simultaneously, were used. The time stamps for these systems were synchronized to the EEG digitizing computer. The individual cameras were placed 50 cm from each rat cage; the outputs from four cameras were connected to the four-channel video system, and the output from the video system was connected to three Panasonic VCRs. Each VCR was programmed to record consecutive periods on 8 h VHS tapes in extended play mode. Night recordings were performed with a Kodak 1A filter (Eastman Kodak) over a safelight and daytime recordings with a diffuse fluorescent light. The behavioral data were used in this study for visualization of seizure semiology, grading individual seizures, and differentiating EEG seizure activity from electrical noise generated by movement artifacts (White et al., 2006).
Surgical procedure for implanting telemetry units and subdural electrodes.
The stereotaxic unit was sprayed with 95% alcohol, and all surgical tools were autoclaved and maintained sterile intraoperatively with a glass-bead sterilizer. Rats were given prophylactic antibiotic penicillin (300,000 IU) subcutaneously 15 min before surgery along with dexamethasone (4.0 mg/kg) and atropine (2 mg/kg, s.c.) and then anesthetized with 2% isoflurane. The surgical site was clipped and cleaned with Betadine scrub and lotion. The incision site was isolated with sterile surgical towels. Bupivicaine (0.5 ml, 0.5%) was injected at the incision site for local anesthesia before making the incision. A 2 cm longitudinal midline incision was made through the scalp. The periosteum was removed and hemostasis achieved with gentle pressure application with sterile cotton tips and a cautery pen. Small holes were bored through the skull with a Dremel and #105 drill bit for electrode implantation. Recording electrodes were placed in the three locations using coordinates referenced to bregma (Fig. 2 A,B). The electrodes were fastened with dental acrylic, which was also used to cover and seal all exposed skull surfaces. Extending the incision caudally 1 cm, a subcutaneous pocket 5 cm long and 2 cm wide was created with blunt dissection, 2 cm caudal to the shoulder blades. The unit was then inserted deep enough into this pocket so that the wires laid flat against the deep fascia when the recording leads were in their final positions. Absorbable 4-0 Vicryl (polyglactin/braided) sutures were placed to eliminate any dead space between the subcutaneous tissue and muscle fascia along the rostral end of the tunnel, thus preventing potential peri-unit serum pockets from invading the area of electrode implantation under the scalp. The scalp incision was closed with 3-0 Dermalon (nonabsorbable monofilament nylon suture) achieving close approximation and primary healing of incision. Animals received antibiotic and analgesic treatments during 2 d of postsurgical recovery before the initiation of video-telemetry recording.
Figure 2.

Schematic diagrams of the electrode placement for chronic radio-telemetric monitoring of cortical EEG and of the recording periods in the study. A, Dorsal skull surface of rat showing locations of the three subdural, bipolar recording electrodes over the two hemispheres (modified from Paxinos and Watson, 1998). B, Schematic diagram of the coronal view for the cortical surface locations of the three subdural electrodes. The electrodes were placed over the bilateral forelimb motor and paracingulate cortices, and their respective channel numbers are denoted for the recorded cortical EEG data. Ch1, Core of the ipsilateral cortical infarct (parasagittal unparallel lines in right neocortex denote ischemic lesion, IE); Ch2, ipsilateral paracingulate neocortex (medial to cortical infarct, PE); Ch3, contralateral cortex (CE). Cc, Cingulate cortex; Fr, frontal cortex; HL, hindlimb area of cortex; FL, forelimb area of cortex. C, Schematic diagram of the two recording periods after the postnatal day 7 ligation surgery.
Electrode placements.
The subdural electrodes (n = 3) were placed just caudal to bregma along the rostrocaudal axis, such that the electrodes overlaid the ipsilateral and contralateral parasagittal cortices (Fig. 2 A,B). The coordinates were based on initial histology conducted on HI-treated rats with lesions as shown in Figure 1 (Kadam and Dudek, 2007). The leads on the three-channel transmitters were cut to appropriate lengths, and the silicone covering was peeled back to expose 2–3 mm of the helical steel leads. The exposed ends of the leads were curved into tight C-shaped loops such that the distal end of the loop slid into the holes bored into the skull and the blunt end of the C faced the pial surface of the brain. Continuous EEG recordings were obtained with implanted subdural recording electrodes in bilateral hemispheres. Recording electrodes for channels 1 and 3 (Ch1 [infarct electrode (IE)] and Ch3 [contralateral electrode (CE)]) were placed 0.5 mm caudal to bregma and 3.5 mm lateral to midline over the forelimb area of the sensorimotor cortex bilaterally (Fig. 2 B). The recording electrode for channel 2 (Ch2 [parainfarct electrode (PE)]) was placed over the medial parainfarct cortex (paracingulate cortex) of the ipsilateral (right) hemisphere 0.5 mm caudal to bregma and 1 mm lateral to the sagittal suture. Reference electrodes for the three channels were placed at similar lateral coordinates to their respective recording electrodes but more caudally over the parietal cortex. The ground was placed caudal to the lambda suture over the right cerebellar hemisphere, and one self-tapping screw was placed over the opposite cerebellar hemisphere to strengthen the adhesion between the dental acrylic holding all of the leads in position and the skull. These implantation surgeries were performed at 2 months of age (animal weight, ∼200 g) in one group of animals and at 6 (or 8) months of age in another. Using these radio-telemetric implants, interictal spikes and electrographic seizures were recorded continuously.
Grading of seizures.
Synchronized video-EEG recording allowed viewing of specific time epochs on the VHS tape so that the behaviors associated with the cortical EEG activity could be noted. The behaviors associated with epileptiform activity on cortical EEGs were classified based on the Racine scale (grades 1–5) to define the severity of the motor seizures (Racine, 1972; Ben-Ari, 1985): grade 1, frozen (immobility with open eyes) and/or “wet-dog shakes” associated with facial automatisms (vibrissae twitching, jaw clonus, blepharospasms); grade 2, same behaviors as grade 1 with head bobbing; grade 3, forelimb clonus with a lordotic posture; grade 4, forelimb clonus continued along with rearing; grade 5, same behaviors as a grade 3 and 4 seizure, but the rats also fell over. Some rats fell to one side first and then showed evidence of forelimb clonus. Electrographic seizure activity with none of the behaviors described above was classified as grade 0.
Experimental design.
Equal number of male and female rats were monitored (n = 28, 14 male and 14 female). Eighteen rats were implanted at 2 months of age (12 HI-treated and 6 controls) for the 2–7 month group, and 10 rats at 6 (or 8) months of age (6 HI-treated and 4 controls) were recorded for the 7–11 month group (Fig. 2 C). The 2–7 month group was implanted at 2 months of age, because 2 months was the time required for the rats to attain the recommended weight for the surgical implantation of the telemetry unit (5.5 cc volume; 11.5 g weight; recommended minimum animal weight, 175 g). Rats that were implanted at 2 months of age yielded data for the first 5 months (2–7 months), and those implanted at 6 (or 8) months of age yielded data for the next 5 months (6–12 months, two rats were implanted at 8 months of age; Table 1). Animals were monitored for an average of 118.7 ± 7.7 d (minimum of 33 d and maximum of 166 d). Only 4 of 28 animals had <60 d of monitoring, which was because of loss of recordings attributable to noisy or dislodged electrodes. Every animal had a 24 h EEG file for every day in the system (i.e., number of files was equivalent to the number of days). The total number of recording days in the study was 3277 (1216 for HI-epileptic; 821 for HI non-epileptic; 1240 for sham control). EEG recordings that were lost attributable to computer-related technical issues amounted to 2.75% of the total dataset, but concomitant video data could still be analyzed. Every EEG file had synchronous video monitoring data (except for 0.24% loss attributable to a power failure), and these video data were viewed over specific time durations determined by the EEG analysis (Fig. 3). Of the 28 implanted rats, 10 were randomly selected male and female sham controls (5 of each gender) from 6 different litters. Eighteen were HI-treated male and female (9 of each gender) rats from 8 different litters. The 10 of 18 rats that were found to be epileptic (5 of each gender, 5 from each age group) were monitored for an average of 121.6 ± 16.8 d (for details of monitoring for individual epileptic rats, refer to Table 1). HI-treated non-epileptic and sham control rats were monitored for an average of 102.6 ± 13.8 and 124 ± 8.2 d, respectively.
Table 1.
Characteristics of epileptic rats in telemetry study
| Rat identity | Age (months) | Sex | Time recorded (days) | Seizure rate per day | Injury severity (% atrophy) a | Reason for end of recording |
|---|---|---|---|---|---|---|
| Al | 2 | Male | 158 | 0.16 | 57 | Battery |
| A2 | 2 | Female | 155 | 0.45 | 48 | Battery |
| A3 | 2 | Male | 155 | 0.26 | 77 | Battery |
| A4 | 2 | Male | 166 | 0.22 | 67 | Battery |
| A5 | 2 | Female | 33 | 0.09 | 70 | Rat died |
| B1 | 6 | Male | 152 | 0.96 | 79 | Battery |
| B2 | 6 | Male | 150 | 0.67 | 62 | Battery |
| B3 | 8 | Female | 143 | 0.59 | 35 | Battery |
| B4 | 8 | Female | 51 | 0.92 | 31 | Lost recording |
| B5 | 6 | Female | 53 | 0.11 | 64 | Lost recording |
Two groups of rats were implanted with telemetry units for continuous EEG recording for periods covering 2–7 and 6–11 months of age (groups A and B, respectively). Ten HI-treated rats (5 from each age group) were detected to be epileptic in this study.
aLesion severity was calculated as percentage atrophy of the injured hemisphere: [1 − (ipsilateral hemisphere area/contralateral hemisphere area)] × 100, using NIH Image J software to calculate areas at coordinate bregma −2.80 mm in the coronal plane.
Figure 3.
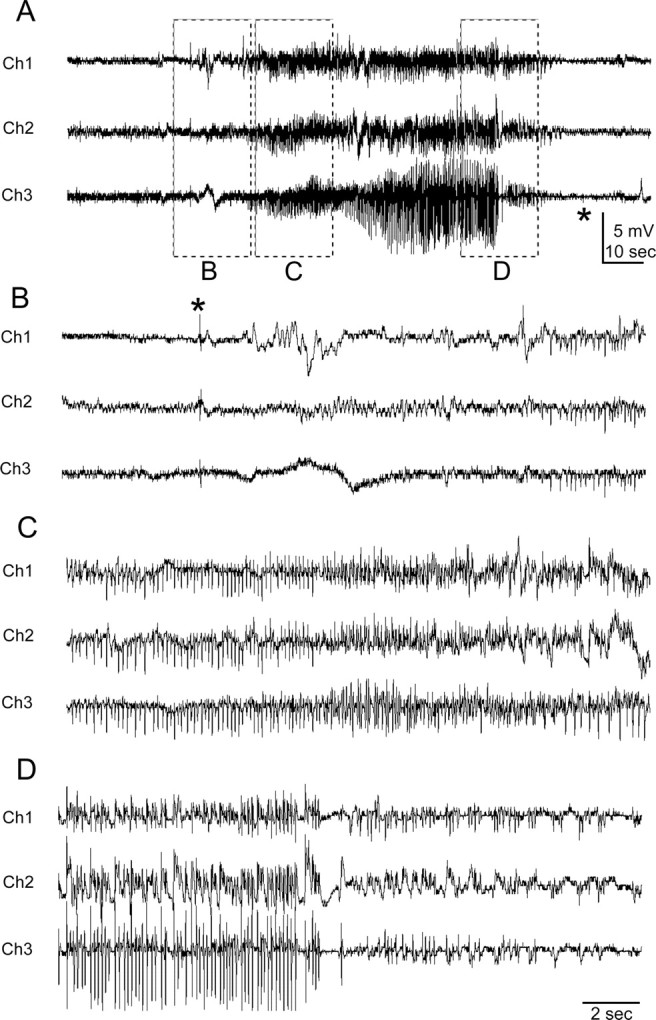
Representative spontaneous generalized seizure recorded with telemetry. The recording electrodes (Fig. 2) for this and the subsequent figures were located over the infarct (Ch1, IE), medial to the lesion at a parainfarct site (Ch2, PE), and on the contralateral neocortex (Ch3, CE). A, Trace of the entire grade 5 seizure that lasted 110 s. B–D represent the EEG trace of the same seizure with an expanded timescale and higher gain. B, Seizure initiation with a single large EEG spike (*) seen on all leads. C, Progression pattern of regular high-frequency, large-amplitude EEG spikes during the tonic phase of the seizure. D, EEG activity near the termination phase of the seizure in which EEG spikes became smaller in amplitude and interspersed with silent periods before termination of the seizure indicated by a silent EEG (* in A).
The EEG analysis was blinded, and thus the status of the possible brain damage of the HI-treated rats (S.D.K.) was unknown during the EEG analysis. The seizure-detection analysis was performed both visually and in a semiautomated manner with custom-written software (for details of the EEG analysis, see White et al., 2006). The behavioral data (from video monitoring) were used to confirm EEG seizure activity versus potential animal-generated noise. Interictal spikes were defined as <70 ms in duration, and sharp waves had durations that ranged from 70 to 200 ms (Brenner and Schaul, 1990). Distinction between these two patterns has been described to have no etiologic significance, the only difference being one of EEG pattern and morphology (Gotman, 1985; Gotman and Marciani, 1985). Histological analysis of any lesions was done on coded slides. Severity of stroke damage was determined at coordinate bregma −2.80 mm using NIH ImageJ and calculated as [1 − (ipsilateral hemispheric area/contralateral hemispheric area)] × 100 = percentage ipsilateral hemispheric atrophy].
Statistical analysis.
All values are expressed as means ± SEM. Statistical analysis for differences between group means was done with one-way ANOVAs. Correlations were calculated using Pearson's r test. p values of <0.05 were considered significant. Best-fit curves for data were plotted using SigmaPlot software (Systat Software).
Results
Histological findings
Permanent unilateral carotid ligation followed by hypoxia with 8% O2 produced a distinct ipsilateral cystic infarct (Kadam and Dudek, 2007) in the perfusion territory of the middle cerebral artery that spared the cingulate and medial sensorimotor cortex (Fig. 1 D) (n/n = 10/18). Every rat in the current study (n = 28, 18 HI-treated and 10 sham controls) had continuous chronic EEG (>97% of the time) and video monitoring (nearly 100% of the time) for the same duration. After completion of the video-EEG data acquisition and analysis, all rats were killed, the brains were fixed, and the sections were stained with cresyl violet (Kadam and Dudek, 2007). Figure 3 shows an example of an electrographic recording of a grade 5 seizure. All of the HI-treated rats (10 of 18; 56%) that were shown to have spontaneous recurrent seizures with continuous EEG recording (and, thus, to be epileptic) had an obvious cystic infarct (i.e., visible to the naked eye) in their ipsilateral hemisphere. Severity of the HI injury was variable and ranged between 30 and 78% (measured as percentage atrophy of the ipsilateral hemisphere compared with the contralateral hemisphere) (Table 1). Thus, these infarcts represent lesions that would be amenable to detection by imaging methods. However, no correlation was found (r 2 = −0.45, p = 0.3) between the severity of the cystic infarcts (Table 1) and the corresponding seizure rates of the chronic post-stroke epilepsy at 7 months of age (i.e., the last month of recording in the 2–7 month group and the first month of recording in the 6–11 month group). Some of the HI-treated rats (8 of 18; 44%) did not have observable, gross, HI-induced infarcts. Microscopic examination also did not reveal obvious injury in the form of neuronal loss or sclerosis in the hippocampus or neocortex, and, therefore, these animals appeared similar to sham controls (Fig. 1, compare A, B). Quantitative stereology was not conducted; therefore, it is possible that subtle losses in susceptible groups of neurons may not have been apparent on microscopic examination. However, none of the animals in this group of HI-treated nonlesioned rats was detected to have spontaneous seizures or epileptiform discharges. Therefore, all animals with spontaneous recurrent seizures (10 of 18; 56%) had an infarct, and all rats without spontaneous recurrent seizures (8 of 18; 44%) had no infarct (Fisher's exact test, p = 0.0001). The EEG data were analyzed (S.D.K.) on a week-to-week basis in real time blind to the presence or absence of an ischemic lesion. The lesioned or nonlesioned status for every HI-treated rat was only known after the brains were harvested and histologically stained at the end of the study. The occurrence of an insult-related infarct was consistently associated with epileptogenesis, and, furthermore, prolonged continuous recording under the same conditions revealed no detectable interictal spikes or seizures when a gross infarct was not present. Therefore, these recordings revealed that the acquired epileptogenesis for this model of perinatal HI was consistently associated with the lesion (i.e., infarct) from the stroke. Rats that did not have an ischemic lesion after the perinatal unilateral carotid ligation and period of hypoxia did not develop epileptiform discharges or spontaneous seizures when monitored for up to 5 months and as late as ∼1 year of age. In conclusion, the postnatal day 7 HI treatment did not result in delayed spontaneous recurrent seizures (i.e., acquired epilepsy) unless it also caused a clearly discernable ischemic lesion.
Seizure semiology
Behaviors during seizures are often used to localize or lateralize epileptogenic regions, particularly when EEGs are not found to be sufficient (Engel, 1993). In many cases, clinical manifestations of seizures reflect spread from the region of origin, which is especially true for postlesional epilepsies (Jacobs et al., 2000). The seizure semiology for the model with unilateral carotid ligation was hypothesized to identify the ipsilateral hemisphere as the prominent epileptogenic region. Every electrographic seizure and its corresponding behavioral semiology recorded on synchronous video monitoring (trace in Fig. 3 was behaviorally a grade 5 seizure) was graded for severity using the Racine scale (Racine, 1972). Of the 556 seizures detected in 10 epileptic rats, 483 were classified as grade 5 (Fig. 3), 22 as grade 4, and 51 as less than or equal to a grade 3 seizure. The seizures that were less than or equal to grade 3 included a subset of nonconvulsive seizures lacking behavioral features described in the Racine (1972) classification. Seizures were classified as grade 0 [n/n = 10/51 (20%) detected in 3 of 5 epileptic rats from the 2–7 month group] when associated with inactivity or “a hunkering down” posture with stretching of the torso followed by wet-dog shakes. No grade 0 seizures were recorded in the 6–11 month group. Seizure severity of grade 0–3 did not progress to generalized tonic–clonic behaviors and were classified as partial seizures. Seizure onsets commonly involved a clear and predominantly ispsiversive head and neck posturing (supplemental Fig. 1, available at www.jneurosci.org as supplemental material), sometimes involving the torso (n/n seizures = 115/556, 21%; n/n epileptic rats = 8/10, 80%), but some were contraversive (n/n seizures = 44/556, 8%; n/n epileptic rats = 4/10, 40%). Termination of tonic–clonic activity was usually followed by wet-dog shakes (supplemental Fig. 1, available at www.jneurosci.org as supplemental material). Grade 3 seizures, defined as lordotic posturing followed by forelimb clonus, were limited to a left forelimb clonus or forelimb clonus initiated in the left forelimb followed by progression to the right forelimb [detected in 4 of 5 (80%) epileptic rats from the 2–7 month group]. Grade 4 and 5 seizures progressed to tonic–clonic activity and were classified as convulsive seizures. Many of the convulsive seizures (grades 4 and 5) began with a left forelimb clonus (n/n seizures = 97/505, 19%; n/n epileptic rats = 8/10, 80%), indicating propagation of a focal onset to the homotopic contralateral hemisphere. Of the 556 seizures graded for 10 epileptic rats (n = 5 from each group) (Table 1), 173 were detected in the 2–7 month group (total of 667 d of monitoring, representing a mean value of 0.26 seizures per day) and 383 in the 6–11 month group (total of 549 d of monitoring, representing a mean value of 0.70 seizures per day). Of the 51 seizures that were less than grade 3, 36 were detected in the 2–7 month group (21% of the total seizures for the group) and 15 in the 6–11 month group (4% of the total seizures for the group). Thus, the distribution of partial seizures was not equal between the two groups, as determined by seizure semiology, with grade 0 seizures occurring only in the 2–7 month group. The seizure semiology supported the hypothesis of an ipsilateral (right hemisphere) onset of seizure activity that propagated contralaterally. As a function of time, however, most seizures either propagated so fast that they did not have the features of a focal onset or they had bilateral onsets.
Lateralization of onsets of interictal spikes and electrographic seizures and analysis of their spatiotemporal relationships
As a model for postlesional epilepsy with a unilateral infarct, it was hypothesized that the EEGs would manifest an ipsilateral origin for the electrographic activity (Hufnagel et al., 2000), particularly in light of the behavioral observations. Analysis of continuous EEG data revealed electrographic seizures (Fig. 3) and interictal activity (Fig. 4) in epileptic rats. Interictal spikes were detected on the first day of EEG recording in every rat later observed to show spontaneous recurrent seizures (n/n = 10/10, 100%) (White et al., 2006). Such activity was recorded as both spikes and sharp waves (Fig. 4) (see Materials and Methods). These epileptiform events were variable in amplitude but always distinct from baseline. The first detected interictal spike activity from the 2–7 month group showed ipsilateral lateralization (Fig. 4 A,B). Of the five rats that were found to be epileptic in the group, four rats showed lateralization in the form of isolated activity in the lead overlying the parainfarct neocortex (Ch2) (Fig. 2 B). Interictal spikes were also the first event detected on the EEG of the fifth rat, but they were seen on all three channels without a clear channel-specific initiation pattern. Some of the interictal spike events were recorded on both of the ipsilateral leads, overlying the infarct (Ch1) and the parainfarct neocortex (Ch2) with a clear initiation in Ch2 (Fig. 4 B) [3 of 5 rats (60%) from 2–7 month group]. Spikes were consistently recorded before and after seizures (Fig. 4 C) and most markedly between seizures that occurred as clusters in both the 2–7 month and 6–11 month groups of epileptic rats. EEG spike activity was sometimes as high as 1 Hz (Fig. 4 D). Lateralization of spike activity was not seen in interictal recordings from the 6–11 month group of epileptic rats. Therefore, lateralization of the interictal spikes was a characteristic of the relatively early recording periods (close to 2 months) and not the later periods (after 6 months).
Figure 4.

Interictal-spike and sharp-wave activity at 2 and 6 months after HI treatment. A, At 2 months, interictal spikes were often only recorded from the parainfarct electrode (Ch2). B, In other cases after 2 months, interictal spikes were recorded at both the parainfarct site (Ch2, PE) and over the infarct (Ch1, IE) with a clear onset of spike clusters adjacent to the lesion. Spike activity was rare on the contralateral electrode (Ch3, CE) at 2 months. C, D, After 6 months, the chronically epileptic rats showed interictal activity of variable frequency on the ipsilateral electrodes (Ch1 and Ch2) that was also consistently present on the contralateral electrode (Ch3). C, When interictal spikes were recorded on all three electrodes, the frequency could differ across the three channels (e.g., a lower frequency is shown on Ch2 compared with Ch1 and Ch3). D, When spikes occurred between seizures within a cluster, interictal spike frequency was higher (∼1 Hz) than between clusters. A1, B1, C1, and D1 illustrate individual spikes (<70 ms) and sharp waves (70 to 200+ ms) from near the center of the respective traces.
Lateralization of electrographic onsets for seizures was also seen predominantly in ipsilateral leads (i.e., Ch1 and Ch2). Initiation of seizure activity in the lead overlying the parainfarct neocortex (Ch2), followed by the lead overlying the infarct (Ch1), was seen in 27 of the 51 partial (less than or equal to grade 3) seizures (53%) (Fig. 5 A) and in the contralateral cortex (Ch3) for 6 of the 51 partial seizures (11%). Lateralization of seizure onsets was recorded in 6 of the 10 epileptic rats (5 of 5 from the 2–7 month group, 100%; 1 of 5 from the 6–11 month group, 20%) ipsilaterally and 1 of 10 rats contralaterally (10%). Initiation of grade 4 and 5 seizures (n = 483) was seen to occur simultaneously on all three leads, except for five seizures in one epileptic rat from the 6–11 month group, in which the spiking activity of the seizure was initiated in the lead overlying the parainfarct neocortex (Fig. 5 B, Ch2). Therefore, these data showed that the unilateral lesion induced at postnatal day 7 resulted in spontaneous recurrent seizures that were initially lateralized to the ipsilateral hemisphere in their EEG manifestations. Within the ipsilateral origins of early electrographic seizure activity, clear onsets in the lead overlying the parainfarct neocortex (Ch2) may indicate the paracingulate and sensorimotor cortices adjacent to the core of the infarct as the initial epileptogenic zone in this model. The clear cases of lateralized interictal spikes and focal onsets of electrographic seizure activity in the 2–7 month group compared with the bilateral spikes and simultaneous bilateral seizure onsets in the 6–11 month group (plus the associated seizure semiology; see above) support the hypothesis that this form of lesion-induced epilepsy is progressive, that is, because the initial epileptic seizures were lateralized to the lesioned side and several months later the seizures had onsets that included the contralateral hemisphere; the homotopic contralateral cortex appeared to have undergone a progressive epileptogenic process. Furthermore, the initial localization of both interictal and ictal discharges to the side ipsilateral to the infarct, followed later by more contralateral EEG spikes and seizure onsets, support the hypothesis that the EEG spikes are associated with epileptogenesis and may serve as a surrogate marker (White et al., 2010) (our unpublished observations). The absence of EEG spikes in recordings from HI-treated rats that were not found to be epileptic further supports this hypothesis.
Figure 5.

Onset of electrographic seizure activity: unilateral versus bilateral. A1, At 2 months of age, seizure onsets were recorded ipsilateral to the HI lesion. Examination of the three EEG channels (Ch1, IE; Ch2, PE; Ch3, CE) showed that seizure activity was initiated medial to the lesion (i.e., Ch 2, PE) seconds before spiking activity occurred over the ischemic lesion (Ch 1, IE), followed by activity over the contralateral hemisphere (Ch 3). A2 is an expansion of the EEG trace marked by a solid black line in A1. B, A representative tonic–clonic convulsive seizure (i.e., grade 5 on the Racine scale) recorded in a 6–11 month rat. Expansions in the bottom row show onset of seizure heralded by the initial large-amplitude sentinel spike (1), followed by rhythmic spiking activity first seen on Ch2 (2) and then on Ch2 and Ch3 (3). Low-amplitude high-frequency spiking was then seen in all three channels (4). Rhythmic 6–7 Hz large-amplitude synchronous spike-wave activity was seen on all three channels (5). Termination of the seizure occurred with large-amplitude, low-frequency spike-wave activity with intervening silent periods (6).
Progressive increase in seizure frequency and severity
The nearly continuous EEG monitoring enabled the assessment of progression of the post-stroke epilepsy after the perinatal HI injury. Specifically, it was hypothesized that a progressive worsening of the epilepsy over time would manifest as a time-dependent increase in seizure frequency and severity (Engel, 1996). Seizure frequency (Fig. 6 A) increased from a mean rate of 0.2 seizures per day at 3 months to 1.4 seizures per day at 12 months of age. This progressive increase fit the exponential growth phase of a sigmoid curve with the equation f = 223.8/(1 + exp (−(x − 18.1)/3.9), where x represents the advancing age of the rat in months (Fig. 6 B) (Williams et al., 2009). Assessment of seizure severity using the Racine scale (Racine, 1972) indicated lower seizure severity in the initial month of monitoring (Fig. 6 A). The seizure frequencies from the continuous chronic monitoring were plotted along with data from another published study conducted with a 25% continuous monitoring time protocol (1 week of behavioral monitoring per month for 7 months) (Kadam and Dudek, 2007). Progression of the epilepsy, as detected with both studies, showed parallel trends (Fig. 6 C). The data indicate that the epilepsy that develops after a perinatally induced unilateral lesion is progressive in nature. This progression was manifest as both an increase over time in seizure severity (i.e., subsequent generation of convulsive seizures after a focal onset) and an increase in seizure rate as a function of time.
Figure 6.

Increase in seizure frequency and severity over time. A, Continuous video-EEG monitoring revealed an increase in seizure frequency and severity [Racine scale (Racine, 1972)] over time in HI rats implanted at 2 months and at ≥6 months. Bar graph shows a stacked column analysis for partial (grades 1–3) and generalized (grades 4 and 5) seizures over time for 10 HI-treated epileptic rats averaged over 11 months. B, Graphs of the data from A with a best-fit exponential growth curve (dotted line) and sigmoid curve (solid line). The sigmoid curve was a best fit for the data. C, Data from A with a sigmoid growth curve (solid line) shown here together with 7 months of data acquired from a separate group (Kadam and Dudek, 2007) of HI-treated epileptic rats (dashed line), which were behaviorally video monitored (i.e., no EEG recordings, so data were obtained non-invasively) for 1 week every month (i.e., 1 of 4 or 25% of the monitoring time, starting at 1 month of age, or 1 month before the recordings with radio-telemetry were initiated). The best-fit sigmoid curve (dashed line) for the behavioral data (triangles) is parallel to the sigmoid curve for the radio-telemetry data with lower mean values of seizure frequency.
Seizure duration and severity
Seizure durations ranged from 10 to 240 s for the 556 seizures detected in the 10 HI-treated epileptic rats (Fig. 7). The hypothesis tested was that seizure severity, as graded by the Racine scale (Racine, 1972), would be directly proportional to seizure duration. If the progressive nature of the seizure severity was indeed attributable to the secondary generalization of partial seizures, it would be reflected as longer seizure durations for the grade 4 and 5 seizures. Seizure durations were assessed as a function of time after the HI insult to study their relationship with the increasing seizure rates. Average seizure duration for grade 5 seizures (n = 483) was 95.3 ± 1.4 s (Fig. 3) and that for grade ≤5 seizures was 47 ± 3.5 s (n = 73). This association between seizure severity and duration is shown in the bar graph depicted in Figure 7 A. The seizure durations for grade 5 events ranged from 25 to 240 s and 10 to 120 s for the grade ≤5 seizures. Average durations for the partial seizures (grades 0–3) were 39.5 ± 3.6 s and thus lower than the grade ≤5 averages. Therefore, a significant correlation (r 2 = 0.44, p = 0.0001) was found between seizure severity and duration.
Figure 7.

Analysis of seizure durations by severity and as a function of time. A, Bar graph of mean seizure durations for increasing grades of seizure severity classified according to the Racine scale (Racine, 1972). B, Mean seizure duration (gray open squares) plotted as a function of time after HI insult shows that mean seizure duration in the first month of recording (2–7 month rats) was ∼60 s, progressively increased over the next 3 months, and then decreased to ∼80 s. The superimposed mean seizure frequencies (filled black circles) for those same times show that the gradual decline in the mean seizure duration after the sixth month coincided with the exponential growth phase of the sigmoid curve for seizure progression as a function of time. C, Mean behavioral seizure scores over time indicate a rapid progression in severity from partial to generalized seizures after the first month of monitoring.
To study temporal features of seizure severity as a function of time, mean seizure durations were calculated for each epileptic rat (n = 10) over 30 d time bins (seizures per month). Mean values for all of the animals were then assessed to compare seizure durations over the 10 months of data collection (i.e., 3–12 months after the HI treatment). The relationship of increasing seizure rates over time was compared with the corresponding mean seizure durations (Fig. 7 B). Seizure durations progressively increased from the third month after the HI insult up to the sixth month in parallel with the gradual increase in seizure frequencies. After the sixth month, average seizure durations declined with increasing seizure frequencies, which coincided with the exponential growth phase of the best-fit sigmoid curve. This decline reached a steady state at ∼9 months of age. Seizure severity, as measured by the Racine scale (Racine, 1972), was directly proportional to seizure duration in this model. Thus, during the period of secondary generalization of partial seizures, both seizure severity and the corresponding seizure durations increased over time. This indicated that both of these seizure properties worsened during the initial months of epileptogenesis (Fig. 7 C). In the subsequent months, seizure durations were relatively shorter but constant during the period of chronic convulsive seizures (i.e., age 7–12 months; compare period of 4–12 months in Fig. 7, B and C). This may represent the progressive establishment of stable seizure propagation pathways between the infarcted and contralateral hemispheres or multifocal onsets.
Seizure clusters
Most patients with epilepsy have seizures that occur with interseizure intervals that have a non-Poisson distribution, meaning that the seizures do not occur randomly (Tauboll et al., 1991). Recognition of such patterns requires detailed analysis of the temporal distribution of seizures. Chronic continuous electrographic monitoring of the epileptic rats revealed that seizure clustering was a distinct feature of the seizure semiology of the epilepsy in this animal model, and the clusters could readily be seen in plots of daily seizure frequency and expanded raster plots (Fig. 8). Clustering was a dominant feature seen both in the 2–7 month (Fig. 8 A, rat A2 from Table 1) and 6–11 month (Fig. 8 B, rat B1 from Table 1) groups of epileptic rats. Three of five rats from the 2–7 month group (i.e., 60%) had their first detected seizures present as clusters of partial or partial and secondarily generalized seizures. The initial increase in seizure frequency as a function of time resulted from a rapid decrease in intercluster intervals (until the sixth month of age), followed by a steady state (supplemental Fig. 2A, available at www.jneurosci.org as supplemental material). This trend was associated with an increase followed by stabilization in the number of clusters occurring per month, which fit a sigmoid curve (supplemental Fig. 2B, available at www.jneurosci.org as supplemental material). The half-maximal rise for this sigmoid curve also occurred at ∼6 months of age. The exponential growth phase of the increase in seizure frequency over time (Fig. 6) was a result of an exponential growth in the number of seizures within clusters as a function of time (supplemental Fig. 2C, available at www.jneurosci.org as supplemental material). To test for non-randomness of the intervals between seizures (n = 556), interseizure intervals were calculated in hours and plotted on a timescale that ranged from <1 h to a few weeks (Fig. 9). Even with the low initial seizure frequencies reported here (0.2 seizures per day), the epileptic rats in the 2–7 month group were found to have clusters of seizures within a 24 h period and then remained seizure free for as long as a couple of weeks or more (Fig. 9 A1,A2). The 6–11 month group of epileptic rats showed similar seizure occurrences (Fig. 9 B1,B2). One rat from each group showed clusters spread over 48-h durations with interseizure intervals of 24 h within a cluster. Therefore, they were excluded from the group analysis in Figure 9 and plotted individually in supplemental Figure 3 (available at www.jneurosci.org as supplemental material). The frequency histogram for the entire dataset (Fig. 9 C) also showed two Gaussian distributions [i.e., between 0.1 and 8 h and between 24 h (1 d) and 768 h (32 d) interseizure intervals]. The two distributions were separated by a trough dropping to baseline between the 8 h and 2 d interseizure intervals (i.e., very few seizures had an interseizure interval of 8–24 h in the entire set of 556 seizures recorded). The individual frequency histograms shown in Figure 9 B1 and supplemental Figure 3A (available at www.jneurosci.org as supplemental material) are for the same rats for which raster plots depicting clustered seizures are shown in Figure 8. Similar frequency histograms for the group data for both the 2–7 month and 6–11 month groups represent the consistent clustering feature of seizure occurrences for the entire dataset. Therefore, in parallel to the trends of seizure clustering over time shown in supplemental Figure 2 (available at www.jneurosci.org as supplemental material), the frequency histogram of interseizure intervals for the group data and the entire dataset showed an initial peak that represented the intracluster interseizure intervals (i.e., from several minutes to several hours), whereas the second peak represented intercluster intervals (i.e., from a few days to a few weeks) (Fig. 9). Interseizure intervals for seizures occurring within a cluster showed variable trends for the different epileptic animals in this study. The overall mean values across all epileptic animals did not show either an increasing or decreasing trend in the progression of interseizure intervals within a cluster (supplemental Fig. 4A, available at www.jneurosci.org as supplemental material). Closer inspection showed that this was attributable to individual rats eliciting opposite trends (supplemental Fig. 4B, available at www.jneurosci.org as supplemental material). Two rats (A2 and B1) (Table 1) had cluster onsets that were heralded by a flurry of seizures occurring in rapid succession followed by gradual waning of their frequency (Fig. 8 B2). Three rats (B2, B3, and B4) (Table 1) showed the opposite pattern, wherein the seizures had longer interseizure intervals initially that gradually decreased as the cluster progressed, with an abrupt termination. Most of the epileptic rats that were excluded from the above analysis (n = 5) were from the 2–7 month group (n = 4) that had lower individual seizure rates compared with the 6–11 month group (Table 1, compare group A with group B). The 2–7 month group showed clusters with less than four seizures per cluster; therefore, a definite trend for interseizure intervals could not be ascertained in this group. Finally, clustering of seizures in this model ranged from a minimum of 2 to a maximum of 22 seizures occurring in close proximity to one another (<24 h), distinctly separated from the next cluster by days or even weeks of seizure-free periods (refer to raster plots in Fig. 8). Therefore, the postlesion epilepsy for the model revealed a distinct non-random pattern.
Figure 8.

Plots of the seizure frequency over time showing seizure clusters. Continuous EEG monitoring recorded virtually every seizure, which revealed clusters of seizures within periods of 24–48 h, followed by seizure-free periods of several days to a few weeks. A1, Seizure clusters seen in a rat implanted at 2 months of age with an expansion of seizure distribution within one of these clusters spread over 36 h (A2). Of note in the raster plot is the clustering of seizures occurring within a 42 min period in the eighth hour of the plot with interseizure intervals of 5, 28, and 9 min. B1, Temporal distribution of seizures within a cluster seen in a rat implanted at 6 months of age (B2). Note the overall increased number of seizures within clusters in B1 compared with A1. Also of note in B2 is the occurrence of eight seizures within a period of 140 min occurring ∼12 h into the plot with interseizure intervals of 25, 26, 19, 4, 19, 29, and 18 min consecutively.
Figure 9.

Interseizure intervals plotted as a function of interval durations. A1, A2, Plots show two prominent peaks in the distribution of interseizure intervals, in which the shorter intervals were between seizures within clusters and the longer intervals were between clusters (i.e., last seizure in one cluster and first seizure in the next cluster) for an individual epileptic rat from the 2–7 month group (A1) and the group data for the 2–7 month group of rats (A2). B1, B2, Plots show two prominent peaks similar to above for a single epileptic rat from the 6–11 month group (B1) and for the group data from the 6–11 month group of rats (B2). C, Interseizure intervals plotted as a function of interval durations of pooled data from both the young and old group of epileptic rats [n = 8; data for rats excluded from the group analysis (n = 2) is depicted in supplemental Fig. 3, available at www.jneurosci.org as supplemental material] showing the trough between the peaks still between 8 and 24 h. Time bins (h) for frequency histograms: 0.1, 0.5, 1, 2, 4, 6, 8, 10, 12, 24, 96 (4 d), 192 (8 d), 384 (16 d), 768 (32 d), and 1536 (64 d); applies to A–C and supplemental Figure 3 (available at www.jneurosci.org as supplemental material).
Reflex seizures
Reflex epilepsy is a condition in which an external stimulus can provoke seizures. Reflex epilepsy may have seizures exclusively in response to the specific stimuli; alternatively, reflex seizures can coexist with spontaneously occurring seizures. Reflex seizures likely result from neuronal circuits that are hyperexcitable to specific afferent stimuli. Genetic and lesional mechanisms that facilitate the recruitment and synchronization of larger neuronal pools by incoming sensory volleys have been implicated in the process (Palmini et al., 2005). Two of the five HI-treated epileptic rats from the 2–7 month group were detected to have initial reflex seizures as their first convulsive seizures. These seizures occurred only during and immediately after being handled for a cage change. One of these rats later went on to have one spontaneous convulsive seizure followed by more reflex seizures, but the other one progressed to develop spontaneous seizures unrelated to handling with no additional reflex seizures. These reflex seizures did not occur with every cage change (alternate weekdays). It was not possible to determine whether the reflex seizures were attributable to a startle or tactile stimulus associated with handling by the animal care personnel. Both clinically and experimentally, cortical malformations are thought to be epileptogenic (Chevassus-au-Louis et al., 1999; Porter et al., 2003). Previous studies in this model show that the ipsilateral somatosensory cortex displays acquired malformations (Kadam and Dudek, 2007), which may be the source of seizure initiation in response to the sensory volley generated by handling.
Discussion
Five key results were obtained in these studies. First, 56% of the HI-treated animals developed spontaneous recurrent seizures, whereas the remaining 44% of the HI-treated rats had no detectable epileptiform discharges or seizures (similar to controls). All of the animals with spontaneous recurrent seizures had a clearly identifiable infarct, whereas all of the animals without seizures had no infarct and no obvious microscopic damage. Thus, the presence of spontaneous recurrent seizures was clearly associated with the infarct and associated neuronal death. Second, all of the animals that developed spontaneous recurrent seizures also had spontaneously occurring EEG spikes between the seizures, whereas those animals without spontaneous seizures had no spikes. Third, although the frequency of spontaneous recurrent seizures was approximately an order of magnitude lower than rats that develop epilepsy after chemoconvulsant-induced status epilepticus [e.g., pilocarpine (Goffin et al., 2007) or kainic acid (Hellier et al., 1998; Williams et al., 2009)], the frequency of spontaneous electrographic and motor seizures increased over time, and this result was seen not only in group data but in every epileptic animal. The group data could be fit by an exponential curve (Fig. 10 A) that projected back to postnatal day 7 (Fig. 10 B), suggesting again that the progressive development of seizures is a continuous function of time, in which the latent period is essentially the first of many long interseizure intervals (Williams et al., 2009). Fourth, most of the seizures occurred as part of a distinct cluster of two or more seizures. The increase in seizure frequency was associated with increased clustering, thus suggesting that the clustering of seizures plays a role in epileptogenesis, although it is not clear whether this is a direct cause–effect relationship or simply a correlation. Fifth, the infarct-dependent epilepsy in this model progressed over time in both cortical distribution of the seizures and in seizure frequency. Therefore, although these studies used a long-standing model of perinatal stroke that is known to be variable in terms of the presence of focal injury (Kadam and Dudek, 2007), the variability proved useful as a basis for defining lesion-induced epilepsy (i.e., acquired) in a model of perinatal brain injury.
Figure 10.

Predictions of seizure progression from seizure-frequency data after continuous radio-telemetry recording. A, Modeling of seizure progression over an extended period of time by using parameters obtained from the equation of the best-fit sigmoid curve predicted a half-maximal seizure rate of ∼111.5 seizures per month at the age of 18 months for HI-treated epileptic rats in this study (A, dashed lines). The estimated maximal seizure rate was ∼223 seizures per month. B, Magnified view of predictive curve for the initial months after the HI insult for time periods highlighted in A in gray.
Spontaneous recurrent seizures after brain insult in the immature animal: requirement of neuronal death?
It has been questioned whether epilepsy after an insult to the immature brain (i.e., acquired epilepsy) requires actual neuronal death. Research on animal models of pediatric epilepsy based on prolonged hyperthermic seizures (Dubé et al., 2006), exposure to hypoxia (Jensen et al., 1992), and status epilepticus at postnatal day 20 (Raol et al., 2003) has suggested that epilepsy can occur without detectable neuronal death. It is not clear in much of the animal data on immature animals (i.e., hyperthermic seizures and hypoxia) whether the animals actually develop spontaneous recurrent seizures or that no neuronal loss occurred (Sankar et al., 2002). The continuous EEG monitoring in the present study not only demonstrated the presence of spontaneous recurrent seizures (i.e., acquired epilepsy) associated with ischemic lesions but also provided a relatively strong argument for the lack of epilepsy when an ischemic lesion was not present. Detection of a lack of seizures in an animal model is particularly difficult but was possible here because the recordings were prolonged and virtually continuous, so the possibility of false negatives based on missed seizures was relatively low. Therefore, these data strongly suggest that, at least for this model of perinatal stroke and post-stroke epilepsy, frank cerebral infarction with neuronal death is required for the development of spontaneous recurrent seizures (i.e., acquired epilepsy).
The potential importance of EEG spikes in acquired epilepsy
EEG or interictal spikes are generally seen as the primary marker of clinical epilepsy. Clinically, however, spikes and seizures have been described as distinct phenomena (Gotman, 1991). Recently, it has been hypothesized that the occurrence of EEG spikes before the first seizure contributes to the development and possible progression of acquired epilepsy (Staley and Dudek, 2006). In the present dataset, all of the epileptic animals had EEG spikes, and all of the animals without seizures or detectable neuronal death (i.e., an infarct) had no observable EEG spikes. These data emphasize that both seizures and neuronal death on the one hand, and the lack of seizures or neuronal death on the other hand could be detected or defined on the basis of nearly continuous recording, which in turn allowed the tentative conclusion of a close association of EEG spikes with the presence of neuronal death and spontaneous recurrent seizures. The potential for false-negative data in regard to lack of seizures or neuronal death was minimized, because the criterion for neuronal death was a frank infarct, and the continuous recording allowed seizure detection for many months. It remains possible (but seems unlikely) that neuronal damage and interictal spikes occurred in other brain sites in those animals of the present recordings without spontaneous recurrent seizures or EEG spikes. Thus, it is premature to conclude from this study that EEG spikes and/or infarct injury always predict epilepsy; however, the present data provide strong evidence, at least in this animal model, that an infarct after perinatal stroke is consistently associated with both EEG spikes and epilepsy.
Epilepsy after perinatal stroke is progressive: evidence for increased seizure frequency over time after HI injury
Antiepileptic drug treatment, patient reporting, and occurrence of epileptic seizures in sleep seriously compromise an analysis of progression of epilepsy in a clinical setting. In the present experiments, virtually continuous monitoring of spontaneous seizures provided evidence that the epilepsy was progressive. First, the earliest seizures were nonconvulsive and initiated ipsilateral to the injury, whereas subsequent seizures were convulsive but appeared to be secondary generalized, and later seizures often appeared to have bilateral onset. Second, this progressive change from non convulsive seizures with focal onset to convulsive seizures with bilateral onset was associated with an increase in seizure duration. Third, every epileptic animal showed an increase in seizure frequency over time. Finally, the increased seizure frequency was strongly associated with more robust clustering of the seizures (see below). Thus, the epilepsy after perinatal HI became progressively worse over time, and the worsening involved changes in seizure semiology, duration, frequency, and clustering. These results probably would not have been detected without continuous or nearly continuous electrographic monitoring; less monitoring might have led to a false-negative conclusion in regard to progression.
Seizure clusters
That seizures can occur in clusters has long been known, but the definition of clusters has remained somewhat arbitrary, if not anecdotal. In humans, Haut and coworkers (Haut et al., 2005a; Haut, 2006) defined a seizure cluster as more than three seizures per day and emphasized that clustering is often associated with intractability (Haut et al., 2005b). The key evidence for clustering after perinatal HI was the two-peaked distribution of the number of interseizure intervals as a function of the log of the duration of the interseizure intervals (Fig. 9). After perinatal HI, seizure clusters were found in every animal, and virtually all of the seizures (>90%) occurred in clusters (if clusters were defined as two seizures in a day). Seizures that occur in robust clusters may cause additional neuronal death (Tasch et al., 1999; Fuerst et al., 2001), and thus the exponential increase in seizure frequency may derive from the occurrence of robust seizure clusters. Finally, seizure clusters may be more widespread than previously appreciated, because the prominence of clusters in this study would not have been so apparent without continuous electrographic monitoring.
Conclusions
These studies provide one of the first examples of clear postlesion epilepsy after a perinatal brain injury and potentially address three issues. (1) Whether acquired epilepsy can occur without neuronal death or neuronal loss continues to be debated; our data indicate that only those animals with frank neuronal death (i.e., a clear infarct) developed acquired epilepsy. (2) Whether the presence and/or frequency of EEG spikes predicts the presence or severity of chronic epilepsy has been questioned on several fronts; our studies indicate that the presence of interictal spikes is so closely associated with epilepsy that they may be predictive of the ultimate development of acquired epilepsy (White et al., 2009). (3) Epilepsy is often viewed as a step function of time; although our study did not allow measurement of the latent period, the data argue against a step-function progression of epileptogenesis and instead support the hypothesis of a continuous process (Williams et al., 2009). The presence of a continuous epileptogenic process would be masked by the irregularity associated with seizure clusters, and this masking was overcome in the present study with continuous monitoring. In conclusion, the use of continuous video-EEG monitoring has provided evidence for (1) a relationship between neuronal loss (i.e., neuronal death) and the presence of acquired epilepsy, (2) an association between EEG spikes and epilepsy, (3) the progressive nature of epileptogenesis after perinatal stroke, and (4) the presence of seizure clusters and their potential role in epileptogenesis. These observations are potentially important for understanding the mechanisms of epileptogenesis, because ultimately epileptogenesis is manifest in the properties of spontaneous EEG spikes and seizures.
Footnotes
This work was supported by the American Heart Association (S.D.K.) and National Institutes of Health Grants NS16683 and NS45144 (F.E.D.). We thank Dr. Robert L. Macdonald for his comments on the analysis of seizure clusters.
References
- Aneja S, Ahuja B, Taluja V, Bhatia VK. Epilepsy in children with cerebral palsy. Indian J Pediatr. 2001;68:111–115. doi: 10.1007/BF02722024. [DOI] [PubMed] [Google Scholar]
- Badawi N, Felix JF, Kurinczuk JJ, Dixon G, Watson L, Keogh JM, Valentine J, Stanley FJ. Cerebral palsy following term newborn encephalopathy: a population-based study. Dev Med Child Neurol. 2005;47:293–298. doi: 10.1017/s0012162205000575. [DOI] [PubMed] [Google Scholar]
- Ben-Ari Y. Limbic seizure and brain damage produced by kainic acid: mechanisms and relevance to human temporal lobe epilepsy. Neuroscience. 1985;14:375–403. doi: 10.1016/0306-4522(85)90299-4. [DOI] [PubMed] [Google Scholar]
- Bergamasco B, Benna P, Ferrero P, Gavinelli R. Neonatal hypoxia and epileptic risk: a clinical prospective study. Epilepsia. 1984;25:131–136. doi: 10.1111/j.1528-1157.1984.tb04168.x. [DOI] [PubMed] [Google Scholar]
- Bertram EH, Cornett J. The ontogeny of seizures in a rat model of limbic epilepsy: evidence for a kindling process in the development of chronic spontaneous seizures. Brain Res. 1993;625:295–300. doi: 10.1016/0006-8993(93)91071-y. [DOI] [PubMed] [Google Scholar]
- Bertram EH, Cornett JF. The evolution of a rat model of chronic spontaneous limbic seizures. Brain Res. 1994;661:157–162. doi: 10.1016/0006-8993(94)91192-4. [DOI] [PubMed] [Google Scholar]
- Brenner RP, Schaul N. Periodic EEG patterns: classification, clinical correlation, and pathophysiology. J Clin Neurophysiol. 1990;7:249–267. [PubMed] [Google Scholar]
- Chevassus-au-Louis N, Baraban SC, Gaïarsa JL, Ben-Ari Y. Cortical malformations and epilepsy: new insights from animal models. Epilepsia. 1999;40:811–821. doi: 10.1111/j.1528-1157.1999.tb00786.x. [DOI] [PubMed] [Google Scholar]
- Dubé C, Richichi C, Bender RA, Chung G, Litt B, Baram TZ. Temporal lobe epilepsy after experimental prolonged febrile seizures: prospective analysis. Brain. 2006;129:911–922. doi: 10.1093/brain/awl018. [DOI] [PMC free article] [PubMed] [Google Scholar]
- Engel J., Jr . New York: Raven; 1993. Surgical treatment of the epilepsies; pp. 161–171. [Google Scholar]
- Engel J., Jr Clinical evidence for the progressive nature of epilepsy. Epilepsy Res Suppl. 1996;12:9–20. [PubMed] [Google Scholar]
- Finer NN, Robertson CM, Richards RT, Pinnell LE, Peters KL. Hypoxic-ischemic encephalopathy in term neonates: perinatal factors and outcome. J Pediatr. 1981;98:112–117. doi: 10.1016/s0022-3476(81)80555-0. [DOI] [PubMed] [Google Scholar]
- Fuerst D, Shah J, Kupsky WJ, Johnson R, Shah A, Hayman-Abello B, Ergh T, Poore Q, Canady A, Watson C. Volumetric MRI, pathological, and neuropsychological progression in hippocampal sclerosis. Neurology. 2001;57:184–188. doi: 10.1212/wnl.57.2.184. [DOI] [PubMed] [Google Scholar]
- Goffin K, Nissinen J, Van Laere K, Pitkänen A. Cyclicity of spontaneous recurrent seizures in pilocarpine model of temporal lobe epilepsy in rat. Exp Neurol. 2007;205:501–505. doi: 10.1016/j.expneurol.2007.03.008. [DOI] [PubMed] [Google Scholar]
- Gotman J, Marciani MG. Electroencephalographic spiking activity, drug levels, and seizure occurrence in epileptic patients. Ann Neurol. 1985;17:597–603. doi: 10.1002/ana.410170612. [DOI] [PubMed] [Google Scholar]
- Gotman J. Automatic recognition of interictal spikes. Electroencephalogr Clin Neurophysiol Suppl. 1985;37:93–114. [PubMed] [Google Scholar]
- Gotman J. Relationships between interictal spiking and seizures: human and experimental evidence. Can J Neurol Sci. 1991;18:573–576. doi: 10.1017/s031716710003273x. [DOI] [PubMed] [Google Scholar]
- Gower W. New York: Wood and Co; 1885. Epilepsy and other chronic convulsive diseases: their causes, symptoms and treatment. [Google Scholar]
- Hadjipanayis A, Hadjichristodoulou C, Youroukos S. Epilepsy in patients with cerebral palsy. Dev Med Child Neurol. 1997;39:659–663. doi: 10.1111/j.1469-8749.1997.tb07359.x. [DOI] [PubMed] [Google Scholar]
- Haut SR. Seizure clustering. Epilepsy Behav. 2006;8:50–55. doi: 10.1016/j.yebeh.2005.08.018. [DOI] [PubMed] [Google Scholar]
- Haut SR, Lipton RB, LeValley AJ, Hall CB, Shinnar S. Identifying seizure clusters in patients with epilepsy. Neurology. 2005a;65:1313–1315. doi: 10.1212/01.wnl.0000180685.84547.7f. [DOI] [PMC free article] [PubMed] [Google Scholar]
- Haut SR, Shinnar S, Moshé SL. Seizure clustering: risks and outcomes. Epilepsia. 2005b;46:146–149. doi: 10.1111/j.0013-9580.2005.29004.x. [DOI] [PubMed] [Google Scholar]
- Hellier JL, Patrylo PR, Buckmaster PS, Dudek FE. Recurrent spontaneous motor seizures after repeated low-dose systemic treatment with kainate: assessment of a rat model of temporal lobe epilepsy. Epilepsy Res. 1998;31:73–84. doi: 10.1016/s0920-1211(98)00017-5. [DOI] [PubMed] [Google Scholar]
- Hufnagel A, Dümpelmann M, Zentner J, Schijns O, Elger CE. Clinical relevance of quantified intracranial interictal spike activity in presurgical evaluation of epilepsy. Epilepsia. 2000;41:467–478. doi: 10.1111/j.1528-1157.2000.tb00191.x. [DOI] [PubMed] [Google Scholar]
- Jacobs KM, Graber KD, Kharazia VN, Parada I, Prince DA. Postlesional epilepsy: the ultimate brain plasticity. Epilepsia. 2000;41(Suppl 6):S153–S161. doi: 10.1111/j.1528-1157.2000.tb01574.x. [DOI] [PubMed] [Google Scholar]
- Jensen FE. Acute and chronic effects of seizures in the developing brain: experimental models. Epilepsia. 1999;40(Suppl 1):S51–S58. doi: 10.1111/j.1528-1157.1999.tb00879.x. [DOI] [PubMed] [Google Scholar]
- Jensen FE, Holmes GL, Lombroso CT, Blume HK, Firkusny IR. Age-dependent changes in long-term seizure susceptibility and behavior after hypoxia in rats. Epilepsia. 1992;33:971–980. doi: 10.1111/j.1528-1157.1992.tb01746.x. [DOI] [PubMed] [Google Scholar]
- Kadam SD, Dudek FE. Neuropathogical features of a rat model for perinatal hypoxic-ischemic encephalopathy with associated epilepsy. J Comp Neurol. 2007;505:716–737. doi: 10.1002/cne.21533. [DOI] [PMC free article] [PubMed] [Google Scholar]
- Kelly KM. Poststroke seizures and epilepsy:clinical studies and animal models. Epilepsy Curr. 2002;2:173–177. doi: 10.1046/j.1535-7597.2002.00064.x. [DOI] [PMC free article] [PubMed] [Google Scholar]
- Kułak W, Sobaniec W. Risk factors and prognosis of epilepsy in children with cerebral palsy in north-eastern Poland. Brain Dev. 2003;25:499–506. doi: 10.1016/s0387-7604(03)00040-8. [DOI] [PubMed] [Google Scholar]
- Levine S. Anoxic-ischemic encephalopathy in rats. Am J Pathol. 1960;36:1–17. [PMC free article] [PubMed] [Google Scholar]
- Marín-Padilla M. Neuropathologic correlates of perinatal asphyxia. Int Pediatrics. 2000a;15:221–228. [Google Scholar]
- Marín-Padilla M. Perinatal brain damage, cortical reorganization (acquired cortical dysplasias), and epilepsy. Adv Neurol. 2000b;84:153–172. [PubMed] [Google Scholar]
- Nelson KB. Causative factors in cerebral palsy. Clin Obstet Gynecol. 2008;51:749–762. doi: 10.1097/GRF.0b013e318187087c. [DOI] [PubMed] [Google Scholar]
- Nissinen J, Halonen T, Koivisto E, Pitkänen A. A new model of chronic temporal lobe epilepsy induced by electrical stimulation of the amygdala in rat. Epilepsy Res. 2000;38:177–205. doi: 10.1016/s0920-1211(99)00088-1. [DOI] [PubMed] [Google Scholar]
- Palmini A, Halasz P, Scheffer IE, Takahashi Y, Jimenez AP, Dubeau F, Andermann F, Paglioli-Neto E, da Costa JC, Rosenow F, Fritsch B. Reflex seizures in patients with malformations of cortical development and refractory epilepsy. Epilepsia. 2005;46:1224–1234. doi: 10.1111/j.1528-1167.2005.52904.x. [DOI] [PubMed] [Google Scholar]
- Paxinos G, Watson C. New York: Academic; 1998. The rat brain in stereotaxic coordinates. [DOI] [PubMed] [Google Scholar]
- Porter BE, Judkins AR, Clancy RR, Duhaime A, Dlugos DJ, Golden JA. Dysplasia: a common finding in intractable pediatric temporal lobe epilepsy. Neurology. 2003;61:365–368. doi: 10.1212/01.wnl.0000076487.28227.6e. [DOI] [PubMed] [Google Scholar]
- Racine RJ. Modification of seizure activity by electrical stimulation. II. Motor seizure. Electroencephalogr Clin Neurophysiol. 1972;32:281–294. doi: 10.1016/0013-4694(72)90177-0. [DOI] [PubMed] [Google Scholar]
- Raol YS, Budreck EC, Brooks-Kayal AR. Epilepsy after early-life seizures can be independent of hippocampal injury. Ann Neurol. 2003;53:503–511. doi: 10.1002/ana.10490. [DOI] [PubMed] [Google Scholar]
- Rice JE, 3rd, Vannucci RC, Brierley JB. The influence of immaturity on hypoxic-ischemic brain damage in the rat. Ann Neurol. 1981;9:131–141. doi: 10.1002/ana.410090206. [DOI] [PubMed] [Google Scholar]
- Sankar R, Shin D, Liu H, Wasterlain C, Mazarati A. Epileptogenesis during development: injury, circuit recruitment, and plasticity. Epilepsia. 2002;43:47–53. doi: 10.1046/j.1528-1157.43.s.5.11.x. [DOI] [PubMed] [Google Scholar]
- Sarnat HB, Sarnat MS. Neonatal encephalopathy following fetal distress. A clinical and electroencephalographic study. Arch Neurol. 1976;33:696–705. doi: 10.1001/archneur.1976.00500100030012. [DOI] [PubMed] [Google Scholar]
- Staley KJ, Dudek FE. Interictal spikes and epileptogenesis. Epilepsy Curr. 2006;6:199–202. doi: 10.1111/j.1535-7511.2006.00145.x. [DOI] [PMC free article] [PubMed] [Google Scholar]
- Tasch E, Cendes F, Li LM, Dubeau F, Andermann F, Arnold DL. Neuroimaging evidence of progressive neuronal loss and dysfunction in temporal lobe epilepsy. Ann Neurol. 1999;45:568–576. doi: 10.1002/1531-8249(199905)45:5<568::aid-ana4>3.0.co;2-p. [DOI] [PubMed] [Google Scholar]
- Taubøll E, Lundervold A, Gjerstad L. Temporal distribution of seizures in epilepsy. Epilepsy Res. 1991;8:153–165. doi: 10.1016/0920-1211(91)90084-s. [DOI] [PubMed] [Google Scholar]
- Volpe JJ. Neurology of the newborn. Major Probl Clin Pediatr. 1981;22:1–648. [PubMed] [Google Scholar]
- White A, Williams PA, Hellier J, Clark S, Dudek FE, Staley KJ. EEG spike activity precedes epilepsy after kainate-induce status epilepticus. Epilepsia. 2010 doi: 10.1111/j.1528-1167.2009.02339.x. Advance online publication. Retrieved December 29, 2009. doi: 10.1111/j.1528- 1167.2009.02339.x. [DOI] [PMC free article] [PubMed] [Google Scholar]
- White AM, Williams PA, Ferraro DJ, Clark S, Kadam SD, Dudek FE, Staley KJ. Efficient unsupervised algorithms for the detection of seizures in continuous EEG recordings from rats after brain injury. J Neurosci Methods. 2006;152:255–266. doi: 10.1016/j.jneumeth.2005.09.014. [DOI] [PubMed] [Google Scholar]
- Williams P, White A, Ferraro D, Clark S, Staley K, Dudek FE. The use of radiotelemetry to evaluate electrographic seizures in rats with kainate-induced epilepsy. J Neurosci Methods. 2006;155:39–48. doi: 10.1016/j.jneumeth.2005.12.035. [DOI] [PubMed] [Google Scholar]
- Williams PA, Dudek FE. A chronic histopathological and electrophysiological analysis of a rodent hypoxic-ischemic brain injury model and its use as a model of epilepsy. Neuroscience. 2007;149:943–961. doi: 10.1016/j.neuroscience.2007.07.067. [DOI] [PMC free article] [PubMed] [Google Scholar]
- Williams PA, Dou P, Dudek FE. Epilepsy and synaptic reorganization in a perinatal rat model of hypoxia-ischemia. Epilepsia. 2004;45:1210–1218. doi: 10.1111/j.0013-9580.2004.60403.x. [DOI] [PubMed] [Google Scholar]
- Williams PA, White AM, Clark S, Ferraro DJ, Swiercz W, Staley KJ, Dudek FE. Development of spontaneous recurrent seizures after kainate-induced status epilepticus. J Neurosci. 2009;29:2103–2112. doi: 10.1523/JNEUROSCI.0980-08.2009. [DOI] [PMC free article] [PubMed] [Google Scholar]
- Wu YW, Lindan CE, Henning LH, Yoshida CK, Fullerton HJ, Ferriero DM, Barkovich AJ, Croen LA. Neuroimaging abnormalities in infants with congenital hemiparesis. Pediatr Neurol. 2006;35:191–196. doi: 10.1016/j.pediatrneurol.2006.03.002. [DOI] [PubMed] [Google Scholar]