Abstract
[FeIV(O)(TMG3tren)]2+ (1; TMG3tren = 1,1,1-tris{2-[N2-(1,1,3,3-tetramethylguanidino)]ethyl}amine) is a unique example of an isolable synthetic S = 2 oxoiron(IV) complex, which serves as a model for the high-valent oxoiron(IV) intermediates observed in nonheme iron enzymes. Congruent with DFT calculations predicting a more reactive S = 2 oxoiron(IV) center, 1 has a lifetime significantly shorter than related S = 1 oxoiron(IV) complexes. Self-decay of 1 exhibits strictly first-order kinetic behavior and is unaffected by solvent deuteration, suggesting an intramolecular process. This hypothesis was supported by ESI-MS analysis of the iron products and a significant retardation of self-decay upon use of a perdeuteromethyl TMG3tren isotopomer, d36-1 (KIE = 24 at 25°C). The greatly enhanced thermal stability of d36-1 allowed growth of diffraction quality crystals for which a high-resolution crystal structure was obtained. This structure showed an Fe=O unit (r = 1.661(2) Å) in the intended trigonal bipyramidal geometry enforced by the sterically bulky tetramethylguanidinyl donors of the tetradentate tripodal TMG3tren ligand. The close proximity of the methyl substituents to the oxoiron unit yielded three symmetrically oriented short C-D···O non-bonded contacts (2.38 – 2.49 Å), an arrangement that facilitated self-decay by rate-determining intramolecular hydrogen atom abstraction and subsequent formation of a ligand-hydroxylated iron(III) product. EPR and Mössbauer quantification of the various iron products, referenced against those obtained from reaction of 1 with 1,4-cyclohexadiene, allowed formulation of a detailed mechanism for the self-decay process. The solution of this first crystal structure of a high-spin (S = 2) oxoiron(IV) center represents a fundamental step on the path towards a full understanding of these pivotal biological intermediates.
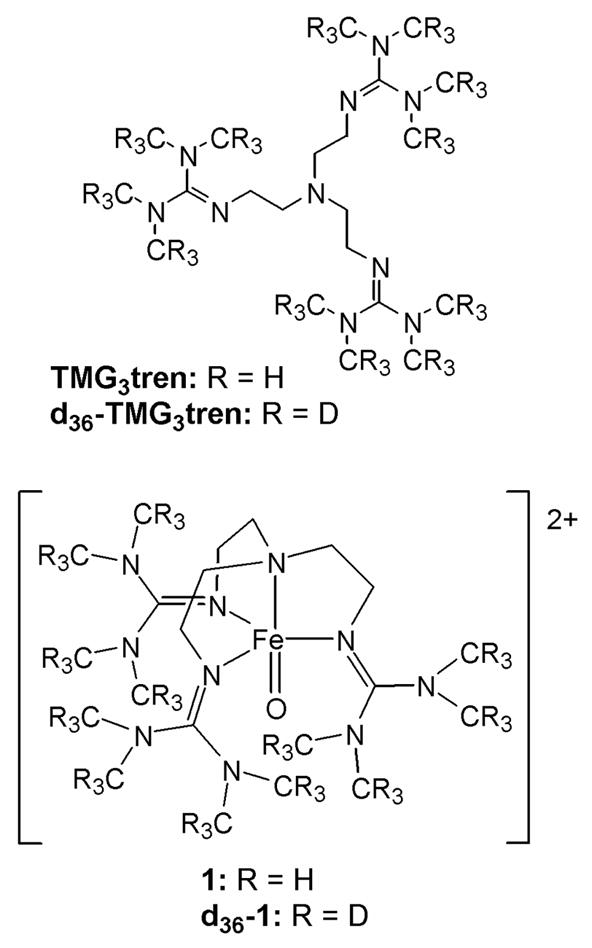
The mononuclear non-heme iron monooxygenase super-family of enzymes catalyzes a wide variety of biologically important oxidative transformations.1,2 High-valent oxoiron species are regularly invoked as the active oxidants in these systems and have to date been trapped and spectroscopically characterized in five enzymes.3–7 In all instances they were found to contain a high-spin (S = 2) iron(IV) center. Although there is now a virtual plethora of oxoiron(IV) model complexes, the overwhelming majority of these exhibit the intermediate S = 1 spin state, supported by a pseudo-octahedral ligand array.8 In fact, [FeIV(O)(H2O)5]2+ was the only existing example of an S = 2 oxoiron(IV) complex9,10 until our recent report of the high-yield generation and characterization of [FeIV(O)(TMG3tren)]2+ (1, Chart 1).11 The paucity of S = 2 systems is perhaps unsurprising considering that DFT studies predict the high-spin manifold to be significantly more reactive in H-atom abstraction reactions than the S = 1 spin-state.12–15
Chart 1.
Complexes 1 and [FeIV(O)(H2O)5]2+ embody possibly the two most easily envisaged routes for accessing the S = 2 spin state. Within a simple crystal field representation of an octahedral geometry, the spin-state of the oxoiron(IV) complex is dictated by the energetic separation of the dxy and dx2-y2 orbitals.13,16 When the ligand field exerted by the equatorial ligands is larger than the spin-pairing energy, an S = 1 spin-state is obtained. However, when the ligand field is weak, as is the case for [FeIV(O)(H2O)5]2+, the S = 2 spin-state is observed. An alternative strategy is to adopt a trigonal bipyramidal (TBP) geometry at the oxoiron(IV) center, in which case the dxy and dx2-y2 orbitals become degenerate and the high-spin state is favored. This approach was illustrated by generation of 1, from reaction of [FeII(TMG3tren)(CH3CN)](OTf)2 (2) with 2-(tert-butylsulfonyl)iodosylbenzene (2-(tBuSO2)C6H4IO)17 in which the sterically encumbered tripodal tetradentate ligand TMG3tren was used to enforce the desired TBP geometry.11 Crucially, 1 was found to be highly soluble in a range of organic solvents, thereby allowing generation and stabilization at low temperatures. In contrast [FeIV(O)(H2O)5]2+ exhibits a half-life (t1/2) of 7 s at 25 °C and is generated in aqueous solution, thereby severely limiting scope for its stabilization by working at low temperatures (T < 0°C).9
It might be expected that an inevitable consequence of the sterically bulky nature of the TMG3tren ligand, key to formation of the desired TBP geometry in 1, is a suppression of reactivity with external substrates. Indeed, it was demonstrated that hydrogen atom abstraction reactions with sterically unencumbered substrates proceed more rapidly than reactions with bulkier analogues that have comparable bond dissociation enthalpies (BDE).11 These observations contrast with those for the S = 1 complexes [FeIV(O)(TMC)(CH3CN)]2+ (3), [FeIV(O)(N4Py)]2+ (4) and [FeIV(O)(Bn-tpen)]2+ (5), where the rates of reaction exhibit a linear dependence upon C-H BDE and do not appear to be significantly perturbed by steric considerations.18,19 (TMC = 1,4,8,11-tetramethyl-1,4,8,11-tetraazacyclotetradecane; N4Py = N,N-bis(2-pyridylmethyl)-N-bis(2-pyridyl)methylamine; and Bn-tpen = N-benzyl-N,N′,N′-tris(2-pyridylmethyl)-1,2-diaminoethane.) It may therefore seem somewhat surprising that 1 undergoes reaction with substrates at rates of comparable magnitude to the aforementioned S = 1 complexes, but has a half-life of only 30 s at 25°C, which is approximately 3 orders of magnitude shorter than those of 3, 4 or 5 (10, 60 and 6 hours, respectively).
In this article, the self-decay of 1 has been described in greater detail and its self-decay products characterized using ESI-MS, Mössbauer, EPR, and X-ray absorption spectroscopies. Self-decay was significantly retarded by use of its perdeuteromethyl congener [FeIV(O)(d36-TMG3tren)]2+ (d36-1) due to a large kinetic isotope effect. The increased stability of d36-1 allowed diffraction-quality crystals to be obtained, culminating in the first crystal structure of a high-spin oxoiron(IV) complex.
Experimental Section
Materials and General Procedures
All reagents were purchased from Aldrich and used as received, unless noted otherwise. Diethyl ether, n-pentane and tetrahydrofuran were dried by prolonged reflux, under a nitrogen atmosphere, over sodium metal with a benzophenone ketyl indicator and distilled freshly prior to use. Acetonitrile and dichloromethane were treated in a similar manner, but using calcium hydride as the drying agent. 2-(tert-butylsulfonyl)iodosylbenzene (2-(tBuSO2)C6H4IO),17 d36-TMG3tren,20 the salt Fe(OTf)2(CH3CN)2,21 and complex [FeIV(O)(TMG3tren)]2+ (1)11 were all prepared according to published procedures.
All moisture and oxygen sensitive compounds were prepared using a standard high vacuum line and Schlenk techniques. A nitrogen-filled glove box was used for any subsequent manipulation and storage of these compounds. 1H and 13C NMR spectra were recorded on a Varian Inova 500 MHz spectrometer at ambient temperature. Chemical shifts (ppm) were referenced to the residual protic solvent peaks. Elemental analyses for 2 were performed by Atlantic Microlab (Norcross, GA). UV-Visible studies were performed using a HP8453A diode array spectrometer equipped with a cryostat from Unisoku Scientific Instruments (Osaka, Japan). Electrospray ionization mass spectrometry experiments were carried out on a Bruker BioTOF II mass spectrometer using a spray chamber voltage of 4000 V and a gas carrier temperature of 70°C.
[FeII(d36-TMG3tren)(CH3CN)](OTf)2 (d36-2): A solution of d36-TMG3tren (0.51 g, 1.07 mmol) in THF (10 mL) was added to a Schlenk flask charged with Fe(OTf)2(CH3CN)2 (0.47 g, 1.07 mmol) and the resultant mixture stirred overnight. The precipitate obtained was isolated by filtration, washed with THF (3 × 5 mL) and diethyl ether (2 × 15 mL), and dried under vacuum to give a white colored powder (0.85 g, 91 %). 1H-NMR (CD3CN, all peaks appear as broad singlets): δ212.3 (3H, CH2), 86.5 (3H, CH2), 61.3 (3H, CH2), 1.8 (3H, CH2). MS (+ESI): m/z 681.6 [(M-OTf)+], 266.3 [{M-(OTf)2}2+]. Anal. Calcd. (found) for C25D36H15F6FeN11O6S2: C, 34.43 (34.34); H + D as H, 6.15 (5.96); N, 17.68 (17.45).
[FeIV(O)(d36-TMG3tren)]2+ (d36-1): Solutions of the orange-colored complex d36-1 were prepared in analogous fashion to 1, by reaction of a CH3CN solution of d36-2 with one equivalent of 2-(tBuSO2)C6H4IO,17 dissolved in CH2Cl2. Solutions of oxidant up to a concentration of 60 mM were routinely used.
Mossbauer, EPR and XAS Studies
Mössbauer and EPR samples were derived from solutions of 1 either by reaction with substrate at −30°C, or warming to room temperature in the case of self-decay. 1 was prepared at −30°C by treatment of 2 mM CH3CN solutions of complex 2 with 1 equiv of a CH2Cl2 solution of 2-(tBuSO2)C6H4IO. All reactions were monitored using UV-Vis and after both generation of 1 and its subsequent reaction aliquots were removed and frozen for spectral analysis.
Mössbauer spectra were recorded with two spectrometers, using Janis Research Super-Varitemp dewars that allowed studies in applied magnetic fields up to 8.0 T in the temperature range from 1.5 to 200 K. Mössbauer spectral simulations were performed using the WMOSS software package (SEE Co, Edina, MN). Isomer shifts are quoted relative to Fe metal at 298 K.
Perpendicular-mode X-band (9.63 GHz) EPR spectra were recorded on a Bruker EPP 300 spectrometer equipped with an Oxford ESR 910 liquid helium cryostat and an Oxford temperature controller. The microwave frequency was calibrated with a frequency counter and the magnetic field with a NMR gaussmeter. All signals were quantified relative to a Cu-EDTA spin standard. EPR simulations were carried out with a Windows software package (SpinCount) available from Professor Michael Hendrich of Carnegie Mellon University. All simulations are least-squares fits of the experimental spectra generated with consideration of all intensity factors, thereby allowing computation of simulated spectra for a specified sample concentration. The simulations therefore allow a quantitative determination of signal intensities for each complex.
X-ray absorption data were collected on beamline X3B at the National Synchrotron Light Source (NSLS) of Brookhaven National Laboratory (BNL) with the storage ring operating at 2.8 GeV and 100–300 mA. Fe K-edge XAS data were collected for a frozen solution of 1 after reaction with 1,4-CHD (shown to be 88% Fe(III) by Mössbauer analysis) in a tandem Mössbauer/XAS cup maintained at ca. 30 K over an energy range of 6.9 – 8.0 keV using a Si(111) double crystal monochromator for energy selection and a Displex closed cycle cryostat for temperature control. A bent focusing mirror was used for harmonic rejection. Data were obtained as fluorescence excitation spectra with a 13-element solid-state germanium detector array (Canberra). An iron foil spectrum was recorded concomitantly for internal energy calibration and the first inflection point of the Fe K-edge was assigned to 7112.0 eV. Data averaging and analysis were carried out with EXAFSPAK,22 as described in the Supporting Information.
Self-Decay Kinetics
Measurement of the kinetics of self-decay of 2 mM CH3CN solutions of 1 and d36-1 were performed at fixed temperature intervals, under an inert atmosphere, by monitoring loss of the associated NIR bands (at 825 and 865 nm). Fitting to the resultant decay curves yielded rate constants, ksd, that were found in all cases to be strictly first order in oxoiron(IV) complex. Measurement of ksd was performed at least three times at each temperature increment.
X-Ray crystal structure determination
A crystal (approximate dimensions 0.50× 0.35 × 0.15mm3) was placed onto the tip of a 0.1 mm diameter glass capillary and mounted on a CCD area detector diffractometer for a data collection at 123(2) K.23 A preliminary set of cell constants was calculated from reflections harvested from three sets of 20 frames. These initial sets of frames were oriented such that orthogonal wedges of reciprocal space were surveyed. This produced initial orientation matrices determined from 176 reflections. The data collection was carried out using MoKα radiation (graphite monochromator) with a frame time of 20 seconds and a detector distance of 4.8 cm. A randomly oriented region of reciprocal space was surveyed to the extent of one sphere and to a resolution of 0.80 Å. Four major sections of frames were collected with 0.30° steps in ω at four different φ settings and a detector position of −28° in 2θ. The intensity data were corrected for absorption and decay (SADABS).24 Final cell constants were calculated from 2761 strong reflections from the actual data collection after integration (SAINT).25 Please refer to Table 1 for additional crystal and refinement information. The structure was solved and refined using Bruker SHELXTL.26 The space group P21/c was determined based on systematic absences and intensity statistics. A direct-methods solution was calculated which provided most non-hydrogen atoms from the E-map. Full-matrix least squares/difference Fourier cycles were performed which located the remaining non-hydrogen atoms. All non-hydrogen atoms were refined with anisotropic displacement parameters. All hydrogen atoms were placed in ideal positions and refined as riding atoms with relative isotropic displacement parameters. The final full matrix least squares refinement converged to R1 = 0.0462 and wR2 = 0.1218 (F2, all data).
Table 1.
Crystal data and structure refinement for (d36-1) · 3CH2Cl2.
| empirical formula | C26H18Cl6D36F6FeN10O7S2 | |
| fw | 1101.68 | |
| T (K) | 123(2) | |
| Mo K α λ, Å | 0.71073 | |
| crystal system | monoclinic | |
| space group | P21/c | |
| unit cell dimensions | a = 17.844(5) Å | α = 90° |
| b = 12.072(4) Å | β = 103.645(4)° | |
| c = 21.601(6) Å | γ = 90° | |
| V (Å3) | 4522(2) | |
| Z | 4 | |
| r (calc), mg/m3 | 1.618 | |
| abs coeff (mm−1) | 0.857 | |
| crystal size | 0.50 × 0.35 × 0.15 mm3 | |
| goodness-of-fit on F2a | 1.055 | |
| final R indices [I > 2sigma(I)]b | R1 = 0.0462, wR2 = 0.1037 | |
| R indices (all data)b | R1 = 0.0777, wR2 = 0.1218 |
Results and Discussion
Self-decay of 1 exhibits first order kinetics in CH3CN solution that can be conveniently monitored by the loss of its weak near-IR features at 825 and 865 nm and the more intense ligand-to-metal charge transfer (LMCT) band at 400 nm (Figure 1, top). The decay product(s) exhibit a blue-shifted, less intense charge transfer band at 378 nm with no obvious near-IR features. The spectral changes accompanying decay do not proceed via fixed isosbestic points (Figure 1, top inset), suggesting either a multi-stage reaction and/or the production of more than one decay product. Additionally, the decay products themselves are unstable and undergo further decay, albeit at a much slower rate, that can be accelerated by the addition of water. In contrast to complexes 4 and 5, where measurement of their rates of self-decay in CH3CN and CD3CN yielded solvent kinetic isotope effects (KIEs) of 3 at 50°C and 4 at 40°C,18 respectively, the self-decay rate of 1 was not perturbed by solvent deuteration. This comparison would seem to suggest that self-decay of 4 and 5 involves rate-determining hydrogen atom abstraction from the solvent, whereas that of 1 proceeds by a different route.
Figure 1.
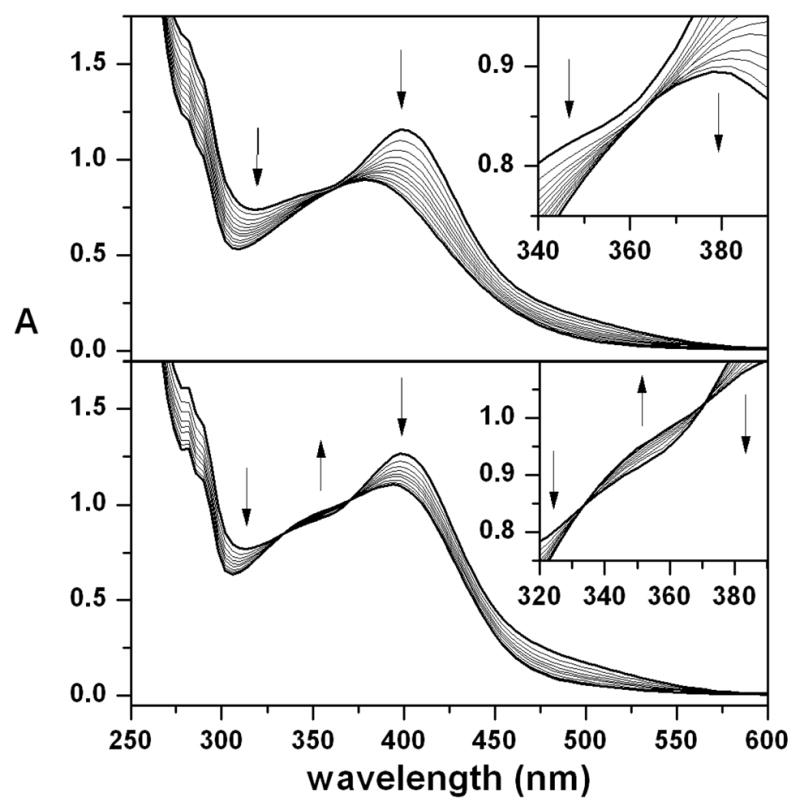
Top: UV-Vis changes accompanying self-decay of a 0.12 mM CH3CN solution of 1, at 25°C, which proceeds without isosbestic points (inset). Bottom: UV-Vis changes accompanying reaction of a 0.13 mM CH3CN solution of 1 with 16 mM 1,4-CHD, at −30°C, which exhibits isosbestic points at 333 and 371 nm (inset).
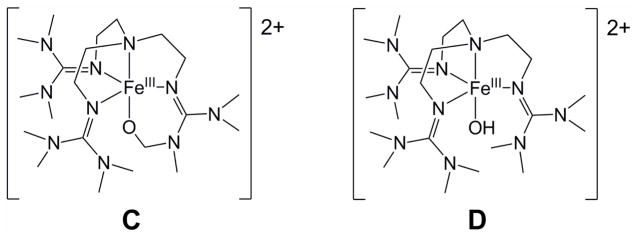
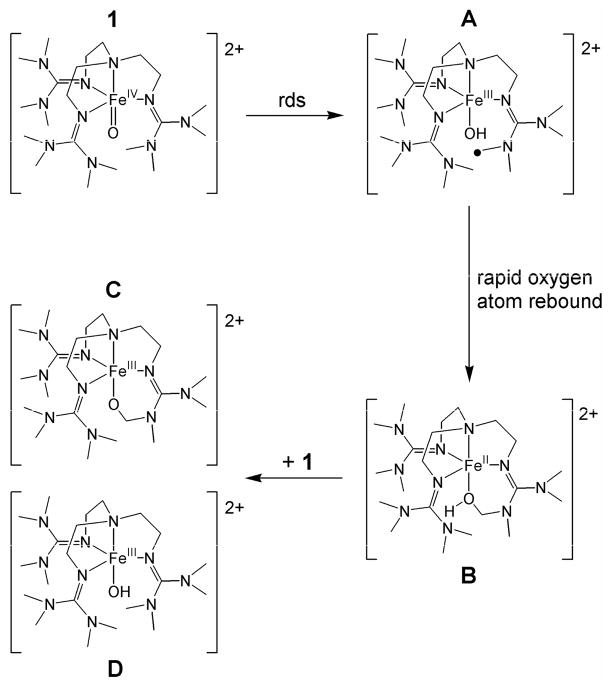
ESI-MS analysis of 1 was previously shown to give a spectrum that exhibited peaks at m/z = 661.3 and 256.2. Spectra of the self-decay products of 1 displayed intense peaks at m/z = 662.4, 660.4, 256.7 and 255.7 (Figure S1), suggesting the formation of species that are alternately one 1 H-atom heavier and 1 H-atom lighter than 1. Simulation of the observed isotope distribution patterns reaffirmed this proposition. The peaks at 660.4 and 255.7 are respectively formulated as {[FeIII(O)(L - H)](OTf)}+ and [FeIII(O)(L - H)]2+ and derive from the alkoxoiron(III) product resulting from self-hydroxylation of the ligand (C), while the peaks at 662.4 and 256.7, are respectively formulated as {[FeIII(OH)(L)](OTf)}+ and [FeIII(OH)(L)]2+ and assigned to a hydroxoiron(III) complex (D) (Chart 2). Furthermore, 18O-labelling of 1 caused the product-derived peaks to shift to m/z = 664.4, 662.4, 257.7 and 256.7, respectively, with isotopic distribution patterns consistent with a high percentage of 18O-incorporation into the products, regardless of whether self-decay was conducted under nitrogen or air. These results suggest that self-decay of 1 is, at least in part, a self-hydroxylation process involving hydrogen atom abstraction from the TMG3tren ligand, followed by a rapid oxygen rebound, which yields a ligand-hydroxylated product that upon loss of a proton and one-electron oxidation forms the corresponding alkoxoiron(III) complex C.
Chart 2.
This self-decay behavior should be contrasted with that seen in the reaction of 1 with excess 1,4-CHD. Again, the reaction exhibits first order kinetics that can be monitored via loss of the weak NIR features at 825 and 865 nm and the LMCT band at 400 nm associated with 1 (Figure 1, bottom). However, this transformation leads to generation of a charge transfer band at 392 nm, rather than 378 nm, and proceeds via isosbestic points at 333 and 371 nm (Figure 1, bottom inset). These observations are consistent with direct conversion to a single species, which can be assigned as the hydroxoiron(III) complex D, based on the observation of prominent ESI-MS ion fragments at m/z = 662.4 and 256.7. These features correspond respectively to the {[FeIII(OH)(L)](OTf)}+ and [FeIII(OH)(L)]2+ ions, which upshifted accordingly when 18O-labeled 1 was used as the precursor. Notably, the ion fragments associated with C ({[FeIII(O)(L - H)](OTf)}+ and [FeIII(O)(L - H)]2+) are absent from these ESI-MS spectra (Figure S2), emphasizing that C is uniquely associated with the self-decay of 1.
Mössbauer and EPR Studies
Complex 1 has been previously characterized by Mössbauer spectroscopy as having a high-spin (S = 2) iron(IV) center with δ = 0.09 mm s−1 and ΔEQ = −0.29 mm s−1 and was demonstrated to react with 1,4-CHD to yield 0.5 equivalent of benzene.11 Mössbauer and EPR spectroscopic analysis of samples generated by the self-decay of 1 and the reaction of 1 with 1,4-CHD revealed that high-spin iron(III) complexes accounted for ca. 85% of the Fe present. The spectra of these species were analyzed using the spin Hamiltonian  =
=  +
+  ,
,
 |
where all symbols have their conventional meanings.
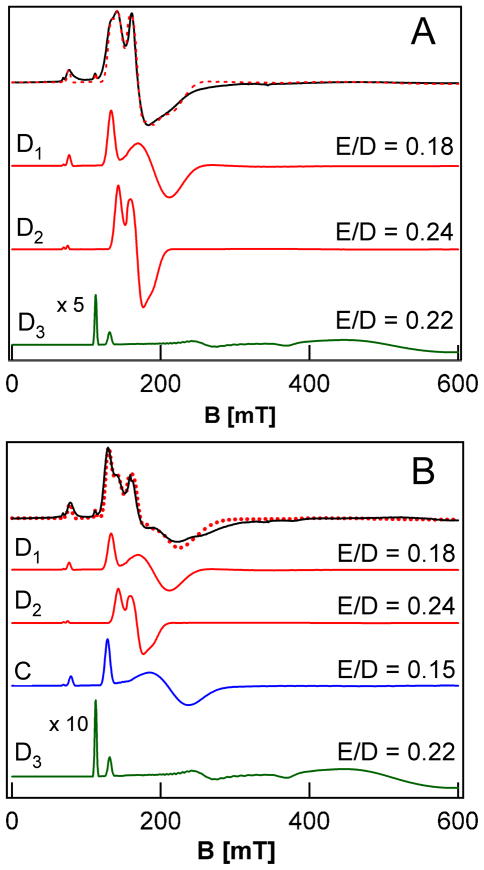
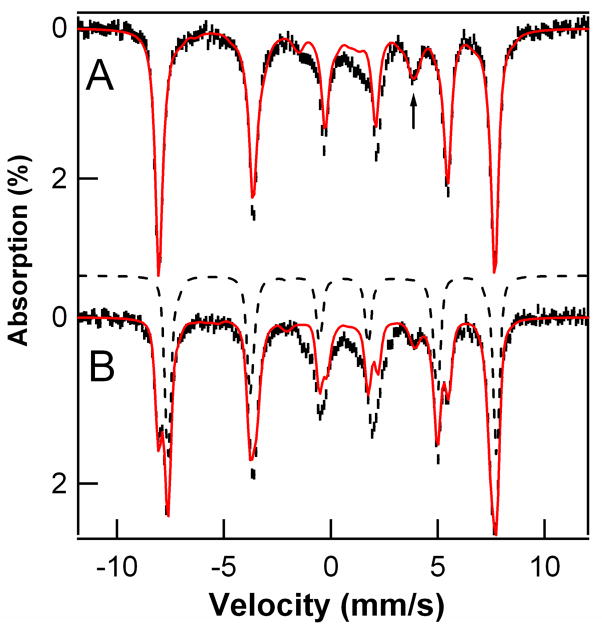
Figure 2A shows a perpendicular-mode X-band EPR spectrum of the putative hydroxoiron(III) product (D) obtained by reaction of 2 mM 1 with 1,4-CHD. It contains two well resolved high-spin FeIII components that have zero-field splitting (ZFS) parameters D < 0 that are nearly identical, but with differing E/D values of 0.18 for D1 (1.08 mM) and 0.24 for D2 (0.56 mM). The most intense features of these two high-spin species are associated with the middle Kramers doublets of their S = 5/2 multiplets, while the features around g = 9 originate from the ground and upper Kramers doublets. Our analysis is based on a series of spectra recorded between 2.2 K and 20 K. Except for the small difference in the rhombicity parameter E/D, the two species are quite similar, which suggests they are geometrically closely related species. This similarity is borne out by the 4.2 K Mössbauer spectrum of Figure 3A, which can be fit as essentially one species accounting for 86 % of the iron in the sample. These results emphasize the greater resolution of EPR in response to small differences in spin Hamiltonian parameters, provided the EPR signals are sharp enough. The feature marked by the arrow belongs to Mössbauer absorption associated with the middle Kramers doublets of the two species. Given that all parameters, except D, are fixed by the simulation of the ground state spectrum, the intensity of this feature can be used to determine the population of the middle doublet and thus the ZFS parameter, D ≈ −1.5 cm−1. To be consistent with the observation of D1 and D2 by EPR (Table 2), the Mössbauer spectrum was simulated with two species (Figure 3A, red line), using the relative intensities obtained from the EPR simulations. The remainder of the Mössbauer absorption in Figure 3A (14 % of Fe), which is poorly resolved and concentrated in the central region, cannot be assigned at this time.
Figure 2.
Perpendicular-mode X-band EPR spectra of the ferric reaction products of 1 with 1,4-CHD (A) and the products from self-decay of 1 (B). A: 8 K spectrum of the reaction products of 1 with 1,4-CHD (black solid line) together with a simulation (red dashed line) composed of the individual spectra of D1, D2, and D3 shown below the data. B: 8 K spectrum of the products from self-decay of 1 (black solid line). The simulation (red dashed line) contains the contributions (shown separately below) from D1, D2, D3, and C. For visual clarity, the signal intensity of D3 has been increased 5-fold and 10-fold, respectively, in panels A and B. Conditions: microwave frequency, 9.62 GHz, microwave power, 2 mW, modulation amplitude, 1 mT.
Figure 3.
Mössbauer spectra of the products from the reaction of 1 with 1,4-CHD (A) and that from self-decay of 1 (B). Spectra were recorded at 4.2 K in a 45 mT parallel applied magnetic field. Red solid lines are spectral simulations based on eqs 1, using the parameters listed in Table 2. The arrow in (A) highlights the high-energy line of the spectral feature associated with the middle Kramers doublet of the S = 5/2 spin manifold. Black dashed line in B is the simulation of the S = 5/2 species C.
Table 2.
EPR and Mössbauer parameters of observed FeIII complexes
| EPR | Mössbauer | |||||||||
|---|---|---|---|---|---|---|---|---|---|---|
| D (cm−1) | E/D | Conc (mM)a | %Fe b | δ(mm/s) | ΔEQ (mm/s) | η | A0/gnβn (T) | %Feb | ||
| 1 + CHD | D1 (S = 5/2) | −1.5 | 0.18 | 1.08 | 54 | 0.36 | −1.56 | 1.7 | −19.5 | 58 |
| D2 (S = 5/2) | −1.5 | 0.24 | 0.56 | 28 | 0.36 | −1.56 | 1.7 | −20.1 | 28 | |
| D3 (S = 3/2) | −6 | 0.22 | 0.16 | 8 | - | |||||
| Self- Decay of 1 | D1 (S = 5/2) | −1.5 | 0.18 | 0.47 | 23 | 0.36 | −1.56 | 1.7 | −19.7 | 38c |
| D2 (S = 5/2) | −1.5 | 0.24 | 0.20 | 10 | ||||||
| D3 (S = 3/2) | −6 | 0.22 | 0.10 | 5 | ||||||
| C (S = 5/2) | −2.3 | 0.15 | 1.00 | 50 | 0.34 | −2.00d | 1 | −18.8 | 48c | |
As a result of the complexity of the model used in the fitting procedure, the quoted EPR concentrations are estimated to be ± 10%.
Samples of 1 typically contained 90% FeIV =O species, with the remainder of the iron belonging to an unreactive byproduct, which was also found in samples derived from 1.
A second Mössbauer sample for characterizing the self-decay of 1 contained ca. 40% of the Fe belonging to D1 +D2 and 40% to C. The uncertainties in the Mössbauer quantifications are ca. ± 5%.
The z axis of the EFG tensor is tilted by β = 50° (towards the x axis )with respect to the z-axis of the ZFS tensor.
The two high-spin FeIII species, D1 and D2, do not account for all the features seen in the EPR spectrum of the product from the reaction of 1 with 1,4-CHD (Figure 2A). Subtraction of the spin intensity associated with D1 and D2 reveals a third spectral component (D3) that has a spin concentration of ca. 0.16 mM (9% of the total spin concentration), based on the simulation shown in Figure 2A. D3 can be assigned to an S = 3/2 system with D < 0 and E/D ≈0.22. D3 is most conspicuous at 2.2 K (Figure S3), at which temperature it exhibits a sharp resonance at g = 6.15 and a broad derivative feature around g ≈1.3. The Mössbauer spectrum associated with D3 has yet to be characterized due to its low concentration, but most likely contributes to the poorly resolved features found in the central region of the spectrum in Figure 3A. The origin of this highly unusual minor species and how it relates to the S = 5/2 components D1 and D2 is currently unknown and is the subject of ongoing investigation. Regardless of the specific identity of D3, or even D1 and D2 for that matter, the mixture of species denoted as D corresponds to the product of PCET reaction of 1.
The EPR properties of D can be compared to those of the handful of published examples of well characterized non-heme monoiron FeIII-OH complexes with the most directly relevant being the TBP series reported by Borovik and co-workers.27–29 The four FeIII-OH complexes of this series are supported by tetradentate tripodal ligands containing the various possible combinations of tert-butylureayl and isopropylcarbamoyl donors. These complexes exhibit similar EPR spectra with uniform D values of −1.3 cm−1, which are comparable to the axial zero-field splitting parameters of D1 and D2. Although only one E/D value was assigned for each complex, the EPR spectra of two members of this series exhibit features that must arise from two species with distinct E/D values. In particular, the crystallographically characterized FeIII-OH complex supported by the tris(N-isopropylcarbamoylmethyl)amine ligand, which like D contains no groups capable of H-bonding to the hydroxide ligand, gives rise to an EPR spectrum with two species having E/D values of ca. 0.17 and 0.24 that compare very favorably to those of D1 and D2 (0.18 and 0.24, respectively).29 The observation of multiple species in frozen solution for FeIII-OH complexes was facilitated in our study by the sharpness of the EPR features and can be rationalized by the possibility of multiple energetically limiting orientations of the O-H bond due to the bent Fe-O-H bond angle, coupled with the coordinative malleability of iron(III).
Figure 2B shows a perpendicular-mode 8 K EPR spectrum of the species obtained after self-decay of 2 mM 1. In addition to D1, D2 and D3, which were observed as products of the reaction of 1 with 1,4-CHD (Figure 2A) and accounts for about 40% of the total Fe in the sample, the self-decay sample contains a major new species, with E/D = 0.15, which represents about half the total Fe in the sample and is assigned as the alkoxoiron(III) species C seen by ESI-MS. This new species is readily recognized in the Mössbauer spectrum of Figure 3B (dashed curve). The solid red line in Figure 3B is a least-squares fit to two species, with 38% of Fe present belonging to D1 plus D2 and 48% to C (Table 2), in reasonable agreement with the relative concentrations of D1 plus D2 and C observed by EPR. The remaining iron (14% of total Fe), unaccounted for by C, D1, and D2, gives rise to the currently unassigned absorption in the central region of the Mössbauer spectrum, which is likely to include the 5% of D3 that is observed by EPR. The balance corresponds to an unreactive byproduct formed in the synthesis of 1, which persists in samples derived from 1. Thus, within the error limits of the EPR and Mössbauer quantification, the self-decay of 1 yields approximately equal amounts of alkoxoiron(III) (C, from ligand hydroxylation) and hydroxoiron(III) species (D, from PCET).
XAS Study of D
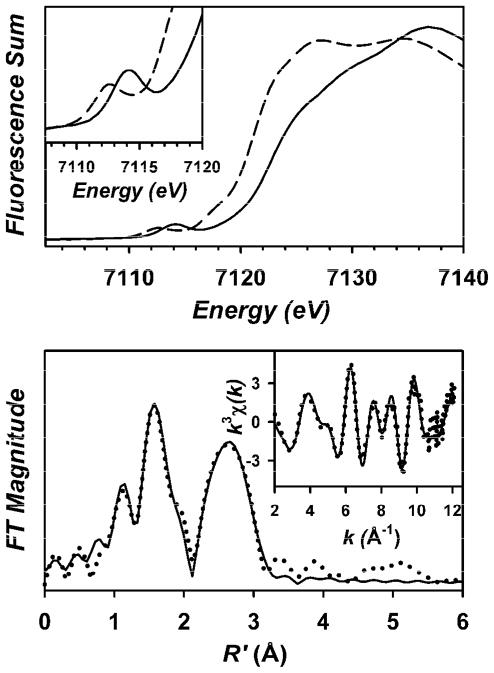
Attempts to grow crystals of the iron(III) complexes C and D suitable for X-ray analysis have thus far yielded only oils and amorphous films. X-ray absorption spectroscopy represents an alternative means to obtain structural insight into D, which can be generated in high-yield by reaction of 1 with 1,4-CHD. XANES analysis of D (Table S1) yields edge and pre-edge energies (Eedge = 7122.6 eV, Epre-edge = 7114.0 eV) that are blue-shifted by ca. +1.5 eV relative to those of the iron(II) starting complex 2 (Eedge = 7121.1 eV, Epre-edge = 7112.5 eV) (Figure 4, top), consistent with the ferric state established by EPR and Mössbauer spectroscopies. The pre-edge feature of D exhibits a single peak with an integrated area of 21 units, which is comparable to the values of 21 and 25 units reported for Borovik’s TBP oxoiron(III) complex [FeIII(H3buea)(O)]2− (6; H3buea = tris[(N′-tert-butylureaylato)-N-ethylene]aminato) and its hydroxoiron(III) analogue [FeIII(H3buea)(OH)]−, respectively.30
Figure 4.
Top: X-ray absorption edge spectra of 2 (– – –) and D (–––). The inset shows an expansion of the pre-edge region. Bottom: Fe K-edge unfiltered EXAFS data (k3χ(k), inset) and the corresponding Fourier transform of D. Experimental data are shown with dotted (•••) lines and fits with solid (–––) lines. Please see Supporting Information for further details of the EXAFS analysis.
Analysis of the EXAFS for D (Figure 4, bottom) provides a best fit with 0.9 O/N scatterer at 1.77 Å, which can be assigned to a hydroxide ligand, and a shell of 3 O/N scatterers at 2.00 Å, associated with equatorial nitrogen donors of the supporting TMG3tren ligand. Attempts to incorporate a scattering atom corresponding to a longer Fe-Naxial bond into the EXAFS fit afforded unreasonably large values for the disorder parameter σ2 for this shell and a decrease in fit quality, indicating that inclusion of this shell in the fit is not justified. (For further details of the EXAFS analysis, see Table S2 in the Supporting Information and associated text and figures.)
The FeIII-OH bond distance of approximately 1.77 Å found for D by EXAFS is comparable to the Fe-O− distance of 1.813(3) Å seen in the oxoiron(III) complex 627 and falls at the short end of the range of distances (1.77–1.93 Å) found for crystallographically characterized nonheme monoiron FeIII-OH and FeIII-OMe complexes.27–29,31–35 These FeIII-O distances appear to be dictated by the two factors, the Lewis acidity of the iron center and the extent of H-bonding interactions. As might be expected, the shorter FeIII-O distances are observed for complexes supported by neutral ligands, whereas the longer FeIII-O bonds are seen for less Lewis acidic iron centers ligated by trianionic ligands. Notably, the majority of the FeIII-OH complexes that have been crystallized thus far contain stabilizing H-bond interactions between N-H groups in the supporting ligand and the bound hydroxide, which have been shown to cause elongation of the FeIII-OH bond length.29 Indeed the FeIII-OMe bond lengths of 1.772(3) and 1.782(3) Å found, respectively, in the crystal structures of the 6-coordinate iron(III) methoxide complexes of the pentadentate N4Py and Py5 (2,6-bis(bis(2-pyridyl)methoxymethane)pyridine) ligands, where such H-bond interactions are absent, represent the lower boundary of the aforementioned range of Fe-O distances.34,35 In contrast, the shortest Fe-OH bond observed thus far of only 1.835(2) Å was found for a 6-coordinate complex of a neutral N4Py-derived ligand containing two H-bond donating groups.33 Considering that D is a 5-coordinate complex supported by a neutral ligand that contains no H-bond donors, its unusually short FeIII-OH bond is justifiable.
Studies with deuterated ligand
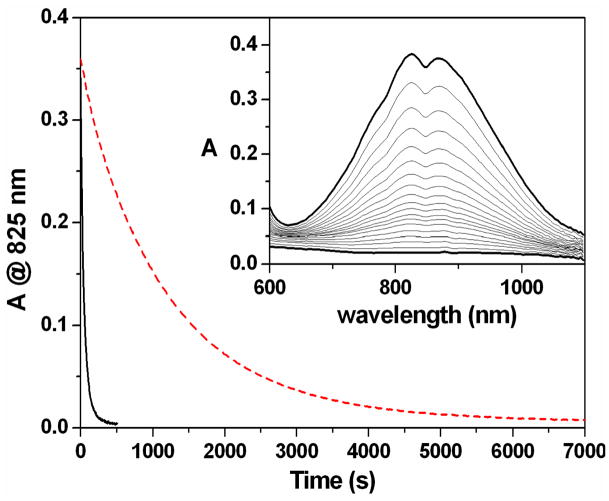
As a consequence of the lack of supporting structural evidence for the assignment of C, ligand hydroxylation was probed indirectly using the assumption that ligand hydroxylation was likely to occur at the methyl substituents, due to their close proximity to the oxoiron unit, and would therefore be accompanied by a significant KIE. To this end the perdeuteromethyl ligand d36-TMG3tren (Chart 1) was prepared and the kinetics of self-decay of the corresponding oxoiron(IV) complex [FeIV(O)(d36-TMG3tren)]2+ (d36-1) at 25°C measured. A first order fit of the decay of the near IR features in the corresponding UV-Vis spectrum yielded a rate constant, ksd, of 8.4 × 10⁻⁴ s−1 (t1/2 = 13.2 min.) versus a ksd of 2.0 × 10⁻² s−1 for 1, which corresponds to a KIE upon self-decay of 24 (Figure 5).
Figure 5.
Main: self-decay kinetic profiles for 2 mM CH3CN solutions of 1 (solid black line) and d36-1 (dashed red line), at 25°C, based upon changes in absorbance at 825 nm. Inset: NIR changes accompanying the self-decay of a 2 mM CH3CN solution of d36-1, at 25°C.
The large KIE value associated with the self-decay of 1 indicates that intramolecular hydrogen atom abstraction from the methyl substituents is the rate determining step in the decay process. Furthermore, this value significantly exceeds the semi-classical limit at 25°C of 7, which is suggestive of the involvement of a hydrogen atom tunneling process. However, confirmation of this requires measurement of the KIE upon the Arrhenius activation parameters associated with decay of 1.36–38 Tunneling contributions would be expected to manifest in a ratio of the pre-exponential collision factors, AH/AD, for 1 (AH) and d36-1 (AD) of less than 0.7 and a difference in activation enthalpies (ΔEA) greater than the zero-point energy difference (ΔZPE) between the C-H and C-D bonds of the methyl substituents in 1 and d36-1, respectively (1.15 kcal mol−1).37 Arrhenius plots of ln(ksd) for 1 and d36-1 versus reciprocal temperature (1/T) (Figure 6) yield AH and AD values of 1.53 × 10¹⁰ and 4.26 × 10¹⁰, respectively, which corresponds to an AH/AD of 0.33. Additionally, values of 16.2 and 18.7 kcal mol−1 for EA(1) and EA(d36-1), respectively, yield a ΔEA of 2.47 kcal mol−1, which is more than twice as large as the ΔZPE. The KIE upon the Arrhenius activation parameters associated with self-decay of 1 confirms that there are tunneling contributions to the rate-determining intramolecular hydrogen atom abstraction from the methyl substituents of TMG3tren.
Figure 6.
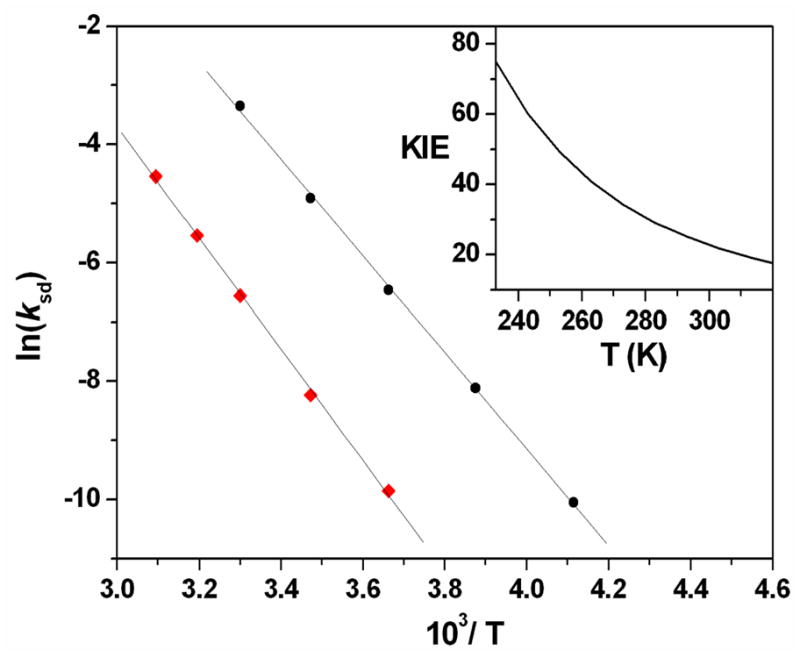
Main: Arrhenius plot of ln ksd vs. 1/T for 1 (●) and d36-1 ( ). Inset: Variation in the KIE upon self-decay of 1 as a function of temperature, derived from fitting to the Arrhenius plot.
It should be noted that attack of the methyl substituents of the TMG3tren ligand involves cleavage of strong C-H bonds. For reference the C-H bond dissociation enthalpy (BDE) of trimethylamine, which provides a reasonable approximation of the tetramethylguanidinyl groups, is 93.2 kcal mol−1. Hence, an obvious question is whether strong C-H bonds can also be attacked in an intermolecular sense by 1. To this end, addition of THF (BDE of 92.1 ± 1.6 kcal mol−1) and THF-d8 to d36-1 was found to accelerate decay of the NIR features associated with the oxoiron(IV) unit. The pseudo-first order rate constants obtained therefrom were found to be linearly dependent upon substrate concentration, thereby yielding second order rate constants, k2, at 0°C of 4.1 × 10⁻³ and 9.9 × 10⁻⁵ M−1 s−1 in reaction with THF and THF-d8, respectively, which corresponds to a KIE of 40 (Figure S4). EPR spectral analysis of the iron products from reaction of d36-1 with THF yielded a similar mixture of ferric products, designated as D, as found for the reaction between 1 and 1,4-CHD. The similarity of the KIE and k2 values obtained in reaction with THF and its perdeuterated isotopomer to those observed in the self-decay of 1 and d36-1 at 0°C (1.6 × 10⁻³ and 5.3 × 10⁻⁵ s−1, respectively; KIE = 30) suggests that similar factors govern the intra- and intermolecular decay of 1. Furthermore, similarly large KIE values associated with H-atom abstraction have been found in reactions of S = 1 oxoiron(IV) complexes 4 and 5 with THF (26 and 32, respectively, at 40°C) and a variety of other substrates as well.39 This is also true for oxoiron(IV) porphyrin radical cation species,40,41 thereby hinting at a possible mechanistic commonality amongst all high-valent oxoiron complexes in H-atom abstraction reactions.
Crystallographic Studies
Linear extrapolation of the Arrhenius fits for 1 and d36-1 indicate that at −40°C these complexes would be expected to have respective half-lives (t1/2) of 19.3 and 1450 hours, which corresponds to a KIE upon self-decay of 75. Exploitation of the superior stability of d36-1 allowed crystals suitable for X-ray data collection to be obtained, at −80°C from a dichloromethane solution of perdeuteromethyl complex layered with pentane. (Crystals of the non-deuterated complex 1 were also successfully grown, but the crystals were found to undergo collapse more rapidly during X-ray data collection, which prevented collection of a data set sufficiently large to provide a high quality structure.)
As anticipated, the complex has a pseudo-C3 symmetric TBP geometry with an axially-oriented oxo-ligand that is buried in a cavity formed by the staggered array of bulky tetramethylguanidinyl donors (Figure 7A), which is strongly reminiscent of [FeIII(H3buea)(O)]2− (6).27 The large scale steric protection of the oxo moiety is vividly illustrated by the van der Waals space-filling model for d36-1 (Figure 7B) and might be expected to greatly inhibit access by external substrates, as suggested by previously reported reactivity studies, manifesting in relatively sluggish reactivity. All metal-ligand bond distances are in close agreement with previously reported DFT calculations and EXAFS measurements (Table 3). As expected based upon relative bond orders, the Fe=O bond distance of 1.661(2) Å in d36-1 is significantly shorter than the Fe-O− bond in 6 (1.813(3) Å). It is, however, very similar to those of the S = 2 oxoiron(IV) intermediates of TauD, CytC3 and SyrB2 that have been trapped and analyzed by EXAFS7,42,43 and those of S = 1 complexes 3, 4 and [FeIV(O)(TMC-Py)]2+ (7; TMC-Py = 1-(2-pyridylmethyl)-4,8,11-trimethyl-1,4,8,11-tetraazacyclotetradecane) (1.646(3), 1.639(5) and 1.667(3) Å, respectively) derived from their high-resolution crystal structures.44–46 The apparent insensitivity of the Fe=O bond distance to spin state is not surprising given that moving from the S = 1 to the S = 2 configuration involves occupation of anti-bonding orbitals associated with the equatorial ligands and not the oxoiron unit, which means that the Fe=O bond is unperturbed.13,16 As a consequence, one might expect the average Fe-Nequatorial bond length in d36-1 to be significantly elongated, relative to those of 3, 4, and 7. This is not the case. In fact, the average Fe-Nequatorial bond length of 2.005 Å in d36-1 is only 0.048 Å longer than the corresponding distance in 4 (1.957 Å) and 0.086 and 0.078 Å shorter than those in 3 (2.091 Å) and 7 (2.083 Å), respectively. This presumably reflects the lower coordination number of d36-1 and the high basicity of the peralkylguanidinyl donors.47 Additionally, the Fe-Naxial length of 2.112(3) Å in d36-1 is 0.107 Å longer than the corresponding average Fe-Nequatorial length and, although it is tempting to attribute this disparity to the strong trans effect of the oxo-donor, a similar trend is seen in the X-ray structure of the iron(II) starting material11 and 6, which suggests that it is most likely a consequence of the tight bite angle (average Naxial-Fe-Nequatorial = 82.19°) associated with the 5-membered chelate rings formed by tren coordination.
Figure 7.
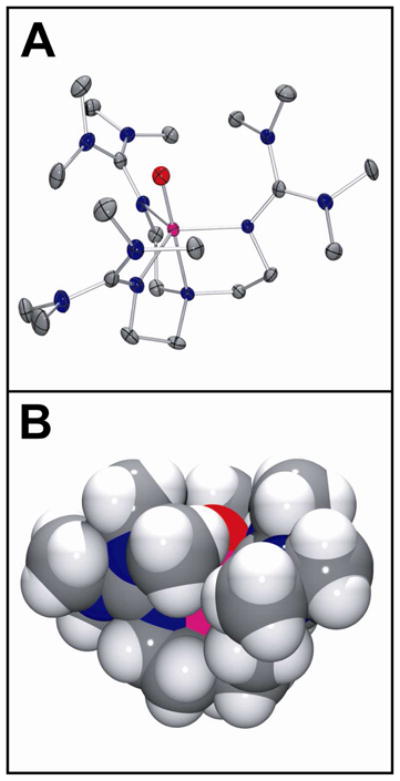
(A) Thermal ellipsoid drawing of [FeIV(O)(TMG3tren)]2+ (d36-1), showing 50% probability ellipsoids. Hydrogen atoms, counterions and solvent molecules have been omitted for clarity. (B) van der Waals space-filling model of d36-1, with view parallel to the Fe=O axis. Counterions and solvent molecules have been omitted for clarity. Atom color scheme: C, gray; H, white; N, blue, O, red; Fe, magenta.
Table 3.
Selected bond lengths from X-ray crystallographic analysis of oxoiron(IV) complexes.
| Complex | Bond Lengths (Å) |
Ref. | ||
|---|---|---|---|---|
| Fe=O | Average Fe- Neq | Fe- Naxial | ||
| d36-1 | 1.661(2) | 2.005 | 2.112(3) | This work |
| d36-1 (DFT) | 1.648 | 2.034 | 2.121 | 11 |
| d36-1 (EXAFS)a | 1.65 | 1.99 | 1.99 | 11 |
| 3 | 1.646(3) | 2.091 | 2.058(3) | 44 |
| 4 | 1.639(5) | 1.957 | 2.033(8) | 45 |
| 7 | 1.667(3) | 2.083 | 2.118(3) | 46 |
| 6b | 1.813(3) | 2.056 | 2.276(4) | 27 |
The resolution of this technique is not sufficient to distinguish between Nequatorial and Naxial scatterers.
Complex 6 crystallized with 2 independent, but very similar, anions in an asymmetric unit. The bond lengths quoted are an average of the 2 independent anions.
A particularly notable feature of the X-ray structure of d36-1 is that the canted arrangement of the tetramethylguanidinyl donors brings one methyl group on each arm into close proximity with the oxo-atom, which manifests in three symmetrically arranged C-D···O non-bonded contacts in the 2.38 – 2.49 Å range (Figure S5A), which were calculated based on normalized D positions, where r(C-D) = 1.085 Å. These are very short sp3-centered C-H···O non-bonded contacts,48 with the lower end of this range being the experimental VDW limit. This should be contrasted with 3 (Figure S5B), which exhibits six similarly short sp3-centered C-H···O non-bonded contacts of 2.306–2.657 Å, between the oxo-donor and the methylene units that line the rim of the cavity containing it, but decays at a rate more than 3 orders of magnitude more slowly than 1. This discrepancy in lifetime may, at least in part, be related to the corresponding C-H···O angles, which ideally should be linear (180°) for optimal hydrogen atom abstraction reactivity. In 3 the C-H···O angles vary between 100.40 and 108.86° (i.e. the C-H bonds are effectively parallel to the Fe=O bond), whereas in 1 the C-D···O angles vary between 115.46 and 118.01° with an average of 116.84°. Although the C-H···O angles in 1 are more obtuse than those in 3, it is debatable whether this relatively small change is sufficient to justify the large difference in stability of these two complexes.
Mechanistic Perspective
Complex 1 readily undergoes self-decay and exhibits a half-life of 30 s at 25 °C, which is at least three orders of magnitude shorter than those of complexes 3 – 5. This behavior is consistent with expectations from several DFT calculations, which suggest that an S = 2 FeIV=O unit is inherently more reactive than one with an S = 1 spin state.12–15 However, high-spin 1 oxidizes added hydrocarbon substrates at rates comparable to or slower than those of existing S = 1 complexes 3, 4 and 5. This unexpectedly low reactivity has been attributed to the steric bulk of the ligand that protects the Fe=O unit, but also hinders access of potential substrates to it. Notably, the self-decay of 4 and 5 is slowed by use of CD3CN as a solvent, in place of CH3CN (solvent KIE values of 3 for 4 at 50°C and 4 for 5 at 40°C18), implicating a self-decay mechanism involving rate-determining intermolecular hydrogen-atom abstraction from solvent. In contrast, the self-decay rate of 1 is unperturbed by solvent deuteration. This observation, together with the strictly first-order kinetics of the self-decay process and the nature of the self-decay products from 1, as characterized by ESI-MS, suggests an intramolecular decay mechanism involving ligand hydroxylation that is postulated in Scheme 1 below.
Scheme 1.
The first step of this mechanism is proposed to be a rate-determining hydrogen atom abstraction from the methyl groups of the supporting TMG3tren ligand, a notion supported by the observation of a KIE of 24 for self-decay at 25°C upon perdeuteration of the methyl substituents. Measurement of the Arrhenius parameters associated with self-decay of 1 and d36-1 yielded AH/AD and ΔEA values inconsistent with those expected for a semi-classical mechanism, but indicative of significant tunneling contributions to this hydrogen atom abstraction step.37 In hindsight, this intramolecular reaction might perhaps be seen as inevitable based upon the observation of very short non-bonded C-H···O contacts in the X-ray structure of d36-1. Moreover, there is precedence for such reactivity in tetramethylguanidinyl-ligated active oxygen containing copper complexes.49,50
The ligand-based radical generated by initial hydrogen atom abstraction (A) might be expected to either be trapped by dioxygen, or undergo rapid oxygen rebound with the associated hydroxoiron(III) moiety, as frequently invoked in oxygen activating enzymatic systems.51–54 Observation of extensive 18O-atom incorporation into the products of self-decay of 18O-labeled 1, regardless of whether the self-decay took place under nitrogen or in the presence of air, indicates that the latter process is predominant. Rapid oxygen rebound would presumably lead to generation of an iron(II) complex of the hydroxylated ligand (B). Instead, several iron(III) species were observed by Mössbauer and EPR spectroscopies, collectively accounting for > 90% of the Fe in the sample (Table 2). One subset of these iron(III) species has spectroscopic properties indistinguishable from those of the putative FeIII-OH complex (D1 – D3) obtained from the reaction of 1 with 1,4-CHD. The other iron(III) product is most reasonably assigned as the alkoxoiron(III) complex (C) observed by ESI-MS. This mixture of iron(III) products presumably forms via rapid reaction of B with residual 1, thereby converting B to C and generating an equivalent of D in the process. We note that 1 does not readily react with its iron(II) precursor 2, which is presumably the reason for the accumulation of 1 in high yield during its synthesis. However B differs from 2 in having as its fifth ligand an alcohol moiety instead of acetonitrile. The alcohol has a proton that can facilitate rapid proton-coupled electron transfer between 1 and B, a notion consistent with previous reports indicating that O-atom transfer and PCET dominate the reaction landscape of oxoiron(IV) complexes.18,19,55–57
The intramolecular ligand hydroxylation observed during the self-decay of 1 in many ways strongly resembles the behavior of mononuclear non-heme iron monooxygenases in the reaction of the incipient FeIV=O intermediate with the target C-H bond, which is effectively an intramolecular event due to prior binding of the substrate within the active site domain or, in some cases, direct coordination to the metal center itself.1,2,58–61 Furthermore, the short C-H···O non-bonded contacts seen in the X-ray structure of 1 mirrors the high level of substrate pre-organization imposed by second-sphere amino-acid residues that brings the target substrate C-H bond into close proximity with the high-spin oxoiron(IV) oxidant.7,62 The favorable orientation for selective reaction is manifested in the large KIE values observed in the cleavage of the target C-H bonds for 1 and for the high-spin oxoiron(IV) intermediates of TauD,63 P4H,4 CytC3,6 and SyrB2.7
Complex 1 is a unique example of an isolable synthetic S = 2 oxoiron(IV) species. Its high-spin state is a consequence of the TBP geometry enforced about the iron center by the steric bulk associated with the tetramethylguanidinyl donors of the tetradentate tripodal TMG3tren ligand. The use of the perdeuterated TMG3tren ligand retarded its self-decay significantly, allowing a high-resolution crystal structure to be solved. The solution of this first crystal structure of a high-spin (S = 2) oxoiron(IV) center represents a fundamental step on the path towards a full understanding of these pivotal biological intermediates.
Supplementary Material
Acknowledgments
This work was supported by National Institutes of Health grants GM-33162 to L.Q. and EB-001475 to E.M. XAS data were collected on beamline X3B at the National Synchrotron Light Source (NSLS), Brookhaven National Laboratory. NSLS is supported by the U.S. Department of Energy, Office of Science, Office of Basic Energy Sciences, under Contract No. DE-AC02-98CH10886. We thank Michael Sullivan for technical assistance with our XAS experiments.
Footnotes
Supporting Information Available: Experimentally observed and calculated ESI-MS spectra, an additional EPR spectrum of the reaction product of 1 with 1,4-CHD, kinetic data for reaction of 1 with THF and THF-d8, figures highlighting close C-H(D)···O non-bonding contacts in d36-1 and 3 and further details pertaining to the XAS analysis of D. This material is available free of charge via the Internet at http://pubs.acs.org.
References
- 1.Krebs C, Galonic Fujimori D, Walsh CT, Bollinger JM., Jr Acc Chem Res. 2007;40:484–492. doi: 10.1021/ar700066p. [DOI] [PMC free article] [PubMed] [Google Scholar]
- 2.Kovaleva EG, Lipscomb JD. Nat Chem Biol. 2008;4:186–193. doi: 10.1038/nchembio.71. [DOI] [PMC free article] [PubMed] [Google Scholar]
- 3.Price JC, Barr EW, Tirupati B, Bollinger JM, Jr, Krebs C. Biochemistry. 2003;42:7497–7508. doi: 10.1021/bi030011f. [DOI] [PubMed] [Google Scholar]
- 4.Hoffart LM, Barr EW, Guyer RB, Bollinger JM, Jr, Krebs C. Proc Natl Acad Sci USA. 2006;103:14738–14743. doi: 10.1073/pnas.0604005103. [DOI] [PMC free article] [PubMed] [Google Scholar]
- 5.Eser BE, Barr EW, Frantom PA, Saleh L, Bollinger JM, Jr, Krebs C, Fitzpatrick PF. J Am Chem Soc. 2007;129:11334–11335. doi: 10.1021/ja074446s. [DOI] [PMC free article] [PubMed] [Google Scholar]
- 6.Galonic DP, Barr EW, Walsh CT, Bollinger JM, Jr, Krebs C. Nat Chem Biol. 2007;3:113–116. doi: 10.1038/nchembio856. [DOI] [PubMed] [Google Scholar]
- 7.Matthews ML, Krest CM, Barr EW, Vaillancourt FH, Walsh CT, Green MT, Krebs C, Bollinger JM., Jr Biochemistry. 2009;48:4331–4343. doi: 10.1021/bi900109z. [DOI] [PMC free article] [PubMed] [Google Scholar]
- 8.Que L., Jr Acc Chem Res. 2007;40:493–500. doi: 10.1021/ar700024g. [DOI] [PubMed] [Google Scholar]
- 9.Pestovsky O, Bakac A. J Am Chem Soc. 2004;126:13757–13764. doi: 10.1021/ja0457112. [DOI] [PubMed] [Google Scholar]
- 10.Pestovsky O, Stoian S, Bominaar EL, Shan X, Munck E, Que L, Jr, Bakac A. Angew Chem, Int Ed. 2005;44:6871–6874. doi: 10.1002/anie.200502686. [DOI] [PubMed] [Google Scholar]
- 11.England J, Martinho M, Farquhar ER, Frisch JR, Bominaar EL, Munck E, Que L., Jr Angew Chem, Int Ed. 2009;48:3622–3626. doi: 10.1002/anie.200900863. [DOI] [PMC free article] [PubMed] [Google Scholar]
- 12.Ye S, Neese F. Curr Opin Chem Biol. 2009;13:89–98. doi: 10.1016/j.cbpa.2009.02.007. [DOI] [PubMed] [Google Scholar]
- 13.Decker A, Rohde J-U, Klinker EJ, Wong SD, Que L, Jr, Solomon EI. J Am Chem Soc. 2007;129:15983–15996. doi: 10.1021/ja074900s. [DOI] [PMC free article] [PubMed] [Google Scholar]
- 14.Bernasconi L, Louwerse MJ, Baerends EJ. Eur J Inorg Chem. 2007:3023–3033. [Google Scholar]
- 15.Hirao H, Kumar D, Que L, Jr, Shaik S. J Am Chem Soc. 2006;128:8590–8606. doi: 10.1021/ja061609o. [DOI] [PubMed] [Google Scholar]
- 16.Neese F. J Inorg Biochem. 2006;100:716–726. doi: 10.1016/j.jinorgbio.2006.01.020. [DOI] [PubMed] [Google Scholar]
- 17.Macikenas D, Skrzypczak-Jankun E, Protasiewicz JD. J Am Chem Soc. 1999;121:7164–7165. [Google Scholar]
- 18.Kaizer J, Klinker EJ, Oh NY, Rohde JU, Song WJ, Stubna A, Kim J, Muenck E, Nam W, Que L., Jr J Am Chem Soc. 2004;126:472–473. doi: 10.1021/ja037288n. [DOI] [PubMed] [Google Scholar]
- 19.Sastri CV, Lee J, Oh K, Lee YJ, Lee J, Jackson TA, Ray K, Hirao H, Shin W, Halfen JA, Kim J, Que L, Jr, Shaik S, Nam W. Proc Natl Acad Sci USA. 2007;104:19181–19186. doi: 10.1073/pnas.0709471104. [DOI] [PMC free article] [PubMed] [Google Scholar]
- 20.Lanci MP, Smirnov VV, Cramer CJ, Gauchenova EV, Sundermeyer J, Roth JP. J Am Chem Soc. 2007;129:14697–14709. doi: 10.1021/ja074620c. [DOI] [PubMed] [Google Scholar]
- 21.Hagadorn JR, Que L, Jr, Tolman WB. Inorg Chem. 2000;39:6086–6090. doi: 10.1021/ic000531o. [DOI] [PubMed] [Google Scholar]
- 22.George CN. EXAFSPAK. Stanford Synchrotron Radiation Laboratory, Stanford Linear Accelerator Center; Stanford, CA: 2000. [Google Scholar]
- 23.SMART V5.054. Bruker Analytical X-ray Systems. Madison, WI: 2001. [Google Scholar]
- 24.Blessing RH. Acta Crystallogr, Sect A: Found Crystallogr. 1995;A51:33–8. doi: 10.1107/s0108767394005726. [DOI] [PubMed] [Google Scholar]
- 25.SAINT+ V 6.45. Bruker Analytical X-Ray Systems. Madison, WI: 2003. [Google Scholar]
- 26.SHELXTL V6.14. Bruker Analytical X-Ray Systems. Madison, WI: 2000. [Google Scholar]
- 27.MacBeth CE, Golombek AP, Young VG, Jr, Yang C, Kuczera K, Hendrich MP, Borovik AS. Science. 2000;289:938–941. doi: 10.1126/science.289.5481.938. [DOI] [PubMed] [Google Scholar]
- 28.MacBeth CE, Gupta R, Mitchell-Koch KR, Young VG, Jr, Lushington GH, Thompson WH, Hendrich MP, Borovik AS. J Am Chem Soc. 2004;126:2556–2567. doi: 10.1021/ja0305151. [DOI] [PubMed] [Google Scholar]
- 29.Mukherjee J, Lucas RL, Zart MK, Powell DR, Day VW, Borovik AS. Inorg Chem. 2008;47:5780–5786. doi: 10.1021/ic800048e. [DOI] [PMC free article] [PubMed] [Google Scholar]
- 30.Dey A, Hocking RK, Larsen P, Borovik AS, Hodgson KO, Hedman B, Solomon EI. J Am Chem Soc. 2006;128:9825–9833. doi: 10.1021/ja061618x. [DOI] [PubMed] [Google Scholar]
- 31.Ogo S, Wada S, Watanabe Y, Iwase M, Wada A, Harata M, Jitsukawa K, Masuda H, Einaga H. Angew Chem, Int Ed. 1998;37:2102–2104. doi: 10.1002/(SICI)1521-3773(19980817)37:15<2102::AID-ANIE2102>3.0.CO;2-A. [DOI] [PubMed] [Google Scholar]
- 32.Harman WH, Chang CJ. J Am Chem Soc. 2007;129:15128–15129. doi: 10.1021/ja076842g. [DOI] [PubMed] [Google Scholar]
- 33.Soo HS, Komor AC, Iavarone AT, Chang CJ. Inorg Chem. 2009;48:10024–10035. doi: 10.1021/ic9006668. [DOI] [PubMed] [Google Scholar]
- 34.Roelfes G, Lubben M, Chen K, Ho RYN, Meetsma A, Genseberger S, Hermant RM, Hage R, Mandal SK, Young VG, Jr, Zang Y, Kooijman H, Spek AL, Que L, Feringa BL. Inorg Chem. 1999;38:1929–1936. doi: 10.1021/ic980983p. [DOI] [PubMed] [Google Scholar]
- 35.Goldsmith CR, Jonas RT, Stack TDP. J Am Chem Soc. 2002;124:83–96. doi: 10.1021/ja016451g. [DOI] [PubMed] [Google Scholar]
- 36.Kohen A, Klinman JP. Acc Chem Res. 1998;31:397–404. [Google Scholar]
- 37.Kwart H. Acc Chem Res. 1982;15:401–408. [Google Scholar]
- 38.Caldin EF. Chem Rev. 1969;69:135–156. [Google Scholar]
- 39.Klinker EJ, Shaik S, Hirao H, Que L., Jr Angew Chem, Int Ed. 2009;48:1291–1295. doi: 10.1002/anie.200804029. [DOI] [PMC free article] [PubMed] [Google Scholar]
- 40.Sorokin AB, Khenkin AM. J Chem Soc, Chem Commun. 1990:45–6. [Google Scholar]
- 41.Pan Z, Horner JH, Newcomb M. J Am Chem Soc. 2008;130:7776–7777. doi: 10.1021/ja802484n. [DOI] [PMC free article] [PubMed] [Google Scholar]
- 42.Riggs-Gelasco PJ, Price JC, Guyer RB, Brehm JH, Barr EW, Bollinger JM, Jr, Krebs C. J Am Chem Soc. 2004;126:8108–8109. doi: 10.1021/ja048255q. [DOI] [PubMed] [Google Scholar]
- 43.Fujimori DG, Barr EW, Matthews ML, Koch GM, Yonce JR, Walsh CT, Bollinger JM, Jr, Krebs C, Riggs-Gelasco PJ. J Am Chem Soc. 2007;129:13408–13409. doi: 10.1021/ja076454e. [DOI] [PubMed] [Google Scholar]
- 44.Rohde JU, In JH, Lim MH, Brennessel WW, Bukowski MR, Stubna A, Muenck E, Nam W, Que L., Jr Science. 2003;299:1037–1039. doi: 10.1126/science.299.5609.1037. [DOI] [PubMed] [Google Scholar]
- 45.Klinker EJ, Kaizer J, Brennessel WW, Woodrum NL, Cramer CJ, Que L., Jr Angew Chem, Int Ed. 2005;44:3690–3694. doi: 10.1002/anie.200500485. [DOI] [PubMed] [Google Scholar]
- 46.Thibon A, England J, Martinho M, Young VG, Jr, Frisch JR, Guillot R, Girerd J-J, Muenck E, Que L, Jr, Banse F. Angew Chem, Int Ed. 2008;47:7064–7067. doi: 10.1002/anie.200801832. [DOI] [PMC free article] [PubMed] [Google Scholar]
- 47.Yamamoto Y, Kojima S. In: The Chemistry of Amidines and Imidates. Patai S, Rappoport Z, editors. Vol. 2. J. Wiley & Sons; Chichester: 1991. pp. 485–526. [Google Scholar]
- 48.Rowland RS, Taylor R. J Phys Chem. 1996;100:7384–91. [Google Scholar]
- 49.Maiti D, Lee D-H, Gaoutchenova K, Wuertele C, Holthausen MC, Narducci Sarjeant AA, Sundermeyer J, Schindler S, Karlin KD. Angew Chem, Int Ed. 2008;47:82–85. doi: 10.1002/anie.200704389. [DOI] [PubMed] [Google Scholar]
- 50.Herres S, Heuwing AJ, Floerke U, Schneider J, Henkel G. Inorg Chim Acta. 2005;358:1089–1095. [Google Scholar]
- 51.Groves JT. J Chem Educ. 1985;62:928–31. [Google Scholar]
- 52.Groves JT. J Inorg Biochem. 2006;100:434–447. doi: 10.1016/j.jinorgbio.2006.01.012. [DOI] [PubMed] [Google Scholar]
- 53.Merkx M, Kopp DA, Sazinsky MH, Blazyk JL, Muller J, Lippard SJ. Angew Chem, Int Ed. 2001;40:2782–2807. doi: 10.1002/1521-3773(20010803)40:15<2782::AID-ANIE2782>3.0.CO;2-P. [DOI] [PubMed] [Google Scholar]
- 54.Chakrabarty S, Austin RN, Deng D, Groves JT, Lipscomb JD. J Am Chem Soc. 2007;129:3514–3515. doi: 10.1021/ja068188v. [DOI] [PMC free article] [PubMed] [Google Scholar]
- 55.Fukuzumi S, Kotani H, Suenobu T, Hong S, Lee YM, Nam W. Chem Eur J. 2010;16:354–361. doi: 10.1002/chem.200901163. [DOI] [PubMed] [Google Scholar]
- 56.Collins MJ, Ray K, Que L., Jr Inorg Chem. 2006;45:8009–8011. doi: 10.1021/ic061263i. [DOI] [PMC free article] [PubMed] [Google Scholar]
- 57.Wang D, Zhang M, Buhlmann P, Que L., Jr J Am Chem Soc. 2010;132 doi: 10.1021/ja909923w. accepted for publication. [DOI] [PMC free article] [PubMed] [Google Scholar]
- 58.Zhou J, Kelly WL, Bachmann BO, Gunsior M, Townsend CA, Solomon EI. J Am Chem Soc. 2001;123:7388–7398. doi: 10.1021/ja004025+. [DOI] [PubMed] [Google Scholar]
- 59.Brown CD, Neidig ML, Neibergall MB, Lipscomb JD, Solomon EI. J Am Chem Soc. 2007;129:7427–7438. doi: 10.1021/ja071364v. [DOI] [PMC free article] [PubMed] [Google Scholar]
- 60.Neidig ML, Brown CD, Light KM, Fujimori DG, Nolan EM, Price JC, Barr EW, Bollinger JM, Jr, Krebs C, Walsh CT, Solomon EI. J Am Chem Soc. 2007;129:14224–14231. doi: 10.1021/ja074557r. [DOI] [PMC free article] [PubMed] [Google Scholar]
- 61.Ohta T, Chakrabarty S, Lipscomb JD, Solomon EI. J Am Chem Soc. 2008;130:1601–1610. doi: 10.1021/ja074769o. [DOI] [PMC free article] [PubMed] [Google Scholar]
- 62.Matthews ML, Neumann CS, Miles LA, Grove TL, Booker SJ, Krebs C, Walsh CT, Bollinger JM., Jr Proc Natl Acad Sci U S A. 2009;106:17723–17728. S17723/1–S17723/9. doi: 10.1073/pnas.0909649106. [DOI] [PMC free article] [PubMed] [Google Scholar]
- 63.Price JC, Barr EW, Glass TE, Krebs C, Bollinger JM., Jr J Am Chem Soc. 2003;125:13008–13009. doi: 10.1021/ja037400h. [DOI] [PubMed] [Google Scholar]
Associated Data
This section collects any data citations, data availability statements, or supplementary materials included in this article.


