Abstract
Orosomucoid (ORM), also called α-1 acid glycoprotein, is an abundant plasma protein that is an immunomodulator induced by stressful conditions such as infections. In this study, we reveal that Orm is induced selectively in the adipose tissue of obese mice to suppress excess inflammation that otherwise disturbs energy homeostasis. Adipose Orm levels were elevated by metabolic signals, including insulin, high glucose, and free fatty acid, as well as by the proinflammatory cytokine tumor necrosis factor-α, which is found in increased levels in the adipose tissue of morbid obese subjects. In both adipocytes and macrophages, ORM suppressed proinflammatory gene expression and pathways such as NF-κB and mitogen-activated protein kinase signalings and reactive oxygen species generation. Concomitantly, ORM relieved hyperglycemia-induced insulin resistance as well as tumor necrosis factor-α-mediated lipolysis in adipocytes. Accordingly, ORM improved glucose and insulin tolerance in obese and diabetic db/db mice. Taken together, our results suggest that ORM integrates inflammatory and metabolic signals to modulate immune responses to protect adipose tissue from excessive inflammation and thereby from metabolic dysfunction.
Keywords: Adipocyte, Cytokine, Diabetes, Energy Metabolism, Inflammation, Obesity, Adipocytokine, Lipid and Glucose Metabolism, Orosomucoid
Introduction
Inflammation is an essential host response to tissue injury or infection for the eventual restoration of tissue structure and function. Prolonged inflammation, however, can contribute to the pathogenesis of many diseases leading to loss of the tissue or organ function as in rheumatoid arthritis, myocardial infarction, and ischemia-reperfusion injury. Recently, the chronic increase of systemic and local inflammation in peripheral tissues has also been shown to play causative roles in the development of metabolic disorders such as atherosclerosis and type 2 diabetes mellitus, which are often observed in morbidly obese subjects (1, 2). In obese subjects, chronic inflammation in the adipose tissue interferes with its normal functions that include buffering lipid metabolites and secreting adipocytokines; these functions are involved in regulating the local and systemic insulin sensitivity and in the development of metabolic abnormalities. For instance, TNFα,3 a prominent proinflammatory cytokine, is observed at elevated levels in the adipose tissue of obese subjects and hampers insulin signaling and expression of adipocyte-specific genes such as peroxisome proliferator-activated receptor-γ and adiponectin by activating MAPKs and NF-κB transcription factor pathways (2–6). Conversely, the neutralization of TNFα with specific antibodies improves glucose metabolism in obese and diabetic subjects (3).
Accumulating evidence has suggested that the induction of inflammatory gene expression in the adipose tissue of obese subjects is associated with an increase of macrophage infiltration into the adipose tissue (7–9). In obese subjects, increased production of chemokines and inflammatory cytokines from adipocytes facilitates the recruitment of macrophages into the adipose tissue (2, 10). In particular, macrophages in the adipose tissue of obese subjects are prone to secrete high levels of proinflammatory cytokines, which stimulate lipolysis in adipocytes thus releasing free fatty acids (FFAs); the FFAs activate the macrophages by binding to the TLR4 receptor on the surface of macrophages to produce more proinflammatory cytokines (4). This reciprocal activation between adipocytes and macrophages forms a vicious cycle to potentiate proinflammatory responses in the adipose tissue of obese subjects, concomitant with the dysregulation of the adipocytokine genes. Indeed, fat-specific ablation of the macrophage chemoattractant protein-1 (MCP-1), a critical chemokine for macrophage infiltration into inflamed tissues, protects mice from high fat diet-induced insulin resistance; however, MCP-1 overexpression causes insulin resistance in mice (11). This suggests that adipose tissue macrophages mediate local inflammation and eventually influence the development of metabolic disturbances. Therefore, it is conceivable that suppression of proinflammatory pathways in both adipocytes and macrophages might be beneficial for treating obesity-related metabolic disorders.
Glucose and lipid metabolites are potential stimulants for inflammatory pathways in both adipocytes and macrophages. For example, abnormally increased levels of FFAs in obese subjects not only activates a proinflammatory response in macrophages but also stimulates JNKs and proinflammatory pathways in adipocytes to confer insulin resistance (12). Moreover, chronic increase in glucose concentration promotes the expression of several inflammatory genes as well as the production of reactive oxygen species (ROS), eventually leading to insulin resistance in adipocytes (13, 14). Therefore, it is likely that metabolic homeostasis would be disrupted by accumulating responses that result from metabolic changes and inflammatory signals in metabolic tissues.
Orosomucoid (ORM), also known as α-1 acid glycoprotein, is one of the most abundant plasma proteins, accounting for about 1% of all plasma proteins (15, 16). As a member of the acute phase reactant protein family, it is expressed in hepatocytes and secreted into the plasma under stressful conditions such as tissue injury, infection, and inflammation. There are two isoforms of Orm in humans, three in mice, and one in rats. Although its role in circulation is not well understood, ORM has been implicated in at least three different functions as follows: immunomodulatory function, barrier function, and carrier function (15, 16). As an immunomodulator, ORM inhibits mitogen-induced proliferation of lymphocytes and aggregation of platelets as well as chemotaxis, superoxide generation, and aggregation of neutrophils via unknown mechanisms (16, 17). Consistently, injection of exogenous ORM protects mice from TNFα-induced lethality (18). Additionally, it has been proposed that ORM changes the polyanionic charge selectivity of capillary walls, and thereby plays the role of a barrier for capillary permeability (19, 20). Another interesting feature of ORM is associated with its structure. As a member of the lipocalin family, in which the proteins possess a pocket structure for lipid molecules (lipocalin pocket), ORM interacts with several endogenous and exogenous lipid molecules, including fatty acids, lysophosphatidylcholine, and biliverdin (21, 22), suggesting a possible role of ORM as a lipid carrier protein in circulation, similar to albumin.
Although the molecular mechanisms of proinflammatory responses in the adipose tissue of obese subjects have been extensively studied, little is known about the endogenous mediators and mechanisms that can potentially abate inflammation to restore adipose tissue function and whole body energy homeostasis. Here, we prove that ORM is induced in response to both metabolic and inflammatory signals in the adipose tissue of obese mice to protect them from severe inflammation, unless there is serious disturbance in glucose and lipid homeostasis, which can eventually lead to systemic metabolic complications. Thus, we suggest that ORM is the protein that coordinates metabolic homeostasis in regulation of both energy metabolism and inflammation.
EXPERIMENTAL PROCEDURES
Cell Culture
3T3-L1 preadipocytes were grown to confluence in Dulbecco's modified Eagle's medium (DMEM) supplemented with 10% bovine calf serum. Two days postconfluence, the 3T3-L1 cells were incubated with DMEM containing 10% fetal bovine serum, methylisobutylxanthine (500 μm), dexamethasone (1 μm), and insulin (5 μg/ml) for 48 h. The culture medium was replenished every other day with DMEM containing 10% fetal bovine serum and insulin (1 μg/ml). THP-1 human monocytes and RAW264.7 mouse macrophages were maintained in RPMI 1640 medium supplemented with 10% fetal bovine serum.
Q-PCR
cDNA was synthesized using the Moloney leukemia virus reverse transcriptase with dNTPs and oligo(dT) primers (Invitrogen). These cDNAs served as templates with specific primers at annealing temperatures ranging between 54 and 60 °C in the presence of dNTPs and TaqDNA polymerase. Real time reverse transcription-PCR amplification reactions were brought to a final volume of 20 μl and contained 20 ng of reverse-transcribed total RNA, 0.25 μm of the forward and reverse primers, and SYBR Green (Bio-Rad). The MyiQ real time PCR detection system (Bio-Rad) was used for PCR amplification in 96-well plates. All reactions were performed in triplicate and repeated at least three times. The relative amounts of each mRNA were calculated by using the comparative threshold cycle (CT) method. GAPDH mRNA or 18 S rRNA was used as the invariant control. Orm isoforms in mouse samples were distinguished by isoform-specific primers as follows: Orm1-F, 5′-gtgcagctttcagaaaactcgagtaca-3′; Orm1-R, 5′-tgtttcctcagcactataaggtgggc-3′; Orm2-F, 5′-tgcatcttcaagactatcaggtctgc-3′; Orm2-R, 5′-gtgcggctgtcctaaaccctgattacc-3′; Orm3-F, 5′-ctgtggctgactcagaccctgattata-3′; and Orm3-R, 5′-tgtttctctagcactctcaggtggag-3′. The rest of the primer sequences used for PCR are available upon request.
Orm1 Knockdown
Duplex siRNA oligonucleotides were cloned into the HindIII and BglII sites in pSUPER.retro (Oligoengine, Seattle, WA), and insert fidelity was confirmed by sequencing both strands. The sense strand of the siRNA pSUPER.retro insert was as follows: gatccccGGGAAGGAGACCAAGAAAGttcaagagaCTTTCTTGGTCTCCTTCCCttttta. For stable expression of orm1 siRNA, 3T3-L1 preadipocytes were transfected with pSuper.retro-orm1siRNA plasmid DNA using Microporator (NanoEnTek, Korea). 24 h after transfection, cells were selected in media containing puromycin (2 μg/ml) for 1 week and then collected for biochemical and cellular assays.
Transient Transfection and Luciferase Reporter Assays
h293 cells were transfected 1 day before confluence by the calcium phosphate method, and luciferase reporter assays were performed as described previously (23). The orm1-luciferase plasmid contains a −1.4-kb to +150-bp fragment of the mouse Orm1 promoter in front of a luciferase reporter gene.
Chromatin Immunoprecipitation Analysis
Chromatin immunoprecipitation assays were performed as described previously (24). Primers used were as follows: forward, 5′-GAGGTTGATGTATGTGTAGGTTTCACTCCT-3′; reverse, 5′- CTTACCCAGCTCAGGGTCTC-3′.
Animals and Treatments
Male C57BL/6J, ob/ob, and db/db mice were housed in colony cages in 12-h light/12-h dark cycles. Experiments were staggered such that all mice were sacrificed at the same time, which was at the end of the dark cycle. For glucose tolerance and insulin tolerance tests, the db/db mice were fasted for 16 and 6 h, respectively, and basal blood samples were taken, followed by intraperitoneal injection of glucose (1.5 g/kg) or insulin (2 units/kg; Novolin R, Novo Nordisk). Blood samples were drawn at 15, 30, 60, 90, and 120 min or at 15, 30, 45, 60, 90, and 120 min after injection.
Human Serum Samples
Human serum samples from 60 obese and overweight nondiabetic patients were provided by Obesity Research Center in King Saud University and were analyzed for ORM protein expression by enzyme-linked immunosorbent assay. This work is under a program to study adipocyte biology and adipokines. The whole project was approved by the College of Medicine Ethics Committee, King Saud University.
ORM Treatment of db/db Mice
7-Week-old male db/db mice were treated with ORM protein as a continuous systemic infusion using micro-osmotic pumps. ORM protein, which is purified from human plasma, was purchased from Sigma. Over 95% of the protein was glycosylated. The Alzet micro-osmotic pump (model 1004, Alza) was inserted subcutaneously into the back of each mouse. The pumps released 0.34 μg/min of purified ORM protein (approximately the same rate of endogenous ORM production in mice), which elevated the level of ORM up to 2-fold than that of endogenous ORM. At 2 and 3 weeks after implantation, the mice were subjected to insulin tolerance and glucose tolerance tests and then sacrificed for tissue preparation.
Orm1 Adenovirus
Mouse Orm1 expressing adenovirus was produced from Newgex Co. (Korea).
Measurement of Glycerol Concentration
The glycerol content that was released into the culture medium of the 3T3-L1 adipocytes served as an index of lipolysis and was determined by using a colorimetric assay kit (Sigma).
Glucose Uptake Assay
Glucose uptake assays were performed as described previously (25).
Measurement of Monocyte Recruitment to Adipocytes (Immunocytochemistry)
3T3-L1 cells were differentiated into adipocytes on glass coverslips. Differentiated adipocytes (day 7) and THP-1 monocytes were pretreated with ORM (250 μg/ml) or sodium salicylate (500 μm) for 6 h and then co-cultured in Transwell plates (adipocytes in the lower plates and THP-1 in the upper plates; pore size, 8 μm) in the presence or absence of TNFα (10 ng/ml) for a further 24 h. After discarding the upper plates, the cells on the coverslips were washed three times with PBS, fixed with 3.7% paraformaldehyde, permeabilized with PBS with 0.5% Triton X-100 (PBST), incubated with 0.1% PBST containing 3% bovine serum albumin for blocking for 1 h, and subsequently incubated with CD68 monoclonal antibody (DakoCytomation) at room temperature for 1 h and washed with 0.1% PBST. The cells were then incubated at room temperature with TRITC-conjugated secondary antibodies. The coverslips were rinsed and placed on a slide glass with a mounting solution containing 4′,6-diamino-2-phenylindole. The cells were then visualized using a fluorescence microscope (Olympus), and the CD68-positive cells were quantitated using an imaging analysis program (LSM510 version 3.5; Carl Zeiss).
Whole-mount Immunohistochemistry
The mice were anesthetized by an intramuscular injection of a combination of anesthetics, and their adipose tissues were whole-mounted after fixation by vascular perfusion of 1% paraformaldehyde in PBS. The whole-mounted tissues were then incubated for 1 h at room temperature with a blocking solution containing 5% goat serum (Jackson ImmunoResearch) in 0.3% PBST. After blocking, the whole-mounted tissues were incubated overnight at 4 °C with antibodies against F4/80 (clone Cl:A3-1, diluted 1:1,000; Serotec) and α-1 acid glycoprotein (diluted 1:500; DakoCytomation). After several washes with PBST, the whole-mounted tissues were incubated for 1 h at room temperature with secondary antibodies, namely Cy3- or Cy5-conjugated anti-rat antibody or anti-rabbit antibody (diluted 1:500; Jackson ImmunoResearch). The adipocytes were stained with fluorescein isothiocyanate-conjugated BODIPY. For control experiments, the primary antibody was omitted or substituted with preimmune serum. The signals were visualized, and digital images were obtained using a Zeiss ApoTome microscope and a Zeiss LSM 510 confocal microscope equipped with argon and helium-neon lasers (Carl Zeiss).
RESULTS
Orm Is Selectively Induced in the Fat Tissues of Obese and/or Diabetic Mice
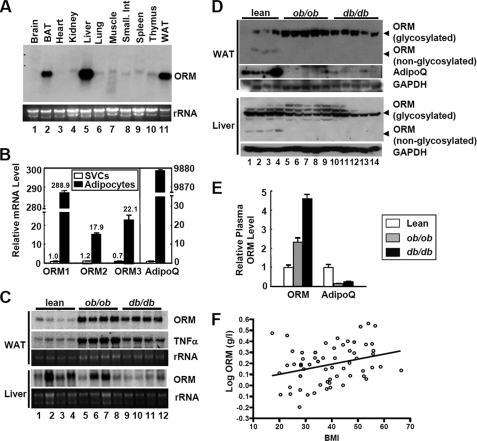
In an attempt to identify novel adipocytokines, we analyzed gene expression profiles in 3T3-L1 preadipocytes and adipocytes, as well as in the fat tissues and plasma of normal and obese/diabetic mice by using surface-enhanced laser desorption ionization-time-of-flight mass spectrometry combined with RNA microarray analysis. Among the candidates for novel adipocytokines, ORM protein was expressed to a greater extent in adipocytes than in the stromal vascular cells (SVCs) of adipose tissue and was also found in increased levels in the fat tissues and plasma of obese and/or diabetic mice (data not shown). To examine the tissue distribution of Orm mRNA in mice, we performed Northern blot analysis with several mouse tissues. Orm has previously been reported to be produced mainly in liver and expressed abundantly in adipose tissue (14–16). Consistently, high levels of Orm expression were observed in the liver, white adipose tissue, and brown adipose tissue (Fig. 1A). In mice, Orm has three isoforms, Orm1, Orm2, and Orm3. To investigate which Orm isoform is predominantly expressed in adipocytes, we conducted real time quantitative reverse transcription-PCR (Q-PCR) in both adipocytes and SVCs from the epididymal adipose tissue. As shown in Fig. 1B, all three Orm isoforms were preferentially expressed in adipocytes than in SVCs, and Orm1 was predominantly expressed in adipocytes as compared with the other Orm isoforms (Fig. 1B). Consistent with this, the expression of Orm1 mRNA was induced during adipocyte differentiation of the 3T3-L1 cells (supplemental Fig. S1).
FIGURE 1.
Orm is induced in the plasma and adipose tissues of obese subjects. A, Northern blot analysis of Orm expression in various mouse tissues. BAT, brown adipose tissue; WAT, white adipose tissue. B, mRNA levels of each Orm isoform in adipocytes and SVCs from epididymal adipose tissues of lean C57BL6 mice. Adiponectin (AdipoQ) was used as an adipocyte-specific marker gene. n = 4. C, Northern blot analysis of Orm expression in the liver and adipose tissue of obese ob/ob and db/db mice. D, Western blot analysis of ORM protein expression in the liver and adipose tissue. As ORMs are heavily glycosylated proteins (about 45% of their total mass is composed of carbohydrates), Western blot analysis of ORM with tissue samples accompanies both its glycosylated as well unglycosylated forms, as illustrated. GAPDH, glyceraldehyde-3-phosphate dehydrogenase. E, ORM protein level in the plasma of lean and obese mice. n = 4 or 5. F, correlation of plasma ORM level with body mass index (BMI). Serum ORM level was measured by enzyme-linked immunosorbent assay and plotted in accordance with body mass index. R = 0.3, p = 0.021.
Next, we tested whether Orm expression is elevated in the adipose tissue of obese mice with Northern and Western blot analyses. A marked increase in Orm expression was observed in the adipose tissue, but not in liver, of obese and/or diabetic ob/ob and db/db mice in both the mRNA and protein levels (Fig. 1, C and D, and supplemental Fig. S2), concurrently with the increasing plasma Orm levels (Fig. 1, C–E). Similarly, plasma Orm levels were also found to be elevated in obese and/or diabetic human patients (Fig. 1F and supplemental Fig. S3). On measuring the Orm expression in the diet-induced obese (DIO) mice, Orm mRNA expression in epididymal fat tissue elevated selectively and rapidly upon high fat diet (HFD) (Fig. 2). The Orm induction was exaggerated at 3 months of HFD (data not shown). Thus, it appears that adipose Orm would respond to metabolic changes and/or stresses more sensitively than liver Orm in obese and/or diabetic mice.
FIGURE 2.
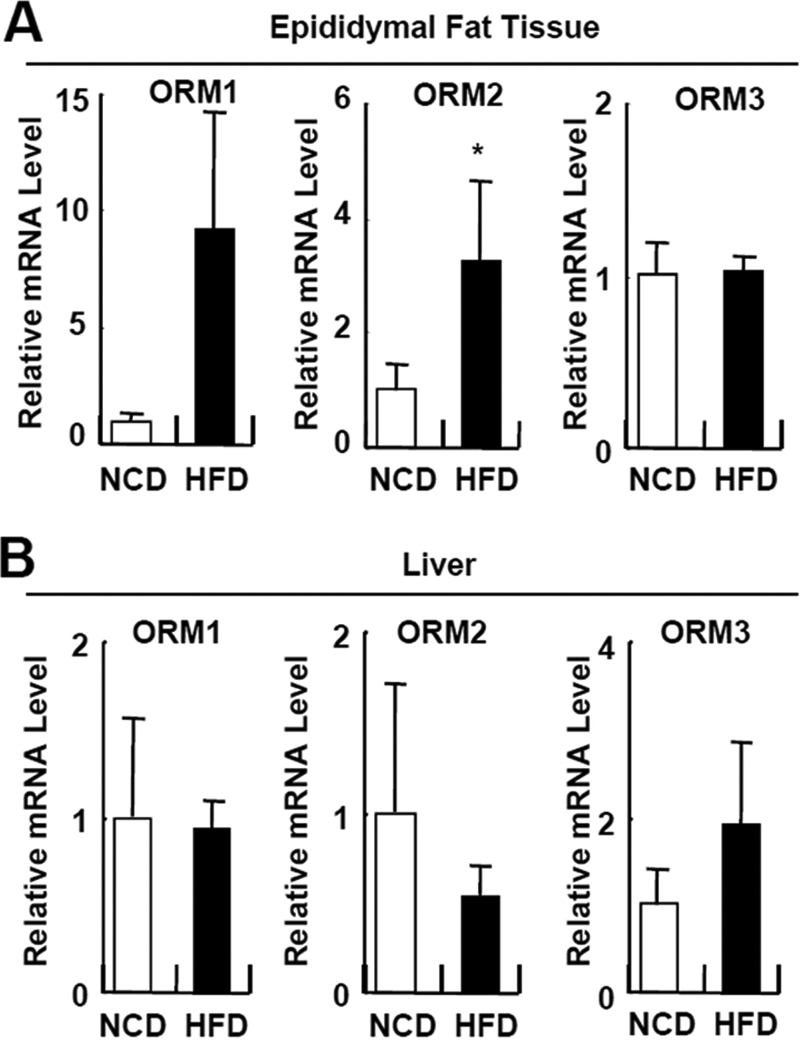
Orm is induced selectively in adipose tissue upon HFD feeding. Q-PCR analysis of Orm expression in the epididymal adipose tissue (A) and liver (B) of C57BL6 mice fed with a normal chow diet (NCD; day 0) or HFD for 7 days. *, p < 0.05. n = 4 or 10.
Orm Is Induced by Both Inflammatory and Metabolic Signals in Adipocytes
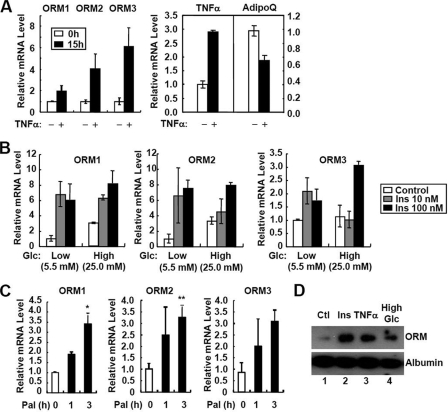
Abnormal regulation of adipocyte-specific gene expression in obese subjects is associated with proinflammatory signals and elevated metabolic stresses in the adipose tissue. To test whether Orm induction in the adipose tissue of obese mice is related to those signals, we treated 3T3-L1 adipocytes with TNFα, insulin, palmitate (an FFA), or high glucose. As illustrated in Fig. 3, A–C, the three Orm isoforms were induced by TNFα, insulin, palmitate, and high glucose challenges. Accordingly, ORM protein secretion from adipocytes was markedly promoted by those stimuli (Fig. 3D). Thus, it appears that adipose Orm expression is sensitively up-regulated by proinflammatory and metabolic signals raised in the adipose tissues of obese and/or diabetic mice. Interestingly, the expression of adipose ORM remained unaltered when LPS was injected into lean mice, although there was potent induction of liver and plasma ORM levels (supplemental Fig. S4), suggesting that adipose Orm is more sensitive to metabolic stresses rather than acute systemic inflammation by LPS.
FIGURE 3.
Orm is induced by both proinflammatory and metabolic signals. A, TNFα induces the three Orm isoforms in 3T3-L1 adipocytes. Differentiated adipocytes were treated with TNFα (10 ng/ml) for 15 h. mRNA levels of each isoform of Orm, TNFα, and adiponectin (AdipoQ) were analyzed by Q-PCR. mRNA levels of TNFα and adiponectin (AdipoQ) were used as controls for the effect of TNFα. B, metabolic signals induce the three Orm isoforms. Differentiated adipocytes were preincubated in low glucose (Glc; 5.5 mm) media for 24 h and then treated with a series of concentrations of insulin (10 or 100 nm) in the presence or absence of high glucose (Glc; 25 mm) challenge. C, effect of palmitate (Pal; 500 μm) on Orm mRNA expression in 3T3-L1 adipocytes. D, secretion of ORM is promoted by metabolic and inflammatory signals in adipocytes. Differentiated adipocytes were preincubated in low glucose (Glc; 5.5 mm) containing DMEM supplemented with 0.2% bovine serum albumin. After 24 h, culture media were chased with fresh media, and the cells were treated with insulin (Ins; 100 nm), TNFα (10 ng/ml) or high glucose (25 mm) for additional 24 h. Secretion of ORM was evaluated by Western blot analysis with the cell-conditioned media. Ctl, control.
ADD1/SREBP1c and C/EBP Regulate Orm1 Expression
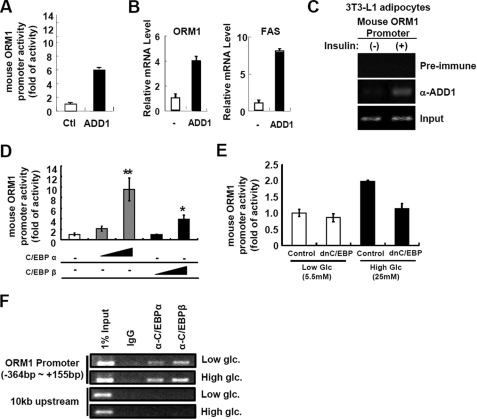
To investigate which transcription factors are involved in the regulation of Orm1 expression in response to the metabolic signals, we analyzed the mouse Orm1 promoter and found putative binding sites for ADD1/SREBP1c and C/EBP transcription factors. Previously, it is well known that ADD1/SREBP1c mediates insulin-dependent gene expression (24), while C/EBPs could mediate high glucose-activated gene expression (26). To examine whether the Orm1 promoter is regulated by ADD1/SREBP1c, we performed luciferase reporter assays using Orm1 promoter luciferase in the presence or absence of ADD1/SREBP1c. As shown in Fig. 4A, Orm1 promoter activity was enhanced by ADD1/SREBP1c overexpression. Moreover, adenoviral overexpression of ADD1/SREBP1c in adipocytes stimulated the expression of Orm1 mRNA (Fig. 4B). Furthermore, chromatin immunoprecipitation assays revealed that binding of ADD1/SREBP1c to the Orm1 promoter was increased by insulin treatment (Fig. 4C), indicating that ADD1/SREBP1c could mediate insulin-dependent Orm1 expression in adipocytes. Consistent with these results, Orm1 expression in adipose tissue was regulated by nutritional conditions, such as fasting and refeeding, where ADD1/SREBP1c expression is regulated (supplemental Fig. S5).
FIGURE 4.
ADD1/SREBP1c and C/EBPs up-regulate Orm1 promoter activity in adipocytes. A, Orm1 promoter activity is enhanced by ADD1/SREBP1c. h293 cells were co-transfected with luciferase reporter containing Orm1 promoter and β-galactosidase DNA with or without ADD1/SREBP1c (ADD1; 100 ng) expression plasmid. 24 h after transfection, cells were harvested. Luciferase activities were measured and normalized by β-galactosidase activity. Ctl, control. B, in adipocytes, expression of Orm1 mRNA is stimulated by ADD1/SREBP1c. 3T3-L1 adipocytes were infected with mock (−) or ADD1/SREBP1c (ADD1) expressing adenovirus. 36 h after adenoviral infection, cells were harvested and subjected to Q-PCR analysis. FAS, fatty-acid synthase. C, insulin augments binding of ADD1/SREBP1c to the Orm1 promoter. 3T3-L1 adipocytes were incubated with or without insulin (100 nm) for 24 h and subjected to chromatin immunoprecipitation with preimmune serum or anti-ADD1/SREBP1c antibody. D, Orm1 promoter activity is stimulated by C/EBPα and C/EBPβ. h293 cells were co-transfected with luciferase reporter containing the Orm1 promoter and β-galactosidase DNA with or without C/EBPα (10 and 100 ng) or C/EBPβ (10 and 100 ng) expression plasmid. 24 h after transfection, cells were harvested. Luciferase activities were measured and normalized by β-galactosidase activity. *, p < 0.05; **, p < 0.01. E, high glucose-induced Orm1 promoter activity is suppressed by dominant negative C/EBP (dnC/EBP). h293 cells were co-transfected with the Orm1 promoter luciferase reporter and β-galactosidase with or without dominant negative C/EBPβ (500 ng) expression plasmid. 12 h after transfection, cells were incubated in low (5.5 mm) or high glucose (25 mm) media for additional 24 h and subjected to luciferase activity assays. F, high glucose condition promotes binding of C/EBPα and C/EBPβ to the Orm1 promoter in adipocytes. 3T3-L1 adipocytes were incubated in low (5.5 mm) and high glucose (25 mm) conditions for 24 h and subjected to chromatin immunoprecipitation assays using anti-C/EBPα or anti-C/EBPβ antibodies.
We also investigated whether C/EBP transcription factors are involved in Orm1 gene expression. Luciferase reporter assays demonstrated that C/EBPα and C/EBPβ stimulated Orm1 promoter activity (Fig. 4D), whereas dominant negative C/EBP abolished high glucose-induced Orm1 promoter activity (Fig. 4E). Furthermore, in adipocytes, binding of C/EBP transcription factors to the Orm1 promoter was augmented by high glucose conditions (Fig. 4F). Together, these data indicate that ADD1/SREBP1c and C/EBPs would mediate insulin- and high glucose-dependent regulation of Orm1 mRNA expression in adipocytes.
Orm Suppresses Inflammatory Activation of Adipocytes and Monocytes/Macrophages
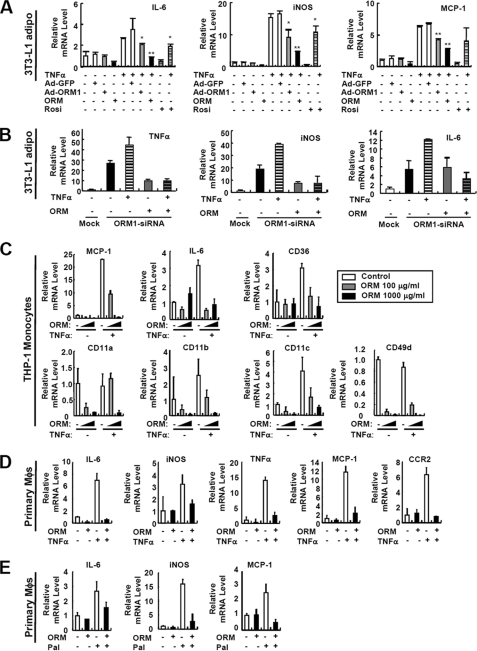
In obesity, adipose tissue inflammation is involved in not only the induction of inflammatory gene expression in adipocytes but also the increase of recruitment, adhesion, and activation of monocytes/macrophages, eventually augmenting local inflammation to perturb adipocyte homeostasis. To investigate the role of ORM in the adipose tissue, we tested the effect of ORM in both adipocytes and monocytes/macrophages in the presence or absence of inflammatory stimulus with TNFα, which induces Orm expression. When ORM levels were elevated either by treatment with the ORM protein or by infection with the Orm1 adenovirus, the TNFα-induced expression of proinflammatory genes, namely IL-6, iNOS, and MCP-1, was diminished in 3T3-L1 adipocytes (Fig. 5A) and mouse primary fat cells (data not shown). On the other hand, knockdown of Orm1 promoted both basal and TNFα-induced expression of proinflammatory genes in adipocytes, which was prevented by ORM protein treatment (Fig. 5B) (supplemental Fig. S6). Similarly, in THP-1 monocytes and mouse intraperitoneal macrophages, increased ORM levels down-regulated the expression of proinflammatory genes in the presence of TNFα (Fig. 5, C and D). Furthermore, ORM abrogated basal and TNFα-dependent expression of adhesion molecules such as CD11a, CD11b, CD11c, and CD49d in THP-1 monocytes, which might be required for the adhesion and recruitment of monocytes into the adipose tissue (Fig. 5C). Additionally, ORM reduced FFA (palmitate)-induced activation of inflammatory gene expression in primary macrophages (Fig. 5E), indicating that ORM is capable of suppressing inflammatory responses by nullifying a loop of reciprocal activation between adipocytes and macrophages. These data suggest that proinflammatory and metabolic stress-induced Orm expression might constrain excess inflammatory responses in both adipocytes and monocytes/macrophages to restrain further inflammatory responses in the adipose tissue.
FIGURE 5.
ORM suppresses inflammatory gene expression in adipocytes, monocytes, and macrophages. A, effect of ORM treatment and adenoviral overexpression of Orm1 in TNFα-induced inflammatory gene expression in 3T3-L1 adipocytes. Adenovirus-infected (50 multiplicities of infection, 2 days postinfection) or noninfected adipocytes were incubated with TNFα (10 ng/ml) in the presence or absence of ORM (250 μg/ml). Dose of ORM treatment was determined according to the circulating ORM level in normal mice. mRNA levels of inflammatory genes were analyzed by Q-PCR analysis. *, p < 0.05; **, p < 0.01. n = 2 or 3. iNOS, inducible nitric-oxide synthase; Rosi, rosiglitazone; IL-6, interleukin 6. B, knockdown of Orm1 induces inflammatory gene expression in 3T3-L1 adipocytes. 3T3-L1 stable cell lines overexpressing mock or mouse Orm1-specific siRNA were established by retroviral infection and following selection with puromycin. At day 7 of adipocyte differentiation, the cells were treated with TNFα (10 ng/ml) and/or ORM (250 μg/ml) for 24 h. mRNA levels of inflammatory genes were measured by Q-PCR analysis. C, ORM suppresses the expression of certain genes involved in inflammation and cell adhesion in THP-1 monocytes. THP-1 monocytes were incubated with TNFα (10 ng/ml) in the presence or absence of ORM (100 or 1000 μg/ml) for 6 h. mRNA levels of inflammatory genes were analyzed by Q-PCR analysis. D, ORM (250 μg/ml) suppresses TNFα-induced inflammatory gene expression in mouse peritoneal macrophages (Mϕs). E, ORM (250 μg/ml) suppresses palmitate (Pal)-induced inflammatory gene expression in mouse peritoneal macrophages.
ORM Reduces Recruitment of Macrophages to Adipocytes
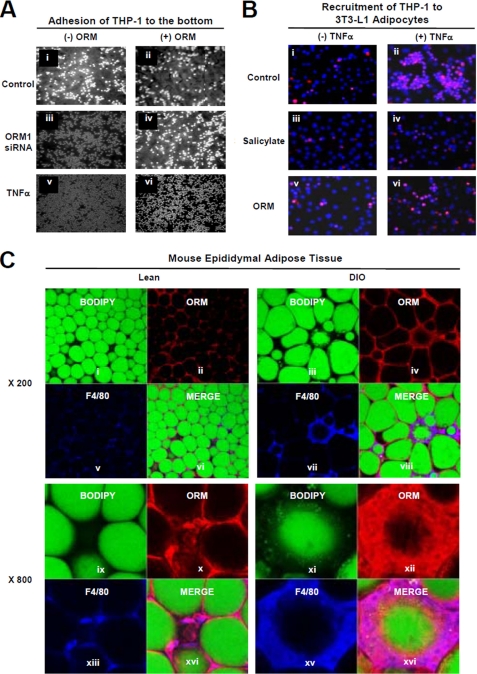
In obese subjects, elevated proinflammatory cytokines and chemokines from adipocytes play critical roles in triggering macrophage infiltration into the adipose tissue, which requires acquisition of the adhesive property of monocytes/macrophages (11). To investigate whether ORM could affect the physical interaction between adipocytes and monocytes/macrophages, we tested the effect of adipocyte-conditioned media expressing mock or Orm1 siRNA on monocyte adhesion. Compared with the control, the incubation of THP-1 monocytes with adipocyte-conditioned media expressing Orm1 siRNA enhanced the adhesion of the cells to the bottoms of the cell culture dishes (Fig. 6A, panels i versus iii). However, pretreatment of the adipocytes with ORM attenuated monocyte attachment to the bottom of the culture dishes under the same condition (Fig. 6A, panels iii versus iv). Moreover, monocyte adhesion induced by TNFα-treated adipocyte-conditioned media was reduced by ORM pretreatment (Fig. 6A, panels v versus vi). Next, to examine whether ORM affects the recruitment of monocytes to adipocytes, we co-cultured 3T3-L1 adipocytes (lower chamber) and THP-1 monocytes (upper chamber) in Transwell plates and investigated the recruitment and adhesion of THP-1 to adipocytes in the presence or absence of TNFα, salicylate, or ORM. Consistent with previous reports (27, 28), we found that TNFα increased the recruitment and adhesion of monocytes to the adipocytes (Fig. 6B, panels i versus ii), which was suppressed by salicylate treatment (Fig. 6B, panels ii versus iv). ORM, like salicylate, greatly suppressed the TNFα-induced increase in the recruitment of monocytes to adipocytes (Fig. 6B, panels ii versus vi), suggesting that ORM would prohibit physical interaction between adipocytes and macrophages upon encountering inflammatory signals.
FIGURE 6.
ORM reduces interaction between adipocytes and macrophages. A, ORM suppresses the effect of adipocyte-conditioned media on adhesion of THP-1 monocytes to the bottom of culture dishes. Adipocyte-conditioned media were obtained from mock or Orm1 siRNA overexpressing 3T3-L1 adipocytes in the presence or absence of ORM (250 μg/ml) or TNFα (10 ng/ml) for 24 h. The adhesion of the THP-1 monocytes onto the bottom of the culture dish was photographed after incubating the cells in the adipocyte-conditioned media and washing them three times with PBS. B, ORM suppresses the recruitment of THP-1 monocytes to adipocytes. 3T3-L1 adipocytes and THP-1 monocytes were pretreated with or without ORM (250 μg/ml) or sodium salicylate (5 mm) for 24 h, and then the THP-1 monocytes were added to the upper chamber of the Transwell plates that contained the adipocytes and stimulated with TNFα. The recruitment of THP-1 cells to adipocytes was measured by immunostaining monocytes with an anti-CD68 antibody (red). C, ORM binds to macrophages in the adipose tissue. Epididymal adipose tissues from the lean (control) or DIO (fed HFD for 3 months) mice were immunostained with fluorescein isothiocyanate-conjugated BODIPY (green; adipocytes) or antibodies against ORM (red) or F4/80 (blue; macrophages) and whole-mounted for multiphoton fluorescence confocal microscopy.
Because most circulating signaling molecules attach to the surface of the target cells to exert their signaling cascades, we hypothesized that ORM might bind to the surface of macrophages in the adipose tissue if ORM is actively involved in the regulation of macrophage-mediated inflammatory responses in the adipose tissue. To determine this in vivo, we performed whole-mount immunohistochemistry with epididymal white adipose tissue of lean and DIO mice. The highest Orm expression (red) was detected around lipid droplets (BODIPY-positive, green) in the adipose tissue, indicating that ORM was expressed in unilocular adipocytes (Fig. 6C). Moreover, the ORM signal was higher in the adipose tissue of DIO mice than in that of lean mice, confirming that Orm expression is greater in the adipose tissue of obese mice. Interestingly, high ORM levels were frequently observed around nonvascular stromal cells (PECAM-negative), including F4/80-positive macrophages, with the formation of crown-like structures, especially around dead adipocytes (Fig. 6C and supplemental Fig. S7). These data propose that ORM might suppress inflammatory responses in adipose tissue probably by suppressing the interaction between adipocytes and macrophages.
ORM Stimulates Insulin Action in Adipocytes
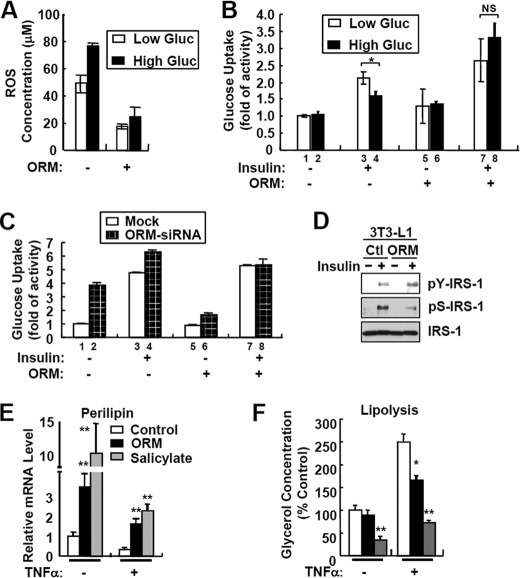
Elevated inflammatory responses with chronic metabolic stresses in the adipose tissue disturb normal lipid and glucose metabolism, at least in part, through ROS generation (13, 29, 30). To assess whether the anti-inflammatory activity of ORM influences glucose metabolism, we examined the effect of ORM on high glucose-induced ROS generation and insulin resistance in 3T3-L1 adipocytes. Consistent with previous reports (13), hyperglycemia elevated ROS generation (Fig. 7A) and suppressed insulin-stimulated glucose uptake activity by ∼45% (Fig. 7B, lane 3 versus lane 4). In contrast, ORM treatment markedly reduced hyperglycemia-induced ROS generation (Fig. 7A) and improved insulin sensitivity (Fig. 7B, lane 7 versus lane 8). Furthermore, ORM suppressed LPS-induced ROS generation from THP-1 monocytes and RAW264.7 macrophages as in adipocytes (supplemental Fig. S8). On the other hand, suppression of Orm1 via siRNA in adipocytes significantly disrupted insulin-stimulated glucose uptake activity (Fig. 7C, ratio between lanes 1 and 3 versus lanes 2 and 4), which was restored by ORM treatment (Fig. 7C, ratio between lanes 5 and 7 versus lanes 6 and 8). Consistent with these results, ORM accelerated insulin-stimulated tyrosine phosphorylation at IRS-1, although it decreased serine phosphorylation at IRS-1 (Fig. 7D), suggesting that ORM would stimulate insulin signaling in adipocytes.
FIGURE 7.
ORM improves energy metabolism in adipocytes. A, 3T3-L1 adipocytes were incubated with low (5.5 mm) or high (25 mm) glucose (Gluc) media in the presence or absence of ORM (250 μg/ml) for 24 h. The levels of the accumulated ROS in adipocytes were measured by 5-(and -6)-chloromethyl-2′m7′-dichlorodihydrofluorescein diacetate, acetyl ester (CM-H2DCFDA) fluorescence staining. B, basal and insulin-dependent glucose uptake activity assay. 3T3-L1 adipocytes were incubated with low (5.5 mm) or high (25 mm) glucose media in the presence or absence of ORM (250 μg/ml) for 24 h. Glucose uptake activity was measured at 30 min after the insulin treatment. NS, not significant. C, suppression of Orm1 expression via siRNA impairs insulin sensitivity in adipocytes. 3T3-L1 cells stably expressing empty pSuper.retro (mock) or pSuper.retro-Orm1siRNA were differentiated into adipocytes. Mature adipocytes expressing mock or Orm1 siRNA were incubated with or without ORM (250 μg/ml) for 24 h. Glucose uptake activity was measured at 30 min after insulin treatment. D, ORM potentiates insulin signaling. 3T3-L1 adipocytes were serum-starved for 16 h in hyperglycemic condition (25 mm) and then treated with ORM (250 μg/ml) for 6 h. After 15 min of stimulation with insulin (10 nm), the cells were subjected to Western blot analysis. Ctl, control. E and F, 3T3-L1 adipocytes were pretreated with ORM (250 μg/ml, black bar) or sodium salicylate (5 mm, gray bar) in DMEM supplemented with 0.2% bovine serum albumin and then stimulated with TNFα (10 ng/ml) for a further 48 h. mRNA levels of perilipin were measured by Q-PCR analysis (E). Levels of lipolysis were determined by measuring glycerol concentration in the adipocyte-conditioned media (F). *, p < 0.05; **, p < 0.01. n = 3.
It has been reported that TNFα induces lipolysis and facilitates the release of FFAs by suppressing perilipin expression and augmenting hormone-sensitive lipase activity (5, 6, 31), which are repressed by an anti-inflammatory drug, salicylate (32). To test whether ORM delays TNFα-induced lipolysis in adipocytes, we examined the levels of perilipin mRNA and lipolysis after ORM treatment. As reported previously (32), the administration of salicylate reversed the effects of TNFα on perilipin expression and glycerol release (Fig. 7, E and F). Similarly, ORM repressed TNFα-induced lipolysis with sustained perilipin expression (Fig. 7, E and F). These results suggest that ORM would attenuate dysregulation of glucose and lipid homeostasis, which is mediated by chronic accumulation of inflammatory and metabolic stresses in the adipose tissue.
ORM Suppresses TNFα-induced Activation of NF-κB and MAPKs in Adipocytes and Macrophages
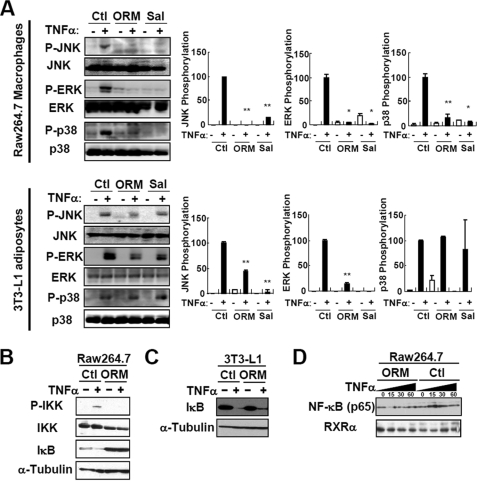
Accumulating evidence indicates that proinflammatory responses of macrophages are largely mediated by activation of IκB kinase (IKK)/NF-κB and/or MAPKs (e.g. JNK, ERK, and p38 MAPK) pathways. In adipocytes, activation of either the IKK/NF-κB or MAPKs pathways by TNFα has been implicated in the dysregulation of lipid and glucose metabolism as well as proinflammatory responses (2–6). Because ORM suppressed TNFα-induced inflammatory gene expression in adipocytes and macrophages (Fig. 5), we examined whether ORM alters TNFα-induced phosphorylation/activation of MAPKs and IKK pathways in those cells. In both RAW264.7 macrophages and 3T3-L1 adipocytes, ORM, like salicylate, potently blunted TNFα-dependent activation of JNK and ERK (Fig. 8A). However, unlike JNK and ERK, ORM efficiently repressed p38 MAPK in macrophages but not in adipocytes. Moreover, phosphorylation/activation of IKK, subsequent degradation of IκB, and nuclear accumulation of NF-κB by TNFα were abolished by ORM treatment (Fig. 8, B–D), suggesting that the anti-inflammatory activity of ORM is associated with the suppression of both IKK/NF-κB and MAPK activation.
FIGURE 8.
ORM suppresses MAPK and NF-κB activation in macrophages and adipocytes. A, RAW264.7 macrophages or 3T3-L1 adipocytes were pretreated with a vehicle, ORM (250 μg/ml), or sodium salicylate (Sal) (5 mm) for 6 h and then stimulated by TNFα (10 ng/ml) for a further 10 min. The levels of the phosphorylated and total MAPK proteins were measured by Western blot analysis. The results are representatives of at least three independent experiments. Ctl, control; *, p < 0.05; **, p < 0.01. n = 3. B and C, ORM suppresses IKK activation in macrophages (B) and adipocytes (C). D, ORM suppresses nuclear accumulation of NF-κB (p65) in macrophages. RAW264.7 macrophages were pretreated with a vehicle (ORM (250 μg/ml)) for 6 h, and then stimulated by TNFα (10 ng/ml) for a further 15, 30, or 60 min. The nuclear extract was prepared from the cells, and the protein level of p65 NF-κB was measured by Western blot analysis. RXRα, retinoid X receptor α.
ORM Ameliorates Systemic Insulin Resistance
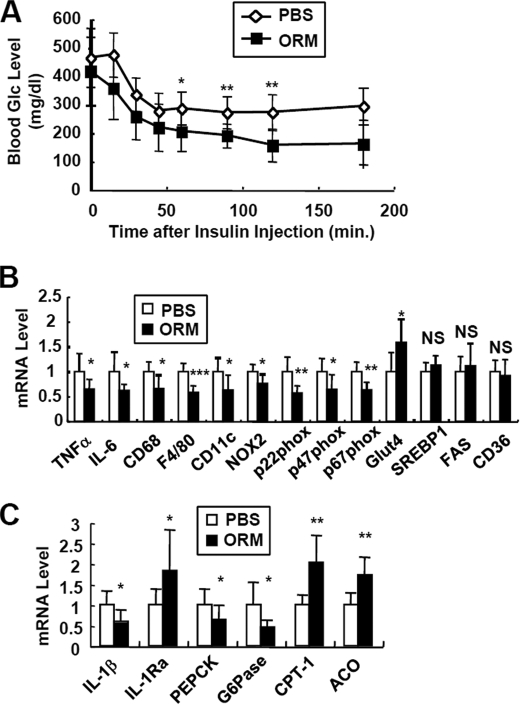
To confirm whether ORM suppresses inflammatory gene expression and ameliorates insulin resistance in vivo, we administered ORM into obese and diabetic db/db mice. To increase the level of circulating ORM at a constant rate without periodic fluctuations caused by daily injections, we adopted an autonomous osmotic pump system to sustain the ORM level (347 ng/min) (supplemental Fig. S9). Then we performed insulin tolerance assays after 2 weeks of transplantation to avoid artifacts from the activation of endogenous Orm after surgery and to stabilize the release of exogenous ORM from the pump. As shown in Fig. 9A, ORM substantially improved insulin tolerance in the db/db mice without any significant change in body weight. Likewise, adenoviral overexpression of Orm1 also improved glucose metabolism in db/db mice (supplemental Fig. S10). Furthermore, in addition to being consistent with the in vitro results (Fig. 5), ORM treatment in the db/db mice reduced the expression of inflammatory cytokine genes (TNFα and IL-6) and pro-oxidative genes (NOX2, p22Phox, p47Phox, and p67Phox) in the adipose tissue, which was concurrent with the reduced macrophage marker gene expression such as F4/80 and CD11c (Fig. 9B). On the other hand, ORM increased the expression of the insulin-sensitive glucose transporter, Glut4, in the adipose tissue (Fig. 9B). These results suggest that ORM could improve insulin resistance by suppressing the activation and/or recruitment of macrophages in adipose tissue in vivo. Interestingly, in the liver, elevated ORM suppressed the expression of gluconeogenic genes (PEPCK and Glc-6-Pase) and stimulated that of fatty acid oxidative genes (CPT-1 and ACO) (Fig. 9C); these effects might contribute to restoring glucose and lipid metabolism. Our data suggest that increased plasma ORM recovers energy homeostasis by limiting inflammatory responses in insulin-sensitive tissues.
FIGURE 9.
In vivo effects of ORM in the obese and diabetic db/db mice. PBS (◇)-containing or ORM protein (■)-containing osmotic pumps were implanted in the db/db mice. The pumps released 0.34 μg/min purified ORM protein, which elevated the level of ORM up to 2-fold that of endogenous ORM. After 2 weeks, the mice were subjected to further analyses. A, insulin tolerance test. B, mRNA levels of inflammatory genes in epididymal adipose tissue of db/db mice with or without ORM treatment were measured by Q-PCR analysis. *, p < 0.05; **, p < 0.01; ***, p < 0.001. n = 6 or 8. NS, not significant; FAS, fatty-acid synthase. C, Q-PCR analysis of inflammatory and metabolic genes in the liver of the above mice. ACO, acyl-CoA oxidase. *, p < 0.05; **, p < 0.01. n = 6 or 8.
DISCUSSION
Inflammation is a highly controlled process that is coordinated by maintaining a balance between pro- and anti-inflammatory activities (33). Insulted tissues generate not only proinflammatory cytokines but also anti-inflammatory molecules to resolve local and systemic inflammation (34). Accordingly, inflamed adipose tissue in obese animal models exhibits increased expression of several anti-inflammatory molecules such as IL-10, IL-1Ra, and stamp2 as well as proinflammatory cytokines to counterbalance the proinflammatory events (35, 36). However, the regulatory mechanisms and the roles of the anti-inflammatory molecules following changes of energy balance in the adipose tissue are poorly understood. Nonetheless, it has recently been shown that the knock-out of stamp2, an adipocyte-specific anti-inflammatory molecule induced by proinflammatory signals, elevates inflammatory gene expression and macrophage infiltration in the adipose tissue and also triggers metabolic diseases (36), suggesting that innate anti-inflammatory or pro-resolving activity of adipose tissue would be critical for maintaining energy homeostasis.
In this study, we observed that the adipose tissue secretes another anti-inflammatory molecule, ORM, to restrain and/or resolve excessive inflammation. Notably, ORM was produced mainly from metabolic cell types such as adipocytes and hepatocytes in response to both metabolic and inflammatory stimuli, whereas other anti-inflammatory cytokines such as IL-10 were produced mainly from immune cells in response to inflammatory signals (37). Moreover, we observed that ORM was regulated by nutritional signals such as fasting and refeeding in the adipose tissue (supplemental Fig. S5). Given that metabolic stresses upon excessive nutritional status have the potential to regulate proinflammatory pathways (9), ORM is likely to be a specialized secretory factor with an anti-inflammatory activity for balancing metabolic homeostasis by controlling immune responses against daily fluctuations of the circulating nutrient levels in both metabolic and immune cells.
Surprisingly, Orm expression was elevated selectively in the adipose tissue with increasing plasma ORM levels in obese mice. Adipose Orm expression was augmented rapidly upon HFD (within a week) but not by acute inflammation with LPS injection, although liver Orm was not induced by HFD but by LPS (Fig. 2 and supplemental Fig. S4). These results suggest that adipose Orm, in contrast to liver Orm, is modulated by distinct mechanisms upon pathophysiological conditions. Thus, the question arises as to what decides the selectivity in the induction of Orm in the fat tissue of obese mice. It is possible to speculate that differential sensitivities to metabolic changes in the adipose tissue and liver may confer differential tissue expression of Orm. Recently, we observed that inflammatory gene expression was very rapidly modulated by HFD prominently in the abdominal adipose tissue rather than in the liver or muscle, whereas LPS induced inflammatory genes notably in the liver rather than in the adipose tissue.4 Therefore, it is likely that the adipose tissue preferentially recognizes and responds to metabolic changes, although the liver is more sensitive to acute and strong signals of infection to promote inflammatory genes. However, it remains to be elucidated whether hepatic and adipose ORM have distinct roles in the regulation of systemic inflammation and/or whole body energy metabolism.
Recent evidence suggests that adipose tissue inflammation initiated by metabolic changes in obese subjects could be propagated by reciprocal stimulation between adipocytes and macrophages (4, 9, 11). Interestingly, ORM reduced inflammation in the adipose tissue by suppressing the interaction between adipocytes and macrophages. Pretreatment of adipocytes with ORM suppressed monocyte adhesion induced by adipocyte-conditioned media (Fig. 6A). Moreover, the co-culture experiments performed with Transwell plates revealed that ORM reduces the recruitment of THP-1 monocytes to the adipocytes (Fig. 6B), implying that the ORM secretion from adipocytes would alter the immune response in adipose tissue by appropriately regulating the interaction between adipocytes and macrophages to decrease the inflammatory response. Accordingly, administration of purified ORM protein into obese db/db mice substantially reduced the expression of the macrophage marker genes in the adipose tissue with diminished proinflammatory gene expression (Fig. 9).
It should be noted that ORM suppressed TNFα-induced inflammatory gene expression and ROS generation with the suppression of IKK/NF-κB and MAPK pathways in adipocytes and macrophages (Figs. 5, 7, and 8 and supplemental Fig. S8). Metabolically stressful conditions such as high levels of TNFα, insulin, glucose, and/or FFAs in the plasma of obese subjects stimulate proinflammatory gene expression and ROS generation in adipocytes by activating JNK and ERK in the NF-κB and MAPK pathways, thereby propagating dysregulation of adipocytokines and insulin action in morbidly obese subjects (5, 6, 13, 30, 31, 38, 39). For example, JNK triggers insulin resistance via several mechanisms, including accelerating insulin receptor substrate serine phosphorylation (40). Moreover, ERK activation in adipocytes by TNFα promotes lipolysis to release FFAs (5, 6, 31), which triggers the production of more proinflammatory cytokines in adipocytes and macrophages. Thus, it is plausible that the inhibition of proinflammatory gene expression and ROS generation by the suppression of NF-κB and MAPK by ORM in adipocytes would be beneficial in preventing severe inflammation and the subsequent disturbance in the whole body glucose and lipid metabolism. We observed that ORM in adipocytes relieved high glucose-induced insulin resistance and TNFα-induced lipolysis, in concurrence with suppression of TNFα-induced NF-κB and MAPK activation (Figs. 7 and 8). Moreover, increased ORM levels in circulation improved insulin tolerance with the suppression of proinflammatory and pro-oxidative gene expression in the adipose tissues of obese and diabetic db/db mice (Fig. 9).
However, the mechanism of how ORM affects immune responses in macrophages and adipocytes still needs to be elucidated. Several lines of evidence propose that ORM might bind to the macrophages through receptor-mediated interactions with cell surface proteins such as CCR5 and Siglec5 (41, 42), which are expressed in both adipocytes and macrophages (supplemental Fig. S11). Moreover, although not direct evidence, our immunohistochemistry data reveal that ORM appears to interact with macrophages in the adipose tissue. Because SVCs from the adipose tissue and intraperitoneal macrophages exhibited quite low levels of Orm mRNA expression (at least <1/20-fold of its level in adipocytes) (Fig. 1B and supplemental Fig. S2), it is unlikely that ORM proteins are derived from the macrophages. Rather, it appears that ORM secreted from adipocytes might bind to the surface of macrophages as a means to exert its function in inflamed adipose tissue. Thus, it is likely that ORM might transmit anti-inflammatory signals through the cell surface receptor-mediated signaling cascades through its receptor(s). Consistent with this, recently we observed that knockdown of Siglec-e, the mouse homolog of human Siglec-5, suppressed ORM-mediated suppression of inflammatory gene expression in macrophages.4 However, we cannot rule out the possibility that ORM might exert its anti-inflammatory property by controlling the stability or availability of lipid molecules in the plasma and peripheral tissues, because ORM has been shown to interact with proinflammatory lipid molecules such as FFAs and lysophosphatidylcholine as well as anti-inflammatory molecules such as biliverdin and steroid hormones (21, 22).
Here, we present the first evidence that Orm is induced in the adipose tissue of obese mice to maintain metabolic homeostasis by suppressing local and systemic inflammation. Because Orm was induced as a response to metabolic changes and eventually contributed to improving insulin tolerance in obese mice, it appears that Orm would be a potential therapeutic target for treating insulin resistance and metabolic disorders. Nevertheless, an obvious key question that needs to be addressed is why inflammatory signals are chronically accumulated despite increased Orm expression in the plasma and adipose tissue of the obese mice. Given the fact that acute ORM injections provide resistance against TNFα-induced lethality (18), whereas ORM transgenic mice still show sensitivity to TNFα (43), it is likely that chronic increase of ORM might cause ORM resistance. Additionally, we cannot exclude the possibility that a chronic increase in Orm expression in circulation might play unwanted roles in affecting metabolic complications in obese subjects. Indeed, it has been recently reported that ORM interacts with PAI-1 to recruit prothrombotic activity to atherosclerotic lesions (44). Thus, further studies are required to explain the persistence of elevated inflammatory responses despite the induced expression of Orm in obese mice and to address the role of increased levels of Orm expression in obesity-related metabolic complications and cardiovascular diseases, emphasizing the importance of analyzing conditional Orm gene knock-out mice.
Supplementary Material
Acknowledgments
We thank Dr. Muhammad Azhar Chishti and Shahid Nawaz for their help in performing enzyme-linked immunosorbent assay on human samples.
This work was supported in part by grants from the Korea Science and Engineering Foundation, Korean Research Foundation Grants SC-3230, 20090083340, and 20090091913 funded by the Ministry of Education, Science and Technology, and by the National Plan of Science and Technology, King Abdulaziz City of Science and Technology, Riyadh, Saudi Arabia.

The on-line version of this article (available at http://www.jbc.org) contains supplemental Figs. S1–S11.
Y. S. Lee and J. B. Kim, unpublished data.
- TNFα
- tumor necrosis factor-α
- ORM
- orosomucoid
- MAPK
- mitogen-activated protein kinase
- DMEM
- Dulbecco's modified Eagle's medium
- PBS
- phosphate-buffered saline
- Q-PCR
- quantitative PCR
- siRNA
- small interfering RNA
- JNK
- c-Jun N-terminal kinase
- ROS
- reactive oxygen species
- ERK
- extracellular signal-regulated kinase
- SVC
- stromal vascular cell
- TRITC
- tetramethylrhodamine isothiocyanate
- IKK
- IκB kinase
- FFA
- free fatty acid
- LPS
- lipopolysaccharide
- HFD
- high fat diet
- DIO
- diet-induced obese
- IL
- interleukin.
REFERENCES
- 1.Lusis A. J. (2000) Nature 407, 233–241 [DOI] [PMC free article] [PubMed] [Google Scholar]
- 2.Hotamisligil G. S. (2006) Nature 444, 860–867 [DOI] [PubMed] [Google Scholar]
- 3.Hotamisligil G. S., Shargill N. S., Spiegelman B. M. (1993) Science 259, 87–91 [DOI] [PubMed] [Google Scholar]
- 4.Suganami T., Tanimoto-Koyama K., Nishida J., Itoh M., Yuan X., Mizuarai S., Kotani H., Yamaoka S., Miyake K., Aoe S., Kamei Y., Ogawa Y. (2007) Arterioscler. Thromb. Vasc. Biol. 27, 84–91 [DOI] [PubMed] [Google Scholar]
- 5.Zhang H. H., Halbleib M., Ahmad F., Manganiello V. C., Greenberg A. S. (2002) Diabetes 51, 2929–2935 [DOI] [PubMed] [Google Scholar]
- 6.Souza S. C., Palmer H. J., Kang Y. H., Yamamoto M. T., Muliro K. V., Paulson K. E., Greenberg A. S. (2003) J. Cell. Biochem. 89, 1077–1086 [DOI] [PubMed] [Google Scholar]
- 7.Xu H., Barnes G. T., Yang Q., Tan G., Yang D., Chou C. J., Sole J., Nichols A., Ross J. S., Tartaglia L. A., Chen H. (2003) J. Clin. Invest. 112, 1821–1830 [DOI] [PMC free article] [PubMed] [Google Scholar]
- 8.Weisberg S. P., McCann D., Desai M., Rosenbaum M., Leibel R. L., Ferrante A. W., Jr. (2003) J. Clin. Invest. 112, 1796–1808 [DOI] [PMC free article] [PubMed] [Google Scholar]
- 9.Schenk S., Saberi M., Olefsky J. M. (2008) J. Clin. Invest. 118, 2992–3002 [DOI] [PMC free article] [PubMed] [Google Scholar]
- 10.Trujillo M. E., Scherer P. E. (2006) Endocr. Rev. 27, 762–778 [DOI] [PubMed] [Google Scholar]
- 11.Kanda H., Tateya S., Tamori Y., Kotani K., Hiasa K., Kitazawa R., Kitazawa S., Miyachi H., Maeda S., Egashira K., Kasuga M. (2006) J. Clin. Invest. 116, 1494–1505 [DOI] [PMC free article] [PubMed] [Google Scholar]
- 12.Nguyen M. T., Satoh H., Favelyukis S., Babendure J. L., Imamura T., Sbodio J. I., Zalevsky J., Dahiyat B. I., Chi N. W., Olefsky J. M. (2005) J. Biol. Chem. 280, 35361–35371 [DOI] [PubMed] [Google Scholar]
- 13.Lin Y., Berg A. H., Iyengar P., Lam T. K., Giacca A., Combs T. P., Rajala M. W., Du X., Rollman B., Li W., Hawkins M., Barzilai N., Rhodes C. J., Fantus I. G., Brownlee M., Scherer P. E. (2005) J. Biol. Chem. 280, 4617–4626 [DOI] [PubMed] [Google Scholar]
- 14.Lin Y., Rajala M. W., Berger J. P., Moller D. E., Barzilai N., Scherer P. E. (2001) J. Biol. Chem. 276, 42077–42083 [DOI] [PubMed] [Google Scholar]
- 15.Fournier T., Medjoubi-N N., Porquet D. (2000) Biochim. Biophys. Acta 1482, 157–171 [DOI] [PubMed] [Google Scholar]
- 16.Hochepied T., Berger F. G., Baumann H., Libert C. (2003) Cytokine Growth Factor Rev. 14, 25–34 [DOI] [PubMed] [Google Scholar]
- 17.Schönrich G., Momburg F., Hämmerling G. J., Arnold B. (1992) Eur. J. Immunol. 22, 1687–1691 [DOI] [PubMed] [Google Scholar]
- 18.Libert C., Brouckaert P., Fiers W. (1994) J. Exp. Med. 180, 1571–1575 [DOI] [PMC free article] [PubMed] [Google Scholar]
- 19.Haraldsson B., Rippe B. (1987) Acta Physiol. Scand. 129, 127–135 [DOI] [PubMed] [Google Scholar]
- 20.Curry F. E., Rutledge J. C., Lenz J. F. (1989) Am. J. Physiol. 257, H1354–H1359 [DOI] [PubMed] [Google Scholar]
- 21.Ojala P. J., Hermansson M., Tolvanen M., Polvinen K., Hirvonen T., Impola U., Jauhiainen M., Somerharju P., Parkkinen J. (2006) Biochemistry 45, 14021–14031 [DOI] [PubMed] [Google Scholar]
- 22.Zsila F., Mády G. (2008) Biochem. Biophys. Res. Commun. 372, 503–507 [DOI] [PubMed] [Google Scholar]
- 23.Lee Y. S., Lee H. H., Park J., Yoo E. J., Glackin C. A., Choi Y. I., Jeon S. H., Seong R. H., Park S. D., Kim J. B. (2003) Nucleic Acids Res. 31, 7165–7174 [DOI] [PMC free article] [PubMed] [Google Scholar]
- 24.Lee Y. S., Sohn D. H., Han D., Lee H. W., Seong R. H., Kim J. B. (2007) Mol. Cell. Biol. 27, 438–452 [DOI] [PMC free article] [PubMed] [Google Scholar]
- 25.Lee Y. S., Kim A. Y., Choi J. W., Kim M., Yasue S., Son H. J., Masuzaki H., Park K. S., Kim J. B. (2008) Mol. Endocrinol. 22, 2176–2189 [DOI] [PMC free article] [PubMed] [Google Scholar]
- 26.Park S. K., Oh S. Y., Lee M. Y., Yoon S., Kim K. S., Kim J. W. (2004) Diabetes 53, 2757–2766 [DOI] [PubMed] [Google Scholar]
- 27.Cai D., Yuan M., Frantz D. F., Melendez P. A., Hansen L., Lee J., Shoelson S. E. (2005) Nat. Med. 11, 183–190 [DOI] [PMC free article] [PubMed] [Google Scholar]
- 28.Suganami T., Nishida J., Ogawa Y. (2005) Arterioscler. Thromb. Vasc. Biol. 25, 2062–2068 [DOI] [PubMed] [Google Scholar]
- 29.Furukawa S., Fujita T., Shimabukuro M., Iwaki M., Yamada Y., Nakajima Y., Nakayama O., Makishima M., Matsuda M., Shimomura I. (2004) J. Clin. Invest. 114, 1752–1761 [DOI] [PMC free article] [PubMed] [Google Scholar]
- 30.Houstis N., Rosen E. D., Lander E. S. (2006) Nature 440, 944–948 [DOI] [PubMed] [Google Scholar]
- 31.Souza S. C., de Vargas L. M., Yamamoto M. T., Lien P., Franciosa M. D., Moss L. G., Greenberg A. S. (1998) J. Biol. Chem. 273, 24665–24669 [DOI] [PubMed] [Google Scholar]
- 32.Zu L., Jiang H., He J., Xu C., Pu S., Liu M., Xu G. (2008) Mol. Pharmacol. 73, 215–223 [DOI] [PubMed] [Google Scholar]
- 33.Lawrence T., Willoughby D. A., Gilroy D. W. (2002) Nat. Rev. Immunol. 2, 787–795 [DOI] [PubMed] [Google Scholar]
- 34.Opal S. M., DePalo V. A. (2000) Chest 117, 1162–1172 [DOI] [PubMed] [Google Scholar]
- 35.Juge-Aubry C. E., Somm E., Pernin A., Alizadeh N., Giusti V., Dayer J. M., Meier C. A. (2005) Cytokine 29, 270–274 [DOI] [PubMed] [Google Scholar]
- 36.Wellen K. E., Fucho R., Gregor M. F., Furuhashi M., Morgan C., Lindstad T., Vaillancourt E., Gorgun C. Z., Saatcioglu F., Hotamisligil G. S. (2007) Cell 129, 537–548 [DOI] [PMC free article] [PubMed] [Google Scholar]
- 37.Lumeng C. N., Bodzin J. L., Saltiel A. R. (2007) J. Clin. Invest. 117, 175–184 [DOI] [PMC free article] [PubMed] [Google Scholar]
- 38.Ge X., Yu Q., Qi W., Shi X., Zhai Q. (2008) Free Radic. Res. 42, 582–591 [DOI] [PubMed] [Google Scholar]
- 39.Hotamisligil G. S. (2005) Diabetes 54, S73–S78 [DOI] [PubMed] [Google Scholar]
- 40.Aguirre V., Uchida T., Yenush L., Davis R., White M. F. (2000) J. Biol. Chem. 275, 9047–9054 [DOI] [PubMed] [Google Scholar]
- 41.Gunnarsson P., Levander L., Påhlsson P., Grenegård M. (2007) FASEB J. 21, 4059–4069 [DOI] [PubMed] [Google Scholar]
- 42.Atemezem A., Mbemba E., Vassy R., Slimani H., Saffar L., Gattegno L. (2001) Biochem. J. 356, 121–128 [DOI] [PMC free article] [PubMed] [Google Scholar]
- 43.Libert C., Hochepied T., Berger F. G., Baumann H., Fiers W., Brouckaert P. (1998) Transgenic Res. 7, 429–435 [DOI] [PubMed] [Google Scholar]
- 44.Boncela J., Smolarczyk K., Wyroba E., Cierniewski C. S. (2006) J. Biol. Chem. 281, 1066–1072 [DOI] [PubMed] [Google Scholar]
Associated Data
This section collects any data citations, data availability statements, or supplementary materials included in this article.


