

Abstract
Mycobacterium tuberculosis (Mtb) and Rhodococcus jostii RHA1 have similar cholesterol catabolic pathways. This pathway contributes to the pathogenicity of Mtb. The hsaAB cholesterol catabolic genes have been predicted to encode the oxygenase and reductase, respectively, of a flavin-dependent mono-oxygenase that hydroxylates 3-hydroxy-9,10-seconandrost-1,3,5(10)-triene-9,17-dione (3-HSA) to a catechol. An hsaA deletion mutant of RHA1 did not grow on cholesterol but transformed the latter to 3-HSA and related metabolites in which each of the two keto groups was reduced: 3,9-dihydroxy-9,10-seconandrost-1,3,5(10)-triene-17-one (3,9-DHSA) and 3,17-dihydroxy-9,10-seconandrost-1,3,5(10)-triene-9-one (3,17-DHSA). Purified 3-hydroxy-9,10-seconandrost-1,3,5(10)-triene-9,17-dione 4-hydroxylase (HsaAB) from Mtb had higher specificity for 3-HSA than for 3,17-DHSA (apparent kcat/Km = 1000 ± 100 m−1 s−1 versus 700 ± 100 m−1 s−1). However, 3,9-DHSA was a poorer substrate than 3-hydroxybiphenyl (apparent kcat/Km = 80 ± 40 m−1 s−1). In the presence of 3-HSA the Kmapp for O2 was 100 ± 10 μm. The crystal structure of HsaA to 2.5-Å resolution revealed that the enzyme has the same fold, flavin-binding site, and catalytic residues as p-hydroxyphenyl acetate hydroxylase. However, HsaA has a much larger phenol-binding site, consistent with the enzyme's substrate specificity. In addition, a second crystal form of HsaA revealed that a C-terminal flap (Val367–Val394) could adopt two conformations differing by a rigid body rotation of 25° around Arg366. This rotation appears to gate the likely flavin entrance to the active site. In docking studies with 3-HSA and flavin, the closed conformation provided a rationale for the enzyme's substrate specificity. Overall, the structural and functional data establish the physiological role of HsaAB and provide a basis to further investigate an important class of monooxygenases as well as the bacterial catabolism of steroids.
Keywords: Bacterial Metabolism, Flavoproteins, Kinetics, Steroid, X-ray Crystallography, Monooxygenase, Mycobacterium tuberculosis, Phenol
Introduction
Mycobacterium tuberculosis (Mtb),6 the most devastating infectious agent of mortality worldwide (1), remains a primary public health threat due to synergy with the human immunodeficiency virus and the emergence of extensively drug-resistant strains. Mtb has the unusual ability to survive and replicate in the hostile environment of the macrophage (2, 3) utilizing largely unknown mechanisms. Genes essential to intracellular survival have been identified using genome-wide mutagenesis (4). A cluster of such genes was subsequently predicted to specify cholesterol catabolism (5). Targeted gene deletion studies subsequently indicated that cholesterol catabolism occurs throughout infection, contributing to the virulence of Mtb (6–8). Although the exact role of cholesterol in infection remains unclear, the gene deletion studies are consistent with the high concentrations of cholesterol found within caseating granulomas and the observed congregation of bacteria around cholesterol foci (9).
The cholesterol catabolic pathway of Mtb is very similar to that of other pathogenic and environmental actinomycetes (10), as initially predicted in Rhodococcus jostii RHA1 (5). Side-chain degradation is initiated by a cytochrome P450 and proceeds via a β-oxidative process (11). Degradation of the four-ringed steroid nucleus is initiated by 3β-hydroxysteroid dehydrogenase (3β-HSD), yielding 4-cholestene-3-one (12). The extent to which side-chain and ring degradation occur concurrently is unclear. Ring degradation involves the successive actions of 3-ketosteroid-1Δ-dehydrogenase and 3-ketosteroid 9α-hydroxylase, which result in the opening of ring B with concomitant aromatization of ring A to yield a phenol, 3-hydroxy-9,10-seconandrost-1,3,5(10)-triene-9,17-dione (3-HSA) (13–17). The phenolic ring of the latter has been predicted to be hydroxylated by HsaAB to yield a catechol, 3,4-dihydroxy-9,10-seconandrost-1,3,5(10)-triene-9,17-dione (3,4-DHSA) (Fig. 1) (5). The catechol is then subject to meta-cleavage and C-C bond hydrolysis by HsaC (5, 6) and HsaD (18), respectively. In Mtb and RHA1, the hsaACDB genes occur in a single operon, and their respective products share 74–82% amino acid sequence identity. In transposon mutagenesis studies, hsaA (3570c) was identified as one of 126 genes necessary for survival of Mtb in macrophages under conditions that model the immune response (4).
FIGURE 1.

The role of HsaAB in the cholesterol catabolic pathway of actinomycetes. A, cholesterol is transformed to 3-hydroxy-9,10-seconandrost-1,3,5(10)-triene-9,17-dione (3-HSA) via previous enzymatic steps. HsaAB is proposed to catalyze the ortho hydroxylation of a phenol, 3-HSA, to a catechol, 3,4-dihydroxy-9,10-seconandrost-1,3,5(10)-triene-9,17-dione (3,4-DHSA). The latter is subsequently cleaved by HsaC to 4,5–9,10-diseco-3-hydroxy-5,9,17-trioxoandrosta-1(10),2-diene-4-oic acid (4,9-DSHA). B, other phenols that were used in this study: a, 3,17-DHSA; b, 3,9-DHSA; and c, 3-hydroxybiphenyl (3-HB). These are transformed by HsaAB to 3,4,17-THSA, 3,4,9-DHSA, and 2,3-dihydroxybiphenyl, respectively.
Flavin-dependent monooxygenases (FDMs) constitute an important class of enzymes that utilize a reduced flavin to activate O2 and hydroxylate a variety of organic substrates. Two broad classes are recognized based on whether the flavin is reduced and used to hydroxylate the substrate at a single active site (19) or whether flavin reduction and organic substrate hydroxylation occur at different sites, in two separate polypeptides. In the latter, referred to as two-component (TC-) FDMs, a reductase utilizes NADH to reduce the flavin, which is then transferred to the oxygenase (20). The oxygenase generally has a preference for FADH2 or FMNH2. Examples for the former include 4-hydroxyphenyl acetate 3-monooxygenase (HpaB) of Escherichia coli (21) and 2,4,5-trichlorophenol monooxygenase from Burkholderia cepacia (22). FMN-dependent systems are involved in the synthesis of antibiotics such as actinorhodin in Streptomyces coelicolor (23), the bacterial degradation of polyaminocarboxylates such as nitrilotriacetic acid (24), and the desulfurization of fossil fuels by rhodococci (25). pHPAH (EC 1.14.13.3), a well characterized FMN-utilizing enzyme from Acinetobacter baumanii, catalyzes the hydroxylation of p-hydroxyphenyl acetate (HPA) to 3,4-dihydroxyphenyl acetate (PDB entry 2JBT) (26). The reductase component, C1, requires HPA for effective flavin reduction (27), and the oxygenase component, C2, binds FMNH2 prior to HPA (28). HsaAB has been predicted to be a TC-FDM based on the ∼32% amino acid sequence identity that it shares with C2 and C1 of pHPAH.
Herein we describe the characterization of HsaAB of Mtb. A ΔhsaA mutant of RHA1 was used to investigate the enzyme's role in cholesterol catabolism and to generate substrates. To substantiate the role of the Mtb enzyme, each component was heterologously produced, purified, and used to reconstitute the enzyme's activity in vitro. The enzyme's specificity for a number of steroid metabolites was investigated. Finally, the crystal structure of HsaA was determined and compared with those of related oxygenases. The results are discussed with respect to TC-FDMs and the bacterial catabolism of steroids.
MATERIALS AND METHODS
Chemicals and Reagents
Chemicals were purchased from the following suppliers: 3-hydroxybiphenyl (3-HB, IVA) from ASDI (Newark, DE); 1,4-androstadien-3,17-dione from Steraloids, Inc. (Newport, RI); BSTFA+TMCS from Supelco Analytical (Bellefonte, PA); riboflavin and FMN from Sigma; and FAD from MP Biomedicals Inc. (Solon, OH). 2,3-Dihydroxybiphenyl was a gift from Dr. Victor Snieckus. Restriction enzymes and Expand High Fidelity PCR System were purchased from New England Biolabs (Ipswich, MA) and Roche Applied Science (Laval, Quebec), respectively. Oligonucleotides were from Integrated DNA Technology. Crystallization screening solutions were purchased from Hampton Research, Emerald BioSystems, and Jena Bioscience. All other reagents were of HPLC or analytical grade.
Bacterial Strains and Culture Conditions
Escherichia coli strains were grown in Luria-Bertani (LB) medium at 37 °C, 200 rpm. E. coli DH5α was used to propagate DNA. To produce HsaB, E. coli GJ1158 (29) containing pT7HB was grown at 30 °C in low salt LB medium supplemented with 100 μg ml−1 ampicillin. Expression of hsaB was induced when the culture attained an A600 of 0.6 by adding NaCl to a final concentration of 0.3 m. Cells were further incubated for 16 h, harvested by centrifugation, washed twice with 20 mm sodium phosphate (pH 8.0) containing 10% glycerol, then frozen at −80 °C until use. For metabolite analyses, R. jostii RHA1 ΔhsaA mutant, RHA017 (30), was grown in W minimal medium (31) supplemented with 0.5 mm cholesterol as described previously (6). To produce HsaA, RHA017 containing pTipHA was grown at 30 °C in LB supplemented with 25 μg/ml chloramphenicol. Expression of hsaA was induced when the culture attained an A600 of 0.8 by adding thiostrepton to a final concentration of 50 μm. Cells were further incubated for 21 h prior to harvesting and freezing as described above.
Heterologous Expression of HsaAB
DNA was propagated, digested, ligated, and transformed using standard protocols (32). Plasmids were electroporated into RHA017 (30) and E. coli using a MicroPulser from Bio-Rad (Hercules, CA) with Bio-Rad 0.1-cm GenePulser Cuvettes. The hsaA (Rv3570c) and hsaB (Rv3567c) genes were amplified from Mtb H37Rv genomic DNA by PCR using the Expand High Fidelity and the following three-phase thermo-cycler program: 95 °C for 5 min; 25 cycles of 95 °C for 30 s, 57 °C for 30 s, and 72 °C for 1.5 min; and a final phase at 72 °C for 7 min. The hsaA gene was amplified using a forward primer (GCAATAGCATATGCATCACCATCACCATCACATCGAAGGTAGGACGTCCATTCAACACGTGATG), which introduced an NdeI site, six codons for histidine, and a Factor Xa recognition site, and a reverse primer (GCCAAGCTTGGTAGCTGTCATTTCGCCTAGACC), which introduced a HindIII site. The amplicon was first cloned into pET41b+ (Novogen, Oakville, Ontario) as an NdeI/HindIII fragment, its nucleotide sequence was verified, and then subcloned in pTipQC2 (33) using the same restriction sites, yielding pTipHA. The hsaB gene was amplified using oligonucleotides (CTAGCTAGCGCTCAGATCGATCCACGCACG and GCCAAGCTTCGTCTGCTCGCGCCACTAG) that introduced NheI and HindIII sites flanking the gene. The amplicon was cloned in pT7HP20 (34) as an NheI/HindIII fragment to yield pT7HB, from which HsaB is produced as an N-terminally His-tagged protein, Ht-HsaB. The nucleotide sequences of cloned amplicons were confirmed by the Nucleic Acid Protein Service at University of British Columbia.
Metabolite Analysis
Production of metabolites in culture supernatant was monitored using GC-MS as described below. Samples were analyzed directly or after BSTFA+TMCS- (99:1) derivatization. When the metabolite concentration was judged to be maximal, the culture supernatant was collected by centrifugation and then extracted twice with one volume of ethyl acetate. The ethyl acetate fractions were pooled, dried with anhydrous magnesium sulfate, and evaporated to dryness with a rotary evaporator. Metabolites were purified by column chromatography (SiO2, n-hexane/ethyl acetate = 2:3) and evaporated to dryness. To identify reaction products, substrates were dissolved to 205 μm in 220 μl of 20 mm sodium phosphate, pH 7.0, containing 25.8 μm HsaA, 3 μm HsaB·FMN, and 1 mm NADH. This mixture was incubated at 25 °C for 30 min then extracted with 400 μl of ethyl acetate and either directly analyzed via GC-MS or first dried under N2 and derivatized using BSTFA+TMCS (99:1).
Protein Purification
To purify HsaA, the pellet of RHA017 cells containing pTipHA obtained from 4 liters of culture was resuspended in 40 ml of 20 mm HEPES (pH 7.5) containing 1 mm dithiothreitol at 4 °C. The cells were disrupted using 30 g of 0.1-mm zirconia/silica beads in a bead beater (Biospec Products, Bartlesville, OK) for five cycles of 2-min beating and 10-min incubation on ice. The chamber of the bead beater was immersed in ice water throughout the whole procedure after which the cell suspension was kept under N2 and centrifuged (40,000 × g, 45 min, 4 °C). HsaA was purified in a Labmaster Model 100 glove box (M. Braun, Inc., Peabody, MA) operated at <5 ppm O2. The supernatant was passed through a 0.45-μm filter (Sartorius AG, Göttingen, Germany) and loaded onto nickel-nitrilotriacetic acid-agarose (Qiagen) column (1.8 cm × 5 cm) equilibrated with 20 mm sodium phosphate, pH 8.0, containing 10% glycerol. The purification was performed using an imidazole step gradient according to the instructions of the manufacturer. HsaA was eluted using 20 mm sodium phosphate, pH 8.0, containing 175 mm imidazole. The protein was exchanged into 20 mm HEPES, pH 7.5, 2 mm dithiothreitol, and 10% glycerol via ultrafiltration, concentrated to ∼20 mg/ml, and flash frozen as beads in liquid N2.
HsaB Was Purified Using Essentially the Same Protocol with the Following Modifications
E. coli cells containing pT7HB from 1 liter of culture were used as the starting material; cells were disrupted using an Emulsiflex-05 homogenizer (Avestin, Ottawa, Ontario, Canada) operated at 10,000 p.s.i.; the manipulations were performed aerobically. The yellow-colored protein was exchanged into 25 mm HEPES, pH 7.5, containing 5% glycerol, concentrated to ∼20 mg/ml, and flash frozen in liquid N2.
Identification of HsaB-bound Flavin
HsaB (20 μl, 86 μm) was diluted to 500 μl using 20 mm potassium phosphate, pH 7.0, prior to denaturation by heat. The mixture was incubated at 100 °C for 3 min, rapidly cooled on ice, and centrifuged at 10,000 × g for 30 min at 4 °C. The supernatant was passed through a 0.2-μm filter and analyzed via HPLC using the method of Faeder and Siegel (35). Solutions of riboflavin, FMN, and FAD were used as standards.
Reconstitution of HsaB
Flavin-free HsaB was produced anaerobically in the glove box by incubating a 500-μl solution of 86 μm HsaB and 10 mm NADH in 20 mm HEPES, pH 7.6, for 5 min, then immediately passing the sample over a 0.5- × 5-cm column of Biogel P6 (Bio-Rad) equilibrated with 20 mm HEPES, pH 7.6. HsaB was reconstituted by aerobically incubating the apoenzyme with 2 mm flavin for 1 h. Excess flavin was removed via ultrafiltration.
Analytical Methods
TLC was performed using silica gel 60 F254 (Merck). Compounds were detected at 254 nm after first spraying plates with 50% sulfuric acid in ethanol and heating them for 5 min at 110 °C. Preparative column chromatography was carried out on silica gel 60 (mesh size 40–63 μm). NMR spectra were recorded using a Varian Unity 500-MHz and an Inova 600-MHz (Varian Inc., Mississauga, Ontario, Canada) spectrometer. Chemical shifts (δ) are reported in ppm relative to CHCl3 (1H: δ = 7.24) and CDCl3 (13C: δ = 77.0) as internal standards. GC-MS was carried out using an HP 6890 series GC system fitted with an HP 5973 mass-selective detector and a 30-m × 250-μm HP-5MS Agilent column. The operating conditions were: TGC (injector), 280 °C; TMS (ion source), 230 °C; oven time program (T0 min), 104 °C; T2 min, 104 °C; T14.4 min, 290 °C (heating rate 15 °C·min−1); and T29.4 min, 290 °C. HPLC analysis were performed using a Waters 2695 Separations HPLC module equipped with a Waters 2996 photodiode array detector and a 250 × 4.60 mm C18 Prodigy 10μ ODS-Prep column (Phenominex, Torrance, CA). SDS-PAGE was performed using a Bio-Rad MiniPROTEAN III apparatus with a 10% or 12% resolving gel. Gels were stained with Coomassie Blue using standard protocols. Protein concentrations were determined using the Micro BCATM protein assay kit (Pierce) and the Bradford method (36) using bovine serum albumin as a standard.
Enzyme Activity
HsaAB activity was measured spectrophotometrically by following the hydroxylation of 3-HB in a coupled assay with BphC (37) at 25 ± 0.5 °C. Reactions were performed in 125 μl of 20 mm potassium phosphate, pH 7.0, containing 1.6 mm 3-HB, 2.8 μm BphC, 4 μm HsaB·FMN, and 10.2 μm HsaA. Components were incubated for 30 s, then the reaction was initiated by adding NADH to a final concentration of 600 μm and was monitored at 434 nm, the absorbance maximum of 2-hydroxy-6-oxo-6-phenylhexa-2,4-dienoic acid (ϵ434 = 16.9 mm−1 cm−1). Stock solutions were prepared fresh daily. Absorbance was monitored using a Varian Cary 5000 spectrophotometer controlled by WinUV software. One unit of activity was defined as the amount of enzyme required to consume 1 μmol of substrate per minute.
Steady-state kinetic parameters were evaluated using standard conditions except that for 3-HSA and 3,17-DHSA, 11.7 μm HsaC was used instead of BphC. Substrate concentrations were varied over the following ranges: 90–1600 μm for 3-HB and 30–1000 μm for each of 3-HSA and 3,17-DHSA. The molar absorptivities of 4,9-DSHA and 4,9-DSDHA were 2.41 and 2.40 mm−1 cm−1, respectively, at 392 nm (pH 7.0). In these studies, HsaA was thawed and stored under N2 in a sealed vial on ice. Aliquots were withdrawn using a gas-tight syringe. Kinetic parameters were evaluated by fitting the Michaelis-Menten equation to the data using the least-squares fitting and dynamic weighting options of LEONORA (38).
The steady-state kinetic parameters for O2 were determined using a Clarke-type electrode (Hansatech Instruments Ltd., Norfolk, England) interfaced to a computer equipped with the Oxygraph Plus software. The reaction buffer was equilibrated for 20 min by vigorous bubbling with mixtures of N2 and O2 prior to the reaction, and the reaction cuvette was continually flushed with the same gas mixture during the reaction. The assay was performed in 500 μl containing 660 μm 3-HSA, 0.2 μm HsaB, and 10.2 μm HsaA. The reaction was initiated by adding NADH to 500 μm. After 60 s, 603 units of catalase was added to the reaction mixture. The rate of O2 consumption prior to catalase addition (vO2) was taken to represent the rate of substrate hydroxylation (vROH) plus the rate of adventitious production of H2O2. The rate after catalase addition (v+C) was taken to represent vROH plus 50% of the rate of adventitious production of H2O2. Thus, vROH was calculated from 2v+C − vO2.
Static Light Scattering
Purified HsaA in solution was analyzed by the triple-angle light-scattering detector (Wyatt MiniDAWN Tristar) connected on-line to a size-exclusion chromatography column (Amersham Biosciences, Superdex 200 HR 10/30). The gel-filtration buffer contained 20 mm HEPES, pH 7.5, 150 mm NaCl, and 10% glycerol (v/v). The molecular weights of HsaA fractions were calculated using the ASTRA software (Wyatt Technology).
Crystallization
HsaA was crystallized under two conditions. In the first, crystals of protein purified aerobically from E. coli were grown aerobically at 18 °C using the hanging drop, vapor-diffusion method using aerobically purified HsaA. 1 μl of 20–25 mg/ml protein was mixed with 1 μl of crystallization solution (2 m sodium formate, 0.1 m sodium acetate, pH 4.6). Single flattened rod-like crystals appeared in ∼10 days and grew to their full size (250 μm × 80 μm × 50 μm) in ∼2 weeks. Prior to data collection HsaA crystals were briefly transferred to a series of solutions containing 80% of the equilibrated reservoir solution supplemented with increasing amounts of ethylene glycol (5–20%) and flash frozen in liquid N2. In the second, crystals of protein purified anaerobically from RHA1 were grown anaerobically at 23 °C in the above-described glove box using the sitting drop, vapor-diffusion method and anaerobically purified HsaA. 1 μl of 11 mg/ml protein was mixed with 1 μl of crystallization solution (0.1 m Tris-HCl, pH 7.0, 20% (w/v) polyethylene glycol-2000 MME). Thin plates were obtained within 3 days. Crystals were harvested directly from the mother liquor and were flash frozen in liquid nitrogen in the anaerobic chamber prior to data collection.
X-ray Data Collection and Structure Determination
X-ray data were collected under cryogenic conditions using a rotating anode x-ray generator (CuKα radiation λ = 1.542 Å) and synchrotron radiation at the Canadian Light Source (beamline CMCF1, λ = 1.000 Å). Data were processed using XDS (39) or HKL2000 (40). The initial model and phase information were obtained from aerobically grown crystals by molecular replacement using the structure of substrate-free pHPAH (PDB entry 2JBS) and the program EPMR (41). Crystals grew in the space group I222 with two copies of HsaA in the crystallographic asymmetric unit. Model building and structure refinement were performed using CNS (42) and REFMAC (43). Anaerobically, crystals grew in space group P21 with four molecules of HsaA in the asymmetric unit. The structure was solved using the structure of aerobically grown HsaA as the starting model and MOLREP (43), and was refined as described above.
Data collection and refinement are summarized in Table 3. Electron density maps were calculated using the CCP4 package (44). Structural figures were made with the program PyMOL (45). The coordinates for the two Mtb HsaA conformations were deposited in the Brookhaven Protein Data bank with accession codes 3AFE and 3AFF.
Molecular Docking Simulation and Modeling
3-HSA was designed using PRODRG (46), energy was minimized using the Dreiding force field (47), and PM6 semi-empirical charges were calculated using MOPAC2007 (48). After removing water molecules from the HsaAO and HsaAC models, docking simulations were initially performed using PATCHDOCK (49). Significant clusters that placed the ligand molecule in the correct orientation with respect to the cofactor were picked and run through Autodock version 4.0 (50) with active site residues held rigid and the initial torsion angles of 3-HSA randomly set.
Solutions of the best free energy were minimized with strong restraints (Force 200) until gradient norm convergence to 1.0, over the entire system (heavy atoms only) with the exception of a sphere of 8 Å around the active site. Residues within this sphere were unrestrained to allow for minor side-chain re-orientations. The cofactor was kept rigid during all calculations and was positioned based on the closely similar binding site of pHPAH. Structural figures and graphics were rendered using PyMOL (45).
RESULTS
Phenotype of the hsaA Deletion Mutant
Bioinformatic analyses indicate that HsaAB of the actinomycete cholesterol catabolic pathway is a TC-FDM that transforms 3-HSA to 3,4-DHSA (5). To test this prediction, we investigated the phenotype of RHA017, an hsaA deletion mutant of RHA1 (30). Consistent with the enzyme playing a central role in cholesterol catabolism, the deletion strain did not grow on cholesterol but grew normally on pyruvate (data not shown). When pyruvate-grown cells of RHA017 were incubated in the presence of cholesterol, four major metabolites accumulated in the medium (Fig. 2A). Purification of the three major ones afforded 3-HSA and two keto-reduced versions thereof: 3,9-DHSA and 3,17-DHSA. These were characterized using GC-MS and 1H-, 13C-, (H,H)-COSY-, HSQC-, and HMBC-NMR as summarized in the supplemental materials. The fourth metabolite was identified as 3,9,17-THSA using GC-MS.
FIGURE 2.

GC-MS analyses of supernatant of the hsaA deletion mutant of R. jostii RHA1 (RHA017) incubated in the presence of cholesterol. The traces A and B represent samples before and after treatment with HsaAB as described under “Materials and Methods.” 3,4-tms-DHSA and 3,4,17-tms-THSA are the derivatized catecholic transformation products of 3-HSA and 3,17-DHSA, respectively.
Purification of HsaAB
HsaA produced in E. coli and purified aerobically had a very low specific activity. Production of the protein in RHA017 using pTipHA increased the specific activity by an order of magnitude; anaerobic purification further increased this 2-fold. This approach typically yielded 25 mg of purified HsaA per liter of culture with an apparent purity of >95% according to SDS-PAGE analysis and a specific activity of 0.12 unit/mg using 3-HB in the standard assay. Proteolytic removal of the N-terminal His tag did not significantly affect the specific activity. Accordingly, His-tagged HsaA was used in this study.
Purification of HsaB from E. coli (pT7HB) yielded 25 mg of protein per liter of culture. The purified preparation was >95% HsaB as judged from SDS-PAGE and had absorption maxima at 268, 370, and 448 nm consistent with the presence of oxidized flavin (supplemental Fig. 1A). HPLC analyses of the acid-extracted flavin revealed two species with retention times and spectra corresponding to FMN and FAD, respectively (supplemental Fig. 1B). In subsequent experiments, HsaB was reconstituted with either FMN or FAD as solely bound cofactor.
HsaAB Catalyzes o-Hydroxylation
As noted above, RHA017 cultures incubated with cholesterol accumulated 3-HSA, 3,9-DHSA, 3,17-DHSA, and 3,9,17-THSA. When the culture supernatant was incubated for 30 min at room temperature with 9 μm HsaA, 4 μm HsaB·FMN, and 600 μm NADH, 3-HSA and 3,17-DHSA were removed from the mixture and two new compounds were detected by GC-MS (Fig. 2B). Mass spectrometry and NMR spectroscopy identified these compounds as 3,4-DHSA and 3,4,17-THSA (supplemental materials). Under similar conditions, HsaAB transformed 3-HB to 2,3-dihydroxybiphenyl, as confirmed by GC-MS (supplemental materials). These results demonstrate that HsaAB of Mtb is able to catalyze the o-hydroxylation of a range of p-substituted phenols to generate the corresponding catechols.
Steady-state Kinetic Analyses
To evaluate the specificity of HsaAB for different substrates, a coupled spectrophotometric assay was developed in which the catechol produced by the HsaAB reaction was cleaved by an extradiol dioxygenase (HsaC or BphC) to yield the yellow-colored meta-cleavage product. Dioxygenase concentrations were adjusted so as not to be rate-limiting. The concentration of HsaA was 2.5-fold higher than that of HsaB to maximize coupling between these components (see below). In all studies, the inferred initial rates of hydroxylation displayed Michaelis-Menten kinetics (Fig. 3). The evaluated kinetic parameters are considered to be apparent as they are dependent on the ratio of HsaA and HsaB as well as the concentration of O2.
FIGURE 3.
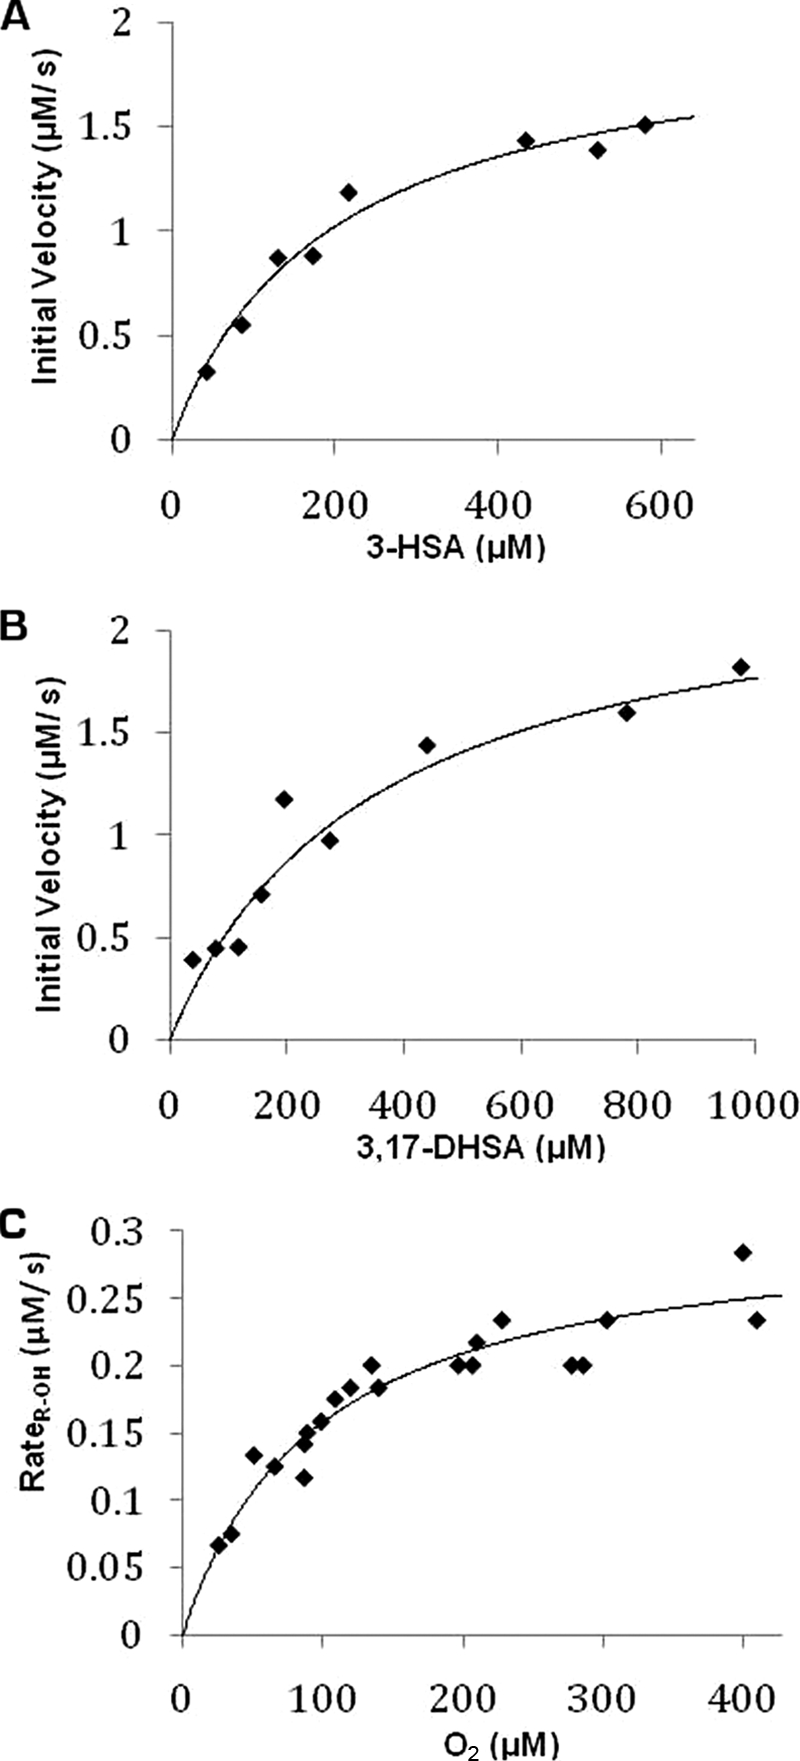
Steady-state kinetic analysis of HsaAB-catalyzed transformations. The dependence of the initial velocity on 3-HSA (A) and 3,17-DHSA (B) concentrations in air-saturated buffer with fitted parameters Km = 200 ± 40 μm and 350 ± 90 μm, and Vmax = 1.9 ± 0.1 μm s−1 and 2.2 ± 0.2 μm s−1, respectively. In these assays, the formation ring-cleaved products of 3,4-DHSA and 3,4,17-THSA, respectively, were followed. C, dependence of the initial velocity of O2 consumption on O2 concentration in the presence of 660 μm 3-HSA with fitted parameters KmO2 = 100 ± 10 μm and Vmax = 0.31 ± 0.02 μm s−1. O2 consumption was corrected for uncoupled consumption as described in the text. The best fits of the Michaelis-Menten equation to the data using LEONORA are represented as solid lines.
The coupled assay was performed with 3-HSA to evaluate the ability of HsaAB to utilize different flavins. In the presence of 4 μm exogenously added FMN or FAD, no increase in enzyme activity was observed. By contrast, 4 μm riboflavin inhibited the activity by ∼50%. To further evaluate the ability of HsaAB to utilize FMN and FAD, the reductase was reconstituted with each flavin as sole cofactor. As summarized in Table 1, the apparent specificity of HsaAB for 3-HSA was remarkably similar for assays containing HsaB·FMN and HsaB·FAD. However, the apparent kcat and Km values were ∼3-fold greater in the presence of HsaB·FMN. All subsequent kinetic studies were performed using HsaB·FMN and without supplementary flavin.
TABLE 1.
Apparent steady-state kinetic parameters of HsaAB from M. tuberculosis
| Substratea | Flavina | Km | kcat | kcat/Km |
|---|---|---|---|---|
| μm | s−1 | m−1s−1 | ||
| 3-HSAb | FAD | 97 (4) | 0.075 (0.001) | 770 (20) |
| 3-HSAb | FMN | 200 (40) | 0.20 (0.01) | 1000 (100) |
| 3,17-DHSAb | FMN | 350 (90) | 0.24 (0.03) | 700 (100) |
| 3-HBb | FMN | 1440 (1420) | 0.11 (0.06) | 80 (40) |
| O2c | FMN | 100 (10) | 0.031 (0.002) | 320 (30) |
a Indicates flavin used to reconstitute HsaB. All experiments were performed using 20 mm potassium phosphate, pH 7.0, at 25 °C.
b Coupled spectrophotometric assay.
c Oxygraph assay utilizing 660 μm 3-HSA and 20-fold less HsaB than in the spectrophotometric assay. Values reported in parentheses represent ± S.E.
The coupled assay was then used to evaluate the specificity of HsaAB for various p-substituted phenols. Of the purified steroid metabolites, the mycobacterial enzyme had slightly higher apparent specificity (kcat/Km) for 3-HSA versus 3,17-DHSA (Table 1). By contrast, the apparent specificity for 3-HB was an order of magnitude lower. Nevertheless, the apparent kcat values for these p-substituted phenols were within a factor of two. Remarkably, the activity of 3,9-DHSA was too low to evaluate kinetic parameters. However, in an assay using 205 μm 3,9-DHSA and 25.8 μm HsaA, GC-MS analyses demonstrated that the phenol was transformed to 3,4,9-THSA and that this reaction occurred with one-third the efficiency of the 3-HB transformation.
An oxygraph assay was developed to investigate the reactivity of HsaAB with O2. In developing this assay, it was noted that O2 was consumed in the absence of HsaA. This HsaB-dependent O2 consumption resulted in quantitative H2O2 production as indicated by the addition of catalase (results not shown). To minimize uncoupled O2 consumption, assays were performed using 10-fold less HsaB than in the spectrophotometric assay. The remaining H2O2 production was corrected for by measuring the rate of O2 consumption before (vO2) and after (v+C) the addition of catalase. The calculated rate of O2 consumption due to hydroxylation, vROH, was within 5% of that determined using the spectrophotometric assay and the same concentration of HsaB. Using the oxygraph assay and saturating amounts of 3-HSA, the apparent KmO2 was 100 ± 10 μm (Table 2).
TABLE 2.
Crystallographic properties, X-ray diffraction data, phasing, and refinement statistics for HsaA from M. tuberculosis
| Diffraction data | HsaA (aerobic) | HsaA (anaerobic) |
|---|---|---|
| X-ray source | CMCF1 | CuKα |
| Wavelength (Å) | 1.000 | 1.5418 |
| Space group | I222 | P21 |
| Unit cell (Å, deg) | a = 68.74, b = 173.96, c = 178.07 | a = 91.0, b = 94.0, c = 98.1 |
| α = 90.0°, β = 90.0°, γ = 90.0° | α = 90.0°, β = 94.0°, γ = 90.0° | |
| Resolution range (Å) | 40–2.00 | 50–2.40 |
| Highest shell (Å) | 2.0-2.05 | 2.44-2.40 |
| Unique reflections | 72,634 (5,414) | 64,589 (3,082) |
| I/σI | 26.4 (4.4) | 16.2 (1.7) |
| Rsym(%)a | 6.8 (34.2) | 9.4 (54.3) |
| Completeness (%) | 95.4 (97.4) | 99.7 (96.0) |
| Refined model | ||
| Resolution range (Å) | 20–2.0 | 50–2.4 |
| No. reflections | 68,987 | 64,589 |
| Rfactor/Rfree (%)b | 18/22 | 20/27 |
| Mean B-values (Å2) | 31.24 | 35.24 |
| r.m.s.d. | ||
| Bond lengths (Å) | 0.020 | 0.020 |
| Bond angles (deg) | 1.77 | 1.847 |
a Rsym = ΣhΣi I(hkl) − 〈I(hkl)〉/ΣhΣiI(hkl).
b Rwork = Σ‖Fobs| − |Fcalc‖/Σ|Fobs|. Rfree is the Rwork value for 5% of the reflections excluded from the refinement. Data for the highest resolution shell are given in parentheses.
Overall Structure
The refined structure of HsaA purified aerobically from E. coli contains two peptide chains (residues 4–391), two formate ions, and 669 water molecules in the asymmetric unit (Table 2 and Fig. 4). Due to the lack of visible electron density, the model does not include three portions of the molecule: the N terminus (the His tag and residues 1–3), the C terminus (residues 391–394), and residues 261–282. As presented below, the Fo − Fc difference map revealed a ring-shaped 6-σ positive peak in the substrate-binding site of the enzyme. This density was not assigned but likely represents an E. coli metabolite that co-purified with the enzyme. In comparison, the refined structure of anaerobically prepared HsaA purified from RHA1 contains four peptide chains (residues 3–394) and 472 water molecules. N-terminal residues 1–3 and residues 271–272 were not visible in any of the four molecules of the asymmetric unit. Comparison of the two structures revealed major differences in an apical hairpin turn (Gly261–Val281) and the C-terminal segment (Val367–Val394) as discussed below. The structures of aerobically and anaerobically prepared oxygenases are henceforth referred to as HsaAC and HsaAO, for “closed” and “open” conformations, respectively.
FIGURE 4.

Crystal structure of HsaA from M. tuberculosis. A, ribbon representation of the HsaAO protomer. The central β-barrel domain of this conserved fold is colored dark gray, and the flanking N- and C-terminal α-helix bundles are colored red and orange, respectively. B, ribbon representation of the HsaAO tetramer viewed along the 2-fold symmetry axis. Subunits are colored differentially in shades of violet, cyan, yellow, and green. C, ribbon representation of the HsaAC octamer complex. The four subunits that occur above the plane of view are colored with different darker shades. The four subunits below the view plane are colored with lighter shades. D, expanded view of the interactions between three subunits within the octamer. The C-terminal flaps (Val367–Val394) of two subunits, colored in two hues of red, align in an anti-parallel fashion. This interface is in close proximity to the hairpin loop (Gly261–Val281) of a third subunit (dark green). This loop, which is not visible in the electron density and thus represented by black dots, would be projected next to the C-terminal flaps from below the view plane. This interaction between the three HsaAC protomers repeats itself to form the octameric ring structure.
The overall fold of HsaA is conserved when compared with other structurally characterized TC-FDM oxygenases. Thus, HsaA formed two distinct substructures: a β-barrel (Ser113–Arg206) and a bundle of α-helices (Fig. 4A). The latter are derived from both termini (Arg7–Pro112 and Phe207–Val394). The overall fold is maintained between HsaAC and HsaAO. However the former crystallized as an octamer while the latter crystallized as a tetramer. In HsaAC, the two subunits of the asymmetric unit are nearly identical as reflected by an r.m.s.d. between the Cα atoms of less than 0.32 Å. Each protomer forms an extended contact interface with symmetry-related subunits along the crystallographic and non-crystallographic 2-fold axes to form a doughnut-shaped octameric assembly that is 90–100 Å wide with a central solvent-accessible pore of 40–45 Å in diameter (Fig. 4C). Calculations performed using the PISA server indicated that the buried surface in each molecule is 1,138 Å2 and predicting that the octamer is highly stable. In HsaAO, the four protomers of the asymmetric unit have an r.m.s.d. of 0.48 Å over the 369 backbone Cα atoms. In comparison to the octameric HsaAC, the tetrameric HsaAO has a larger average buried surface area per protomer of 2,616 Å2 (Fig. 4B). Static light scattering analysis indicated that HsaA prepared aerobically from the E. coli host exists as a mixture of dimers and octamers in solution while HsaA prepared anaerobically from the rhodococcal host exists as a tetramer (supplemental Fig. 2).
Conformational States of the C-terminal Flap
Comparison of the tetrameric HsaAO and octameric HsaAC revealed different contacts between HsaA protomers in the crystal lattice, as reflected by the difference in buried surface area described above. In addition, two regions of the molecule displayed conformational differences that likely further contribute to the difference in crystal packing: an apical hairpin turn (Gly261–Val281) and a C-terminal flap (Val367–Val394). In HsaAO (P21), the C-terminal helix bundles (Fig. 4A) are clustered toward the center of the tetramer (Fig. 4A), forming a coiled-coiled complex, with the β-barrel projecting outward in the tetrahedral arrangement (Fig. 4B). At the center of the tetramer, a helix-turn-helix motif (Glu317–Gly365) composed of residues immediately preceding those of the C-terminal flap, stacks and aligns anti-parallel to the equivalent motif in the adjacent protomer. Moreover, the same cluster of residues from the two protomers comprises the major direct noncovalent interactions at the interface: Phe341, Leu349, Trp359, and His363. A second helix bundle motif, involving Phe278–Ala343 and the C-terminal flap, associates with equivalent motifs between dimers to form the HsaAO tetramer. This second interface includes two equivalent hydrogen bonds involving Arg328 and Arg332 of one molecule and Glu285 and Asp289 of an adjacent one. The C-terminal flap also contributes to this second interface, mainly through hydrophobic interactions involving Tyr377–Phe385 and Lys280–Ala284. More specifically, the side chain of Val378 and the backbone of Gly381 interact with the aliphatic side-chain atoms of Lys280. The ϵ-amine group of the latter forms a hydrogen bond with the side-chain amide oxygen of Asn382. Finally, the side chains of Ile283 and Ala284 provide a hydrophobic platform for Phe380 and Phe385 on the C-terminal flap. Overall, the apical hairpin turn is stabilized by the C-terminal flap in the HsaAO tetramer.
By contrast, the intersubunit interactions in the HsaAC octamer are more intricate (Fig. 4C), with each protomer interacting with three others. At one end, each protomer interacts with its neighbor through their respective helix-turn-helix motifs in much the same way as in HsaAO. At the other end, contact with a third protomer involves hydrophobic interactions between C-terminal flaps at the entrance of the active site with residues of adjacent protomers, Ile376, Tyr374, Phe377, and Phe382, involved. In comparison to its conformation in HsaAO, the flap in HsaAC differs by a 25° rigid body rotation around Arg366 (Fig. 5C) enabling the described intersubunit association and effectively occluding the entrance to the substrate-binding pocket of HsaA. Finally, our structures suggest that the interface between the C-terminal flaps is spatially positioned to potentially interact with the apical hairpin turn (disordered in our HsaAC structures) of an adjacent protomer (Fig. 4D).
FIGURE 5.

Conformational differences in HsaAO and HsaAC. In the structure of HsaAC (pale red), the C-terminal flap (Val367-Val394), reorients and seals the major entrance to the proposed 3-HSA binding site. The hairpin loop, highlighted in yellow, is present in the HsaAO structure, colored in cyan. Electron density for this loop was not detected in the HsaAC structure.
The two conformers also differ in the degree of flexibility of their C-terminal segments, with the B-factors increasing toward the C-terminal flap residues, reaching an average value of 50.6 Å2 for the backbone Cαs of Pro388–Val394. This value is ∼2-fold higher than that of the rest of the protein. By contrast, the B-factors of the C-terminal flap in HsaAC are comparable to those of the surrounding residues (∼27.6 Å2) and are similar throughout the flap.
We considered whether oxidation of a Cys residue might influence the conformation of the C-terminal flap of HsaA. Inspection of the two structures revealed that Cys63, Cys79, and Cys145 all have low solvent accessibilities and are remote (>20 Å) from the C-terminal flap. Inspection of the electron density revealed no evidence for oxidation. Thus, 2Fo − Fc and Fo − Fc maps revealed no additional electron density around the Cys thiols in the structure of the aerobically prepared enzyme. Moreover, water molecules are ordered around the cysteines in a similar fashion in both HsaAC and HsaAO. Overall, our data indicate that oxidation of a Cys residue does not contribute to the different conformation of the C-terminal flap.
The Flavin Binding (F-)Subsite
The structures of HsaA contain a deep cavity that presumably sequesters the substrates: reduced flavin, O2, and 3-HSA. This cavity is located at the interface between the C-terminal helix bundle and the β-barrel. Superposition of the structure of the pHPAH·flavin·pHPA complex facilitates the description of the substrate-binding pocket of HsaA (Fig. 6A). Notably, the pocket comprises two adjacent subsites: the H-subsite binds the phenol, and the slightly more solvent-accessible F-subsite binds the reduced flavin. The F-subsite of HsaAO is remarkably similar to that of pHPAH with all first shell residues being conserved (i.e. Trp84, Trp141, Ser143, Trp182, Leu187, and His368). Based on this superimposed model (Fig. 6A), the isoalloxazine ring stacks between the indole rings of Trp84 and Trp141, and is surrounded by the hydrophobic side chains of Trp182 and Leu187. Ser143 forms a hydrogen bond with flavin N5. Similarly to what was observed in pHPAH, the imidazole group of His368 is on the re-face of the isoalloxazine ring within 4 Å of N1, compatible with stabilization of a deprotonated N1 in the bound FMNH−. Finally, the entrance to the F-subsite is lined with charged residues and is partially occluded by an adjacent protomer in the tetramer, as observed in pHPAH. However, although residues contacting the isoalloxazine moiety are largely conserved, side chains that stabilize the phosphate group, located on a C-terminal helix, are not (i.e. Asn371).
FIGURE 6.

The substrate-binding site of HsaA from M. tuberculosis. A, the HsaAO structure, in which FMN was placed in the active site based on a superposition with the pHPAH·flavin·pHPA ternary complex (PDB code: 2JBT). B, the modeled HsaA·flavin·3-HSA ternary complex showing the relative position and orientation of the 3-HSA (orange) and FMNH− (yellow) in the active site. The two conformations of the C-terminal flap (Val367–Val394) are shown in different shades of red. C, the relative orientation and geometry between the phenolic ring of 3-HSA and the isoalloxazine ring of the flavin in the modeled HsaAC·flavin·3-HSA complex. The distance between the phenolic C4 and flavin C4a atoms, 4.9 Å, is indicated by an orange dotted line. Predicted hydrogen bonds are indicated by black dashed lines. D, the same orientation of the active site as in C with the unassigned electron density in HsaAC. The wire mesh represents an Fo − Fc map contoured at 3σ. Stereo images of the bound substrates in modeled (E) HsaAC and (F) HsaAO complex highlight the interactions of the C9 and C17 ketones of 3-HSA. The depicted helix is part of the C-terminal flap.
The F-subsite in the HsaAC crystal form is very similar, but differs in two respects. First, the entrance to the subsite is occluded by the C-terminal flap. Second, the flavin binding site is partially occupied by Trp139 and His368.
The 3-HSA Binding (H-)subsite
In contrast to the F-subsite, the H-subsite is buried in the core of the protein and is predominantly lined with hydrophobic residues: Trp94, Pro238, Ile241, Tyr210, His237, and Trp233. These residues are conserved in HsaA of R. jostii RHA1 but not in pHPAH. The size of the HsaA H-subsite versus that of pHPAH is consistent with the former accommodating a larger phenolic substrate.
To investigate the structural basis of binding of the phenolic substrate, we modeled 3-HSA into the H-subsite of HsaAO and HsaAC using molecular docking and energy minimization methods. The high structural similarity of the F-subsites of HsaAO, HsaAC, and pHPAH·flavin·pHPA allowed for positioning of flavin in the binding site. In both forms of HsaA, the His368 and Trp141 side chains were the only ones of the F-subsite that required minor reorientation to accommodate the flavin. The latter molecule was kept rigid during docking and energy minimization calculations. Positive clustering of docked solutions was readily observed using either HsaAO or HsaAC, with the best positional conformation placing the substrate in close proximity to the flavin molecule. A solution where the C4 atom of 3-HSA is within 4.2 Å to the C4a atom of the cofactor was chosen as the strongest candidate for further energy minimization. In docking 3-HSA, a number of aromatic side chains interacting with the bicycloalkanone moiety underwent rearrangement during the docking and energy minimization process.
In the modeled HsaAC·flavin·3-HSA complex, the phenol ring of 3-HSA is orientated toward the flavin and the bicycloalkanone moiety toward the entrance to the active site, stacking against Pro373 (Fig. 6B). The modeled complex shares at least three important features with the pHPAH·flavin·pHPA complex. First, the phenol ring is orthogonal to the flavin. Second, conserved Ser118 in HsaA appears to interact with the phenolic ring in such a way as to favor the deprotonated form of the hydroxyl group located 2.4 Å away. Third, there is a cavity between flavin C4a and phenol C4 that can accommodate O2 (Fig. 6C). More specifically, the distance between flavin C4a and phenol C4 is 4.9 Å, compatible with the formation of a C4a-hydroperoxyflavin intermediate on the re-face of the isoalloxazine ring (Fig. 6C). In the modeled complex, the probable O2-binding cavity is slightly larger than in the pHPAH·flavin·pHPA complex (29 Å3 versus 18 Å3) due to the presence of less bulky residues (e.g. Phe270 in pHPAH is Ile241 in HsaA). Finally, the unassigned electron density in HsaAC occupies a space corresponding to a portion of the iso-alloxazine ring of the flavin and the phenol ring of the 3-HSA (Fig. 6D).
Two notable features of the modeled HsaAC·3-HSA interactions involve C9 and C17 of the substrate (Fig. 6, B and E). The C9 carbonyl is orientated toward two acidic residues: Asp372 and Glu374. Asp372 participates in an H-bond with His368, the residue proposed to abstract a proton from the flavin N1. This small acidic patch is in close proximity to Arg366, the pivotal point of the C-terminal flap, which has distinct conformations in HsaAO and HsaAC. For its part, the C17 carbonyl is orientated toward a short hydrophobic channel lying between the helix bundle and the β-barrel domains. This channel is ∼9 Å long and is lined with the hydrophobic side chains of Tyr377, Tyr210, Phe380, Phe385, and Leu387.
Several interactions between 3-HSA and the enzyme that are present in the HsaAC model do not occur in the modeled HsaAO·flavin·3-HSA complex (Fig. 6F). First, Asp372 and Glu374 do not stabilize the C9 carbonyl, facing instead the bulk solvent. Second, only Tyr207 is within hydrogen bonding distance of the C17 carbonyl: the interaction with Tyr374 is absent. Finally, Pro370 and Pro119 both pack closely with the bicycloalkanone moiety in the HsaAC model, while only Pro119 is present in the HsaAO model. Overall, these differences underscore the possibility that conformational changes in the C-terminal flap may be important for binding and orientating the substrates.
DISCUSSION
The current study establishes that the role of mycobacterial and rhodococcal HsaAB is to transform 3-HSA to 3,4-DHSA in the catabolism of cholesterol. When incubated in the presence of cholesterol, a ΔhsaA mutant of RHA1 accumulated the enzyme's predicted substrate, 3-HSA, together with related metabolites in which the keto groups on the bicycloalkanone moiety are reduced. Consistent with its predicted role, reconstituted HsaAB from Mtb had the highest specificity for 3-HSA. Moreover, the crystal structure of HsaA revealed a fold that is typical of TC-FDM oxygenases and a substrate-binding pocket that is well adapted to the steroid metabolite. The function of HsaAB is consistent with transposon mutagenesis studies indicating that hsaA (3570c) is necessary for survival of Mtb in macrophages, but hsaB (3567c) is not (4), because it is likely that flavin-reducing function of HsaB could be performed by another enzyme.
The metabolite analyses of the ΔhsaA mutant suggest that at least in RHA1, side-chain degradation largely precedes ring degradation. More specifically, the identified metabolites represented either the end (C17 ketone) or penultimate (C17 hydroxy) product of side-chain degradation. This is consistent with the recent finding that cytochrome P450125 initiates cholesterol degradation in this strain by hydroxylating a terminal carbon (11). Nevertheless, the ΔhsaC mutant of RHA1 accumulated three major catecholic metabolites possessing the ketone, hydroxyl, as well a propionate group at C17,7 consistent with some simultaneous degradation of the side chain and rings. The different metabolites in the two mutants may reflect the relative specificities of the side chain-degrading enzymes for the phenolic versus catecholic steroid metabolites. Finally, the significance of the 9-hydroxy metabolites, 3,9-DHSA and 3,9,17-THSA, is unclear. Their relative lack of reactivity with HsaAB suggests that they may have arisen adventitiously in the mutant. The current studies do not rule out the possibility that the physiological substrate of HsaAB is 3-HSA with a partially degraded side chain.
Although the activity of HsaAB is lesser than that of other characterized TC-FDMs, it is consistent with that of other cholesterol catabolic enzymes of Mtb. For example, the apparent specificity (kcat/Km) of a bacterial EDTA monooxygenase for MgEDTA2− is 430-fold greater than that of HsaAB (51). Similarly, the apparent specificity of alkanesulfonate monooxygenase for alkanesulfonates was up to 112-fold greater (25). Nevertheless, the relative activity of HsaAB is very similar to that of its flanking enzymes in the cholesterol catabolic pathway, KshA (17) and HsaC (6): the apparent kcat/Km of these enzymes are also two or three orders of magnitude lesser than those of their homologues. It is unclear whether this is characteristic of non-mycobacterial steroid-degrading oxygenases. Although the KmO2app values of other TC-FDMs have not been reported, that of HsaAB (100 ± 10 μm) is remarkably similar to HsaC (90 ± 20 μm). Finally, the relative kcat/Km values of HsaAB and HsaC for 3-HSA (1000 ± 100 m−1 s−1) and 3,4-DHSA (15000 ± 2000 m−1 s−1), respectively, would help minimize intracellular concentrations of the latter, which is toxic to Mtb (6).
HsaA is similar to pHPAH oxygenase (52) in that both utilize FMNH2 and FADH2 with similar efficiencies and that exogenously added flavin does not increase the rate of product formation by either enzyme. Nevertheless, the structure of HsaA suggests that the F-subsite recognizes the isoalloxazine ring of FMNH2 or FADH2 and does not accommodate the entire FADH2 molecule: the adenyl moiety of the latter would protrude into bulk solvent (supplemental Fig. 3). In nitroalkane oxidase from Fusarium oxysporum (PDB entry 2C0U), the protruding moiety mediates subunit interactions. Other bacterial TC-FDMs that transform aromatic compounds preferentially utilize one of the flavins: FMNH2 in the case of pristinamycin IIA synthase (53) and FADH2 in the case of chlorophenol-4-hydroxylase (54), pyrrole-2-carboxylate monooxygenase (55), and p-nitrophenol hydroxylase (56).
Although the closed conformation of the C-terminal flap correlates with the presence of an active site ligand in HsaA, it is unclear how the expression host (E. coli versus Rhodococcus) and the exposure of the enzyme to O2 during purification contribute to the presence of the ligand. Moreover, the functional significance of the different conformations in HsaAO and HsaAC and the octameric state of the latter remains unclear. In the enzyme's closed conformation, the C-terminal flap likely prevents the entry of the reduced flavin, the first substrate to bind in the related pHPAH (28). Nevertheless, modeling studies indicate that the closed conformation better accounts for the low specificity of HsaA for 3,9-DHSA, as described below. It is possible that, in solution, a change in conformation in the C-terminal flap favored by flavin binding might help direct the subsequent entry of the organic substrate. The flap is present in all TC-FDM oxygenases structurally characterized to date, including pHPAH, HpaB (PDB entry 2YYG), HsaA from RHA1 (PDB entry 2RFQ), as well as two related enzymes: pig medium chain acyl-CoA dehydrogenase (PDB entry 2JIF) and nitroalkane oxidase from F. oxysporum (PDB entry 2C0U). In all cases, the enzymes were tetrameric and the flap was in the same conformation as in the HsaAO structure. However, alternate conformations of the flap may not have been observed in four of these cases, because the enzymes were crystallized in the presence of reduced flavin and the corresponding organic substrate. Structural flexibility in pHPAH (48) and HpaB (56) is suggested by elevated B-factors of the C-terminal flap residues, as observed in HsaAO. Finally, it is also possible that octameric HsaAC represents a more stable form of the enzyme present in metabolically quiescent bacterial cells. Regardless of its functional significance, the orientation of the flap in the aerobically purified HsaA from E. coli together with the presence of a ligand in the F-subsite of this preparation correlates with its decreased catalytic activity.
The structural data provide at least two intriguing insights into the substrate specificity of HsaA (Fig. 6, E and F). First, the predicted proximity of the C9 ketone with Asp372 (3.7 Å) may explain why 3,9-DHSA is a poor substrate inasmuch as the 9-OH substitution may disrupt the hydrogen bond between Asp372 and His368. This may ultimately perturb the catalytic function of the latter. Second, the channel that extends from the C17 ketone suggests that the H-subsite can accommodate substrates with partially degraded side chains. This raises the possibility that the physiological substrates of the steroid ring-degrading enzymes have not yet been identified, consistent with the relatively low specificity constants of these enzymes for side chain degraded metabolites.
It remains unclear whether cholesterol catabolism is essential to the pathogenesis of Mtb (6–8). Nevertheless, transposon mutagenesis studies indicate that HsaAB activity is critical for survival in macrophages (4). Further studies of HsaAB should help establish the role of cholesterol catabolism in the pathogenesis of Mtb as well as the catalytic mechanism of TC-FDMs. Indeed, characterization of the ligand bound to HsaAC may be useful in both of these respects.
Supplementary Material
Acknowledgments
We thank the Canadian Light Source (Saskatoon, Saskatchewan, Canada) for access to beamline CMCF1 for X-ray synchrotron data collection. Jie Liu, Mark Okon, Gord Stewart, and Christine Florizone provided skilled technical assistance. Dr. Victor Snieckus and Katherine Yam provided 2,3-dihydroxybiphenyl and HsaC, respectively.
This work was supported by grants from the Canadian Institute for Health Research (to L. D. E. and N. S., respectively) and the Michael Smith Foundation for Health Research (MSFHR) Infrastructure (to N. S.) and Emerging Team programs.
The atomic coordinates and structure factors (codes 3AFE and 3AFF) have been deposited in the Protein Data Bank, Research Collaboratory for Structural Bioinformatics, Rutgers University, New Brunswick, NJ (http://www.rcsb.org/).

The on-line version of this article (available at http://www.jbc.org) contains supplemental Figs. 1–3, text, and references.
C. Dresen, K. C. Yam, and L. D. Eltis, unpublished observation.
- Mtb
- M. tuberculosis
- HsaAB
- 3-hydroxy-9,10-seconandrost-1,3,5(10)-triene-9,17-dione 4-hydroxylase
- 3-HSA
- 3-hydroxy-9,10-seconandrost-1,3,5(10)-triene-9,17-dione
- 3,17-DHSA
- 3,17-dihydroxy-9,10-seconandrost-1,3,5(10)-triene-9-one
- 3,9-DHSA
- 3,9-dihydroxy-9,10-seconandrost-1,3,5(10)-triene-17-one
- 3,9,17-THSA
- 3,9,17-trihydroxy-9,10-seconandrost-1,3,5(10)-triene
- 3,4-DHSA
- 3,4-dihydroxy-9,10-seconandrost-1,3,5(10)-triene-9,17-dione
- 3,4,17-THSA
- 3,4,17-trihydroxy-9,10-seconandrost-1,3,5(10)-triene-9-one
- 3,4,9-THSA
- 3,4,9-trihydroxy-9,10-seconandrost-1,3,5(10)-triene-17-one
- 3-HB
- 3-hydroxybiphenyl
- TC-FDM
- two-component flavin-dependent monooxygenase
- pHPAH
- p-hydroxyphenyl acetate hydroxylase from A. baumanii
- FAD
- flavin adenine dinucleotide
- FMN
- flavin mononucleotide
- HPLC
- high-performance liquid chromatography
- GC-MS
- gas chromatography/mass spectrometry
- r.m.s.d.
- root mean square deviation
- BSTFA
- bis(trimethylsilyl)trifluoroacetamide
- TMCS
- trimethylchlorosilane.
REFERENCES
- 1.Dye C. (2006) Lancet 367, 938–940 [DOI] [PubMed] [Google Scholar]
- 2.Zhang Y. (2005) Annu. Rev. Pharmacol. 45, 529–564 [DOI] [PubMed] [Google Scholar]
- 3.Clark-Curtiss J. E., Haydel S. E. (2003) Annu. Rev. Microbiol. 57, 517–549 [DOI] [PubMed] [Google Scholar]
- 4.Rengarajan J., Bloom B. R., Rubin E. J. (2005) Proc. Natl. Acad. Sci. U.S.A. 102, 8327–8332 [DOI] [PMC free article] [PubMed] [Google Scholar]
- 5.Van der Geize R., Yam K., Heuser T., Wilbrink M. H., Hara H., Anderton M. C., Sim E., Dijkhuizen L., Davies J. E., Mohn W. W., Eltis L. D. (2007) Proc. Natl. Acad. Sci. U.S.A. 104, 1947–1952 [DOI] [PMC free article] [PubMed] [Google Scholar]
- 6.Yam K. C., D'Angelo I., Kalscheuer R., Zhu H., Wang J. X., Snieckus V., Ly L. H., Converse P. J., Jacobs W. R., Jr., Strynadka N., Eltis L. D. (2009) Plos. Pathog. 5, e1000344. [DOI] [PMC free article] [PubMed] [Google Scholar]
- 7.Pandey A. K., Sassetti C. M. (2008) Proc. Natl. Acad. Sci. U.S.A. 105, 4376–4380 [DOI] [PMC free article] [PubMed] [Google Scholar]
- 8.Hu Y., van der Geize R., Besra G. S., Gurcha S. S., Liu A., Rohde M., Singh M., Coates A. (2010) Mol. Microbiol. 75, 107–121 [DOI] [PubMed] [Google Scholar]
- 9.Hunter R. L., Olsen M., Jagannath C., Actor J. K. (2006) Am. J. Pathol. 168, 1249–1261 [DOI] [PMC free article] [PubMed] [Google Scholar]
- 10.Nesbitt N. M., Yang X., Fontan P., Kolesnikova I., Smith I., Sampson N. S., Dubnau E. (2010) Infect. Immun. 78, 275–282 [DOI] [PMC free article] [PubMed] [Google Scholar]
- 11.Rosłoniec K. Z., Wilbrink M. H., Capyk J. K., Mohn W. W., Ostendorf M., van der Geize R., Dijkhuizen L., Eltis L. D. (2009) Mol. Microbiol. 74, 1031–1043 [DOI] [PMC free article] [PubMed] [Google Scholar]
- 12.Yang X., Dubnau E., Smith I., Sampson N. S. (2007) Biochemistry 46, 9058–9067 [DOI] [PMC free article] [PubMed] [Google Scholar]
- 13.van der Geize R., Hessels G. I., van Gerwen R., van der Meijden R., Dijkhuizen L. (2002) Mol. Microbiol. 45, 1007–1018 [DOI] [PubMed] [Google Scholar]
- 14.van der Geize R., Hessels G. I., van Gerwen R., Vrijbloed J. W., van der Meijden P., Dijkhuizen L. (2000) Appl. Environ Microbiol. 66, 2029–2036 [DOI] [PMC free article] [PubMed] [Google Scholar]
- 15.van der Geize R., Hessels G. I., Dijkhuizen L. (2002) Microbiology 148, 3285–3292 [DOI] [PubMed] [Google Scholar]
- 16.van der Geize R., Dijkhuizen L. (2004) Curr. Opin. Microbiol. 7, 255–261 [DOI] [PubMed] [Google Scholar]
- 17.Capyk J. K., D'Angelo I., Strynadka N. C., Eltis L. D. (2009) J. Biol. Chem. 284, 9937–9946 [DOI] [PMC free article] [PubMed] [Google Scholar]
- 18.Lack N. A., Yam K. C., Lowe E. D., Horsman G. P., Owen R. L., Sim E., Eltis L. D. (2010) J. Biol. Chem. 285, 434–443 [DOI] [PMC free article] [PubMed] [Google Scholar]
- 19.Ballou D. P., Entsch B., Cole L. J. (2005) Biochem. Biophys. Res. Commun. 338, 590–598 [DOI] [PubMed] [Google Scholar]
- 20.Galán B., Díaz E., Prieto M. A., García J. L. (2000) J. Bacteriol. 182, 627–636 [DOI] [PMC free article] [PubMed] [Google Scholar]
- 21.Xun L. Y., Sandvik E. R. (2000) Appl. Environ Microbiol. 66, 481–486 [DOI] [PMC free article] [PubMed] [Google Scholar]
- 22.Gisi M. R., Xun L. Y. (2003) J. Bacteriol. 185, 2786–2792 [DOI] [PMC free article] [PubMed] [Google Scholar]
- 23.Valton J., Mathevon C., Fontecave M., Nivière V., Ballou D. P. (2008) J. Biol. Chem. 283, 10287–10296 [DOI] [PMC free article] [PubMed] [Google Scholar]
- 24.Xu Y., Mortimer M. W., Fisher T. S., Kahn M. L., Brockman F. J., Xun L. (1997) J. Bacteriol. 179, 1112–1116 [DOI] [PMC free article] [PubMed] [Google Scholar]
- 25.Eichhorn E., van der Ploeg J. R., Leisinger T. (1999) J. Biol. Chem. 274, 26639–26646 [DOI] [PubMed] [Google Scholar]
- 26.Sucharitakul J., Phongsak T., Entsch B., Svasti J., Chaiyen P., Ballou D. P. (2007) Biochemistry 46, 8611–8623 [DOI] [PubMed] [Google Scholar]
- 27.Sucharitakul J., Chaiyen P., Entsch B., Ballou D. P. (2005) Biochemistry 44, 10434–10442 [DOI] [PubMed] [Google Scholar]
- 28.Sucharitakul J., Chaiyen P., Entsch B., Ballou D. P. (2006) J. Biol. Chem. 281, 17044–17053 [DOI] [PubMed] [Google Scholar]
- 29.Bhandari P., Gowrishankar J. (1997) J. Bacteriol. 179, 4403–4406 [DOI] [PMC free article] [PubMed] [Google Scholar]
- 30.Mathieu J. M., Mohn W. W., Eltis L. D., LeBlanc J. C., Stewart G. R., Dresen C., Okamoto K., Alvarez P. J. (2010) Appl. Environ. Microbiol. 76, 352–355 [DOI] [PMC free article] [PubMed] [Google Scholar]
- 31.Seto M., Kimbara K., Shimura M., Hatta T., Fukuda M., Yano K. (1995) Appl Environ Microbiol. 61, 3353–3358 [DOI] [PMC free article] [PubMed] [Google Scholar]
- 32.Sambrook J., Fritsch E. F., Maniatis T. (1989) Molecular Cloning: A Laboratory Manual, 2nd Ed., Cold Spring Harbor Laboratory, Cold Spring Harbor, NY [Google Scholar]
- 33.Nakashima N., Tamura T. (2004) Appl. Environ. Microbiol. 70, 5557–5568 [DOI] [PMC free article] [PubMed] [Google Scholar]
- 34.Eltis L. D., Iwagami S. G., Smith M. (1994) Protein Eng. 7, 1145–1150 [DOI] [PubMed] [Google Scholar]
- 35.Faeder E. J., Siegel L. M. (1973) Anal. Biochem. 53, 332–336 [DOI] [PubMed] [Google Scholar]
- 36.Bradford M. M. (1976) Anal. Biochem. 72, 248–254 [DOI] [PubMed] [Google Scholar]
- 37.Vaillancourt F. H., Han S., Fortin P. D., Bolin J. T., Eltis L. D. (1998) J. Biol. Chem. 273, 34887–34895 [DOI] [PubMed] [Google Scholar]
- 38.Cornish-Bowden A. (1995) Analysis of Enzyme Kinetic Data, Oxford University Press, New York [Google Scholar]
- 39.Kabsch W. (1993) J. Appl. Crystallogr. 26, 795–800 [Google Scholar]
- 40.Otwinowski Z., Minor W. (1997) Methods Enzymol. 276, 307–326 [DOI] [PubMed] [Google Scholar]
- 41.Kissinger C. R., Gehlhaar D. K., Fogel D. B. (1999) Acta. Crystallogr D. Biol. Crystallogr 55, 484–491 [DOI] [PubMed] [Google Scholar]
- 42.Brünger A. T., Adams P. D., Clore G. M., DeLano W. L., Gros P., Grosse-Kunstleve R. W., Jiang J. S., Kuszewski J., Nilges M., Pannu N. S., Read R. J., Rice L. M., Simonson T., Warren G. L. (1998) Acta Crystallogr. D Biol. Crystallogr. 54, 905–921 [DOI] [PubMed] [Google Scholar]
- 43.Murshudov G. N., Vagin A. A., Dodson E. J. (1997) Acta Crystallogr. D Biol. Crystallogr. 53, 240–255 [DOI] [PubMed] [Google Scholar]
- 44.Collaborative Computational Project (1994) Acta Crystallogr. D Biol. Crystallogr. 50, 760–76315299374 [Google Scholar]
- 45.DeLano W. L. (2002) The PyMOL Molecular Graphics System, DeLano Scientific LLC, San Carlos, CA [Google Scholar]
- 46.Schüttelkopf A. W., van Aalten D. M. (2004) Acta Crystallogr. D Biol. Crystallogr. 60, 1355–1363 [DOI] [PubMed] [Google Scholar]
- 47.Mayo S. L., Olafson B. D., Goddard W. A. (1990) J. Phys. Chem. 94, 8897–8909 [Google Scholar]
- 48.Stewart J. J. (2007) J. Mol. Model 13, 1173–1213 [DOI] [PMC free article] [PubMed] [Google Scholar]
- 49.Schneidman-Duhovny D., Inbar Y., Nussinov R., Wolfson H. J. (2005) Nucleic Acids Res. 33, W363–W367 [DOI] [PMC free article] [PubMed] [Google Scholar]
- 50.Morris G. M., Huey R., Lindstrom W., Sanner M. F., Belew R. K., Goodsell D. S., Olson A. J. (2009) J. Comput. Chem. 30, 2785–2791 [DOI] [PMC free article] [PubMed] [Google Scholar]
- 51.Payne J. W., Bolton H., Jr., Campbell J. A., Xun L. (1998) J. Bacteriol. 180, 3823–3827 [DOI] [PMC free article] [PubMed] [Google Scholar]
- 52.Chaiyen P., Suadee C., Wilairat P. (2001) Eur. J. Biochem. 268, 5550–5561 [DOI] [PubMed] [Google Scholar]
- 53.Thibaut D., Ratet N., Bisch D., Faucher D., Debussche L., Blanche F. (1995) J. Bacteriol. 177, 5199–5205 [DOI] [PMC free article] [PubMed] [Google Scholar]
- 54.Xun L. Y. (1996) J. Bacteriol. 178, 2645–2649 [DOI] [PMC free article] [PubMed] [Google Scholar]
- 55.Becker D., Schräder T., Andreesen J. R. (1997) Eur. J. Biochem. 249, 739–747 [DOI] [PubMed] [Google Scholar]
- 56.Kadiyala V., Spain J. C. (1998) Appl. Environ. Microbiol. 64, 2479–2484 [DOI] [PMC free article] [PubMed] [Google Scholar]
Associated Data
This section collects any data citations, data availability statements, or supplementary materials included in this article.