Abstract
Angiotensin-II (Ang-II) from extracardiac sources and intracardiac synthesis regulates cardiac homeostasis, with mitogenic and growth-promoting effects largely due to altered gene expression. Here, we assessed the possibility that angiotensin-1 (AT1R) or angiotensin-2 (AT2R) receptors on the nuclear envelope mediate effects on cardiomyocyte gene expression. Immunoblots of nucleus-enriched fractions from isolated cardiomyocytes indicated the presence of AT1R and AT2R proteins that copurified with the nuclear membrane marker nucleoporin-62 and histone-3, but not markers of plasma (calpactin-I), Golgi (GRP-78), or endoplasmic reticulum (GM130) membranes. Confocal microscopy revealed AT1R and AT2R proteins on nuclear membranes. Microinjected Ang-II preferentially bound to nuclear sites of isolated cardiomyocytes. AT1R and AT2R ligands enhanced de novo RNA synthesis in isolated cardiomyocyte nuclei incubated with [α-32P]UTP (e.g. 36.0 ± 6.0 cpm/ng of DNA control versus 246.4 ± 15.4 cpm/ng of DNA Ang-II, 390.1 ± 15.5 cpm/ng of DNA L-162313 (AT1), 180.9 ± 7.2 cpm/ng of DNA CGP42112A (AT2), p < 0.001). Ang-II application to cardiomyocyte nuclei enhanced NFκB mRNA expression, a response that was suppressed by co-administration of AT1R (valsartan) and/or AT2R (PD123177) blockers. Dose-response experiments with Ang-II applied to purified cardiomyocyte nuclei versus intact cardiomyocytes showed greater increases in NFκB mRNA levels at saturating concentrations with ∼2-fold greater affinity upon nuclear application, suggesting preferential nuclear signaling. AT1R, but not AT2R, stimulation increased [Ca2+] in isolated cardiomyocyte nuclei. Inositol 1,4,5-trisphosphate receptor blockade by 2-aminoethoxydiphenyl borate prevented AT1R-mediated Ca2+ release and attenuated AT1R-mediated transcription initiation responses. We conclude that cardiomyocyte nuclear membranes possess angiotensin receptors that couple to nuclear signaling pathways and regulate transcription. Signaling within the nuclear envelope (e.g. from intracellularly synthesized Ang-II) may play a role in Ang-II-mediated changes in cardiac gene expression, with potentially important mechanistic and therapeutic implications.
Keywords: Calcium, G-protein Coupled Receptors (GPCR), Gene Regulation, Nuclear Membrane, Transcription, Angiotensin II, Angiotensin Receptor Subtypes, Nuclear Envelope
Introduction
Angiotensin-II (Ang-II)3 is implicated in the regulation of cardiac contractility, cell proliferation, and communication through the activation of specific heptahelical membrane-spanning G-protein coupled receptors (GPCRs). Blockers of the renin-angiotensin system are widely used in the treatment of hypertension and heart failure (1–3). There is increasing evidence that renin-angiotensin system components can act intracellularly (4–6). Extracellular signaling peptides could operate internally following internalization. Alternatively, intracellular action could occur via production of Ang-II within target cells.
Neonatal cardiomyocyte stimulation by high concentrations of glucose or isoproterenol results in the intracellular synthesis and nuclear trafficking of Ang-II (7). Serum-deprived cardiomyocytes release Ang-II into the culture medium and Ang-II concentrations increase 100-fold upon mechanical stretch (8). Internalization of pro-renin into cardiomyocytes leads to the generation of intracellular Ang-II independently of glycosylation (9). Introduction of Ang-II inside the cell has important effects on transmembrane Ca2+ currents, on cardiomyocyte conductance, and potentially on the pathogenesis of cardiac arrhythmias (10). Intracellular Ang-II binding sites have been imaged in renal and hepatocyte nuclei, but whether those receptors represent internalized plasma membrane receptors or a genuine new class of Ang-II receptors (ATRs) remains unclear (11, 12). Despite the fundamental role of Ang-II in the regulation of heart function and gene expression, direct demonstrations of functional ATRs inside cardiac cells are lacking. Accordingly, the current study investigated the subcellular distribution of type 1 and 2 ATRs (AT1R and AT2R, respectively) in native ventricular cardiomyocytes, with particular attention to the nuclear envelope, and assessed evidence for coupling of such intracellular receptors to Ang-II-mediated transcriptional responses.
MATERIALS AND METHODS
Reagents and Antibodies
The following antibodies were used for immunoblotting: AT1R and AT2R from Santa Cruz (Santa Cruz, CA) and Alomone Labs (Jerusalem, Israel); calpactin-I, GM130, and GRP-78 from BD Biosciences (Franklin Lakes, NJ); histone from Cell Signaling (Danvers, MA); and nucleoporin 62 from ABCAM (Cambridge, MA) (see supplemental Table S1 for more details). All secondary antibodies were from Jackson ImmunoResearch Laboratories (West Grove, PA). Candesartan was kindly provided by AstraZeneca (Mississauga, Ontario) and valsartan by Novartis (Dorval, Quebec). The primers for quantitative real time polymerase chain reaction (qPCR) assays were purchased from SuperArray (Frederick, MD)/Invitrogen. Unless otherwise specified, all reagents were of molecular biology grade and obtained from Fisher or Sigma.
Isolation of Cardiomyocytes
Male Wistar adult rats (200–300 g) were anesthetized with a combination of ketamine/xylazine (10 mg/kg of body weight intraperitoneally) and treated with heparin (1.0 units/kg of body weight). All animal handling procedures were approved by the Animal Research Ethics Committee of the Montreal Heart Institute and the procedures complied with guidelines established in the Guide for the Care and Use of Laboratory Animals (NIH Publication 65-23, revised 1996). Hearts were exposed via sternotomy, rapidly excised, and immersed in ice-cold Tyrode solution containing: 140 mm NaCl, 5.5 mm KCl, 1 mm MgCl2, 0.3 mm KH2PO4, 10 mm dextrose, 5 mm HEPES, 2 mm CaCl2, adjusted to pH 7.5 with NaOH. Left ventricular cardiomyocytes were isolated using a Langendorff perfusion system. The hearts were cannulated via the ascending aorta and in situ retrograde perfusion of the coronary arteries was started with 200 μm Ca2+ in modified Tyrode solution (140 mm NaCl, 5.5 mm KCl, 1 mm MgCl2, 0.3 mm NaH2PO4, 5 mm HEPES, and 10 mm dextrose adjusted to pH 7.5 with NaOH). After perfusion for 3 min at 6 ml/min, the hearts were perfused with calcium-free Tyrode solution for an additional 5 min. Subsequently, hearts were enzymatically digested by perfusion with Ca2+-free Tyrode solution containing 0.5 mg/ml of type II collagenase for ∼45 min. When the heart was softened, the left ventricle was minced into small pieces in Kraftbruhe medium (20 mm KCl, 10 mm KH2PO4, 10 mm glucose, 40 mm mannitol, 70 mm l-glutamic acid, 10 mm β-hydroxybutyric acid, 20 mm taurine, 10 mm EGTA, and 0.1% albumin, pH 7.5, NaOH). To promote cell dissociation, the solution and tissue fragments were resuspended with a transfer pipette and the suspension was filtered through a 200-μm nylon mesh. Cardiomyocytes were separated from non-cardiomyocyte cells by sedimentation (3 × 200 g, 3 min), the supernatant was discarded or used for fibroblast isolation, and the final cardiomyocyte pellet was resuspended in Joklik's minimal essential medium (25 mm NaHCO2, 1.2 mm MgSO4, 1 mm dl-carnitine, 1 mm CaCl2, adjusted to pH 7.5 with NaOH). All solutions were constantly aerated with 5% CO2, 95% O2, and solutions and cells were kept at 37 °C throughout the isolation process. Ca2+ tolerant, rod-shaped ventricular cardiomyocytes (75–90% of all cells) were used on the day of isolation or snap frozen at −80 °C for subsequent biochemical studies. Nuclei from total cardiac tissue were isolated in a similar general fashion, details are provided in supplemental data.
Isolation of Cardiomyocyte Nuclei
Cardiomyocytes, isolated as described above, were washed 4 times with phosphate buffer before the isolation of myocardial nuclei. Cells were suspended in a hypo-osmotic buffer (10 mm Tris, 1 mm MgCl2, 10 mm NaCl, 5 mm CaCl2, adjusted to pH 7.4 with HCl) for 30 min at 4 °C. The cells were sedimented at 1000 × g for 10 min and then resuspended in 20 ml of hypo-osmotic buffer and sonicated for 90 s in a Branson 3200 sonifier. Triton X-100 was added to the sonicated preparation to a final concentration of 0.1% and then the preparation was centrifuged at 1000 × g for 10 min. The supernatant containing the membrane and cytoplasmic fractions was kept as a control for biochemical analysis. The resulting pellet was resuspended in 15 ml of MC buffer (2.2 m sucrose, 10 mm Tris, 1 mm MgCl2, 0.1 mm phenylmethylsulfonyl fluoride, adjusted to pH 7.4 with HCl). This suspension was transferred to high resistance centrifugation tubes underlaid with 2.5 ml of MC buffer and centrifuged at 100,000 × g for 60 min. The pellet containing the nuclear fraction was resuspended in buffer containing 20 mm Na-HEPES, 25% (volume/volume) glycerol, 0.42 m NaCl, 1.5 mm MgCl2, 0.2 mm EDTA, 0.2 mm EGTA, 0.5 mm phenylmethylsulfonyl fluoride, 0.5 mm dithiothreitol, 25 μg/ml of leupeptin, 0.2 mm Na3VO4, with a final pH of 7.4 (NaOH) or 1× transcription buffer (see below), and either used freshly or aliquoted, snap frozen with liquid nitrogen, and stored at −80 °C. Membrane proteins were separated from cytoplasmic proteins by centrifugation at 100,000 × g (Beckman TLA 100.3 rotor) for 60 min. The membrane protein containing pellets were re-suspended in extraction buffer containing 25 mm Tris-HCl (pH 7.4), 5 mm EGTA, 5 mm EDTA, 1 mm Na3VO4, 0.5 mm 4-(2-aminoethyl)benzenesulfonyl fluoride, 1 mm iodoacetamide, 1 mm β-mercaptoethanol, 10 μg/ml of aprotinin, 10 μg/ml of leupeptin, and 1 μg/ml of pepstatin, supplemented with 1% Triton X-100 and stored at −80 °C. Protein concentrations were determined by Bradford assay using a NanoDrop ND-1000 Spectrophotometer (Wilmington, DE).
Non-cardiomyocyte Cell and Tissue Extracts Used to Test Selectivity of the Cardiomyocyte Isolation Procedure
The purity of isolated cardiomyocytes was assessed by Western blot, using protein extracts prepared from cardiomyocytes, fibroblasts, smooth muscle cells, endothelial cells, and rat brain homogenates. For the isolation of fibroblasts, the supernatant obtained from the cardiomyocyte isolation was centrifuged at 2500 × g for 10 min. The pellet was resuspended in Dulbecco's minimal essential medium containing 10% fetal calf serum (Biochrom), 1% penicillin/streptomycin, and plated on 58-cm2 dishes. Four hours later, the medium was changed and adherent cells were washed free of debris and non-attached cells. Smooth muscle and endothelial cells were obtained by a previously described method (13). The rat brain homogenate protein fraction was a gift from Dr. Ling Xiao.
Immunoblot Analysis
Samples were separated by SDS-PAGE on 8% (w/v) acrylamide running gels with 4% (w/v) acrylamide stacking gels. Proteins were transferred onto polyvinylidene difluoride membranes at 300 mA and 4 °C for 60 min in a transfer buffer consisting of 25 mm Tris base, 192 mm glycine, and 20% (v/v) ethanol. Membranes were blocked for 120 min with a solution of 5% skimmed milk powder (w/v) and 0.1% (v/v) Tween 20 in PBS at ambient temperature. Following blocking, membranes were incubated with the primary antibody (supplemental Table S1) overnight at 4 °C with continuous mixing. The following day, membranes were washed (4 × 12 min) with a solution containing 0.5% (w/v) skimmed milk powder and 0.1% (v/v) Tween 20 in PBS, then incubated with the appropriate horseradish peroxidase-conjugated secondary antibody (60 min at room temperature). Membranes were thoroughly washed with PBS containing Tween 20 (4 × 12 min) and immunoreactive bands were revealed using Enhanced Chemiluminescence Reagent in conjunction with Bio-Max MR film (PerkinElmer Life Sciences). Preliminary experiments were performed to establish exposure times that avoided film saturation and permitted quantification. To ensure equal protein loading, blots were stripped and stained using Ponceau S (0.5% Ponceau S, 1% glacial acetic acid, in deionized water). Immunoblots were scanned (1200 dpi) and band intensities quantified with Quantity One 1D analysis software (Bio-Rad Laboratories).
Confocal Microscopy and Deconvolution
Freshly isolated cardiomyocytes were plated on 18-mm laminin (10 μg/ml)-coated coverslips for 60 min (37 °C, 95% O2, 5% CO2), fixed with 2% paraformaldehyde for 20 min, and permeabilized with blocking buffer comprising 2% normal donkey serum and 0.2% (v/v) Triton X-100 in PBS for 60 min. After extensive washing to remove the excess serum, cells were incubated overnight at 4 °C with the primary antibody diluted in PBS containing 1% normal donkey serum and 0.05% Triton X-100. Coverslips were then rinsed several times with PBS and incubated for 60 min at room temperature with secondary antibody (Alexa 488-conjugated anti-rabbit antibody or Alexa 555-conjugated anti-mouse antibody diluted in 1% normal donkey serum and 0.05% Triton X-100). After a final wash with PBS, coverslips were mounted and fixed on glass slides with a drop of a mixture containing 0.1% diazabicyclo(2.2.2)octane (DABCO)/glycerol. Fluorescence images were acquired using a Zeiss LSM 510 confocal fluorescence microscope (Carl Zeiss, Oberkochen, Germany). Composite images were created using Zeiss LSM510 software. For every secondary antibody, control experiments were performed omitting the primary antibody to confirm the specificity of the primary antibody. Nuclei were visualized using Hoechst 33342 or DRAQ5 nucleic acid stain. Image stacks were digitally deconvolved (0.01% threshold, lowest background and real signal/noise values) for 25 iterations to reduce out-of-focus light using the Maximum Likelihood Estimation algorithm and the appropriate experimentally determined point spread function with Huygens Professional software (version 3.1.0p1, Scientific Volume Imaging, Hilversum, The Netherlands). Files were stored in ICS format and exported to PowerPoint (Microsoft, Redmond, WA).
[α-32P]UTP RNA Transcription Initiation Assay
Transcription initiation assays were performed using freshly isolated cardiomyocyte nuclei as previously described (14). Briefly, a mixture of nuclei (treated with ligand where indicated), 1× transcription buffer (50 mm Tris, 0.15 m KCl, 1 mm MnCl2, 6 mm MgCl2, 1 mm ATP, 2 mm dithiothreitol, 1 unit/μl of RNase inhibitor, pH adjusted to 7.4 with NaOH) and [α-32P]UTP were incubated for 30 min at 30 °C. CTP and GTP were omitted to prevent chain elongation. Following treatment with DNase (10 units/μl), nuclei were solubilized (10 mm Tris-HCl, pH 8.0, 10 mm EDTA, and 1% SDS), aliquots transferred onto Whatman GF/C glass fiber filters (Sigma-Aldrich, Oakville, Ontario, Canada), washed with 5% trichloroacetic acid, and air dried. 32P incorporation was measured by Cerenkov counting in a β-counter. The DNA concentration was determined spectrophotometrically and 32P incorporation is expressed as dpm/ng of DNA.
RNA Extraction, Reverse Transcription, and qPCR
Total RNA was extracted from cardiomyocyte nuclei using the TRIzol method (Invitrogen) after homogenization with a motor-driven mixer. The concentration, quality, and purity of total RNA were determined using a BioAnalyzer (Genome Innovation Center, Montreal, Quebec). Total RNA was treated with DNase I (10 units for 15 min at 37 °C) to remove potential contamination by genomic DNA. cDNA templates for PCR amplification were synthesized from 1 μg of total RNA with a reverse transcriptase kit (SuperArray).
Quantitative PCR (qPCR) was performed using SuperArray SYBR Green PCR kits and a Stratagene MX3000P qPCR system. Quantitative measurements were performed in triplicate and normalized to the average of three housekeeping internal controls (glyceraldehyde-3-phosphate dehydrogenase, β2-macroglobin, and heat shock protein 90-kDa α, class B member 1). All reactions included 2 μl of cDNA and 0.5 μm primers. Standard curves were made from 10-fold serial dilutions of cDNA pools containing high concentrations of the gene of interest. Data were collected and analyzed using MX3000P software. Relative gene expression was calculated using the comparative threshold cycle (Ct) method (15). The sequences of primers used for qPCR are shown in supplemental Table S2.
Ca2+ Imaging
Ca2+ concentration ([Ca2+]) was measured in isolated nuclei with the ratiometric calcium indicator Fura-2/AM (Sigma). Fura-2/AM was prepared daily as a 5 mm stock solution in dimethyl sulfoxide. Right after the isolation, freshly isolated cardiomyocyte nuclei were resuspended in 0.5 ml of loading buffer containing 25 mm HEPES, 100 mm KCl, 2 mm K2HPO4, and 4 mm MgCl2. Fura-2/AM was added to the suspension of isolated nuclei for a final concentration of 7.5 μm and incubated on ice for 45 min. After an initial loading period, nuclei were washed of extracellular Fura-2/AM by centrifugation (2700 × g for 5 min, 4 °C) to remove non-incorporated Fura-2/AM and were then added with 1000 μl of loading buffer containing 800 nm CaCl2 onto the fluorodish. Ang-II, the AT1 agonist L162313, the AT2 agonist CGP42112A, inositol 1,4,5-trisphosphate (IP3), or vehicle (dimethyl sulfoxide) were added, directly in the bath, close to a single nucleus, pre-treated or free of selective blockers (candesartan, PD123177, or 2-aminoethoxydiphenyl borate (2-APB)) to produce a final concentration of 10 μm. A microspectrofluorimeter (IonOptix, Milton, MA) was used for fluorescence measurements. Excitation wavelengths were 340 and 380 nm. Fluorescence emission was detected at 509 nm and expressed as the ratio of the two excitation wavelengths (F340/F380). The amplitudes of [Ca2+] responses were calculated by subtraction of the baseline F340/F380 ratio from peak values. Ca2+ concentrations were determined by calibrating the fluorescent signal by sequential addition of 9 μm ionomycin plus 1 mm CaCl2 to obtain the maximal fluorescence ratio (Rmax) and 4 mm EGTA to obtain the minimum fluorescence ratio (Rmin). Autofluorescence was determined by subtracting fluorescence from non-loaded nuclei and from the fluorescence produced by Fura-2-loaded nuclei.
Assessment of Intracellular Components of Angiotensin Synthesis System
Cardiomyocytes were lysed by sonication in ice-cold 1 m acetic acid containing a protease/inhibitor mixture (Sigma S8820). The lysate was sedimented at 15,000 × g for 15 min, and the supernatant was dried in a vacufuge, followed by reconstitution in 1% acetic acid. The samples were applied to a conditioned DSC-18 column (Supelco), washed, and eluted with methanol. The eluted samples were dried and reconstituted in PBS for enzyme-linked immunosorbent assay (ELISA, Peninsula Labs). Ang-II was measured by quantitative competitive ELISA, using a specific anti-Ang-II antibody (Peninsula Labs), which was previously validated by high-performance liquid chromatography chip/mass spectrometric analysis (7). ELISA was performed on anti-Ang-II antibody-coated 96-well dishes. Competitive binding of synthetic biotinylated Ang-II, in the presence of the extracted peptide, was detected with streptavidin-horseradish peroxidase conjugate. A standard curve, generated from binding of a constant amount of biotinylated Ang-II with increasing concentrations of non-biotinylated synthetic Ang-II, was used to calculate the concentration of the peptide in the sample. The concentration of Ang-II in the cell lysates is expressed as femtomoles per milligram of protein. Components of the Ang-II biosynthetic pathway (angiotensinogen, renin, angiotensin converting enzyme, and cathepsin) were quantified in cardiomyocyte lysates by qRT-PCR, as described above.
Statistical Analysis
Data are expressed as mean ± S.E. Analysis of variance with Tukey's post-hoc test was used for statistical comparison. A p value <0.05 was considered statistically significant.
RESULTS
Endogenous AT1 and AT2 Receptors Localize to Nuclei Isolated from Cardiomyocytes and Cardiac Tissue
To examine the intracellular localization of AT1 and AT2 receptors, we isolated membrane, cytosolic, and nuclear fractions from isolated cardiac myocytes and from whole adult rat hearts. In initial studies, we characterized nuclear AT1 and AT2 receptors from intact cardiac tissue preparations. However, to be sure that biochemical results applied specifically to cardiomyocytes, we developed a nucleus-enriched preparation from isolated cardiomyocytes. All results shown in this paper were obtained from cardiomyocyte nuclei, whereas the results from cardiac tissue preparations are provided under supplemental data. The specificity of the isolated cardiomyocyte preparation was characterized by immunoblot with antibodies to various tissue-selective protein markers and cell populations (supplemental Fig. S1A). Isolated cardiomyocytes showed strong immunoreactive signals for myosin heavy chains, and no signals for Van Willebrand factor, neuron-specific enolase, discoidin domain receptor 2, or α-smooth muscle actin, which were found in the expected non-cardiomyocyte samples.
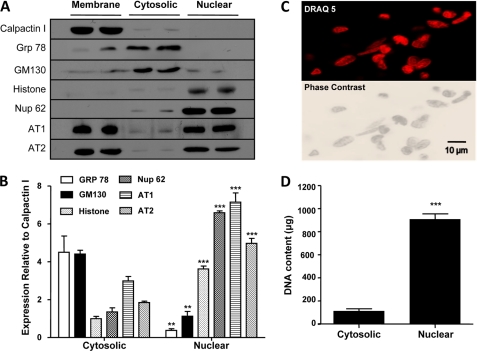
Cellular fractionations were validated by Western blots for calpactin-I (cell membrane, 38 kDa), GRP-78 (endoplasmic reticulum, 78 kDa), Nup62 (nuclear pore central plug, 62 kDa), histone-3 (cell nuclei, 17 kDa), and GM130 (Golgi cisternae, 130 kDa), respectively (Fig. 1A and supplemental Fig. 2A). Both AT1R (∼43 kDa) and AT2R (∼47 kDa) immunoreactivity was detected in the membrane or crude cell fraction A, as were calpactin I, GRP-78, and GM130. After further purification steps, the final nuclear fraction or fraction D was enriched in nucleoporin 62 (Nup62), histone-3, AT1R, and AT2R immunoreactivity. In contrast, fraction D was significantly depleted of calpactin-I, GRP-78, and GM130 immunoreactivity. Both N (Alomone) and C (Santa Cruz) terminal antibodies recognized AT1R and AT2R in the nuclear fraction (D); results shown are with the Santa Cruz antibody. Fig. 1B shows mean intensities of the various bands in cytosolic (fraction B) and nuclear (fraction D) fractions as a ratio of calpactin-I immunoreactivity in the membrane (fraction A), and demonstrates a substantial reduction in non-nuclear markers (GRP-78 and GM130) and increase in nuclear markers (Nup62 and histone-3), along with AT1R/AT2R, in nuclear-enriched preparations. The morphological properties of rat cardiomyocyte nuclei were analyzed as shown in Fig. 1C, and similar to those of nuclei obtained from cardiac tissue (supplemental Fig. S2C). Phase-contrast microscopic imaging (lower panel) reveals the integrity of the nuclei, with an intact nuclear envelope surrounding each nucleus. The freshly isolated nuclei were stained by DNA interactive agents DRAQ5 (Fig. 1C) or Hoechst 33342 dye (supplemental Fig. S2C). Finally, very high concentrations of DNA were found in the isolated nuclei (e.g. nuclear 909 ± 46 μg/ml, versus cytoplasmic supernatant 114 ± 17 μg/ml, p < 0.001, n = 8/group; Fig. 1D). The data in Fig. 1 confirm that both AT1R and AT2R are present in cardiomyocyte nuclei.
FIGURE 1.
Immunoreactivity of angiotensin II receptor subtypes 1 and 2 in purified cardiomyocyte nuclei. A, Western blots showing expression of various markers on cardiomyocyte fractions. Isolated cardiomyocytes were separated into three fractions: membrane, cytosolic, and nuclear. Aliquots (40 μg) of each fraction were resolved on SDS-PAGE and transferred onto polyvinylidene difluoride membranes. After blocking, membranes were incubated with antisera specific for calpactin-I, GRP-78, GM130, histone-3, Nup62, AT1, or AT2. Immunoreactive bands were visualized by ECL. B, mean ± S.E. expression levels for GRP-78, GM130, histone-3, Nup62, AT1, and AT2 normalized to calpactin-I (n = 6/antibody/fraction); **, p < 0.01; ***, p < 0.001 versus respective cytosolic fraction. C, representative images of a purified nuclear preparation. Top, DNA staining with DRAQ 5; bottom, corresponding phase-contrast image. D, mean ± S.E. DNA content (μg/ml) of cytoplasmic or nuclear fraction (n = 8/group). ***, p < 0.001 versus cytoplasmic.
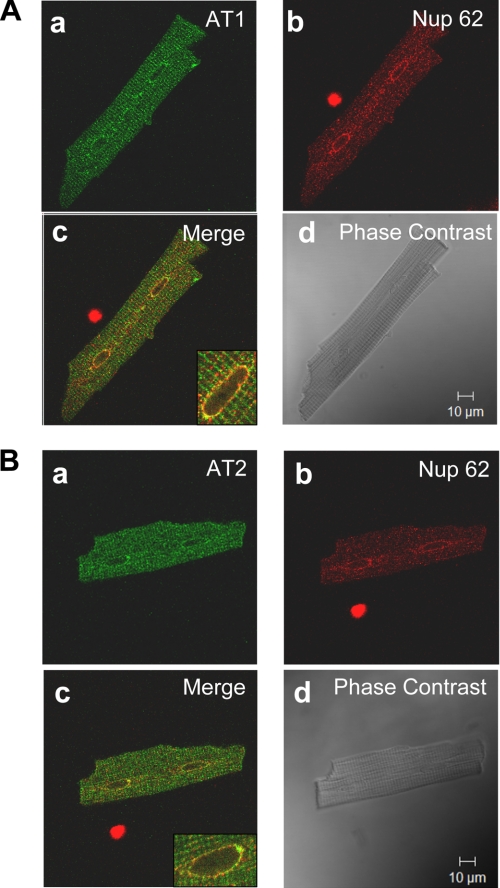
To further investigate the subcellular localization of ATRs, we used confocal immunofluorescence microscopy with deconvolution to image isolated adult rat ventricular cardiomyocytes decorated with antibodies against AT1R and AT2R, as illustrated in Fig. 2. AT1R and AT2R antibodies revealed a striated pattern consistent with the presence at the T-tubular network (Fig. 2, Aa and Ba). Immunofluorescence was also observed around the nucleus. Fig. 2, Ab and Bb, show the same cardiomyocytes stained for Nup62. Fig. 2, Ac and Bc, indicate extensive colocalization, more clearly evident in the higher magnification images in the insets. Phase-contrast reference images of the same cells are shown in Fig. 2, Ad and Bd. Similar results to those shown in Fig. 2 were obtained in all 40 cardiac cells from 10 rats examined for AT1R and all 30 cells from 10 rats studied for AT2R. No signal was observed in cells where the primary antibodies were omitted.
FIGURE 2.
Subcellular distribution of AT1R and AT2R in adult rat ventricular cardiomyocytes. A, panels a–d show representative results from a single cell. Panel a is a confocal image demonstrating the nuclear localization of AT1R (green); b shows nuclear staining with Nup62 (red); c is a superimposed confocal image showing the colocalization of AT1R with Nup62, coincident signals appear in yellow (Merge); d is a phase-contrast image of the same cell. Data are representative of 40 cells from 10 rats. B, panels a–d show representative results from a single cell. Panel a is a confocal image demonstrating the nuclear localization of AT2R (green); b shows nuclear staining with nucleoporin p62 (red); c is a superimposed confocal image showing the colocalization of AT2R with Nup62, coincident signals appear in yellow (Merge); d is a phase-contrast image of the same cell. Data are representative of 30 cells from 10 rats.
Differential Subcellular Trafficking of Ang-II: Extracellular Versus Intracellular Injection
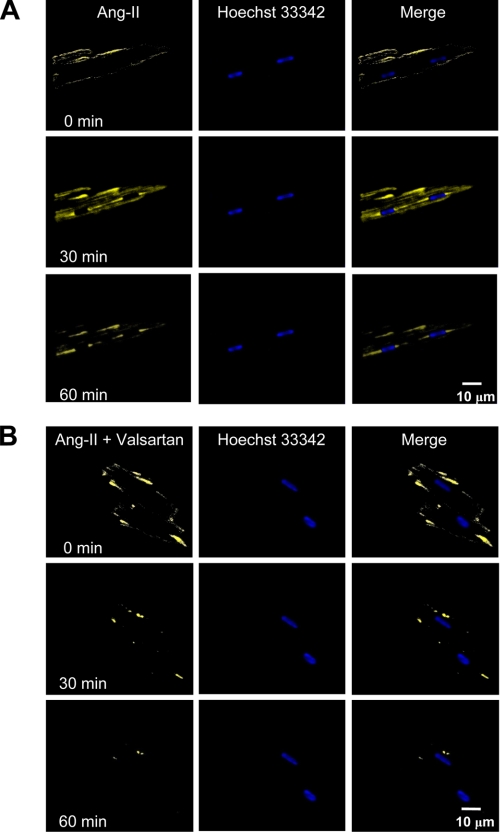
Fig. 3 shows in vitro fluorescence imaging of intracellular Ang-II distribution after extracellular administration of Ang-II labeled with FITC to freshly isolated cardiomyocytes. High resolution images were then acquired by confocal microscopy at 5-min intervals. A 60-min time course confirmed the trafficking of Ang-II inside the cell, without any clear specificity for the nucleus. FITC-labeled Ang-II trafficking was significantly changed by the AT1R antagonist valsartan (10 μm), indicating that binding to cell membrane AT1R receptors is important for Ang-II internalization (Fig. 3B). (For corresponding dark-field images, see supplemental Fig. S3.) The absence of nuclear Ang-II in Fig. 3A argues against endocytosis as the mechanism for ATR localization and suggest that ATRs in the nuclear membrane are most likely a result of intracellular synthesis and trafficking.
FIGURE 3.
Endocytosis and intracellular trafficking of Ang-II. A, FITC-Ang-II (1 nm) was applied extracellularly to the bathing medium. Images are shown immediately after Ang-II application (0 min) and then 30 and 60 min later. Merged images are superimposed fluorescent images. B, cells were preincubated with valsartan (10 μm, for 25 min) prior to administration of Ang-II. Hoechst 33342 was used as a nuclear marker. Z-stacks were acquired every 5 min using a Zeiss LSM-510 confocal microscope (n = 6/group).
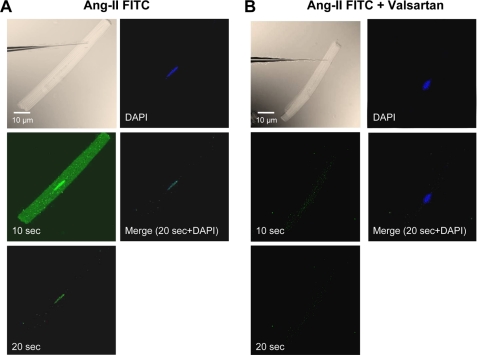
We then microinjected fluorescently labeled Ang-II into the cytoplasm of single cardiomyocytes to analyze the intracellular distribution of Ang-II (Eppendorf Femtojet; 1 nm Ang-II in 50 to 75 fl per cell), as shown in Fig. 4A. Although FITC-Ang-II rapidly diffused throughout the cytoplasm, the fluorescence was enriched or sequestered in the perinuclear region of injected cells 10–20 s after microinjection. The fluorescence decreased rapidly after 20 s but a clear signal at the nucleus (colocalization with 4′,6-diamidino-2-phenylindole) remained at 30 s and disappeared within 30 s thereafter. At no time was fluorescence detected in cells neighboring the microinjected cell, suggesting that the distribution observed in injected cells was due to intracellularly injected FITC-Ang-II and not extracellular diffusion. Similar results were obtained in 10 microinjected cells. Cells that were microinjected with valsartan (100 nm) prior to FITC-Ang-II showed little or no nuclear Ang-II fluorescence (Fig. 4B). The data in Fig. 4 suggest that nuclei have a higher density of Ang-II binding sites than do other subcellular structures.
FIGURE 4.
Subcellular localization of intracellularly applied FITC-Ang-II. A, phase-contrast image showing myocyte immediately prior to injection. FITC-Ang-II (1 nm) was microinjected into freshly isolated cardiomyocytes and fluorescence was visualized 10 and 20 s post-injection. B, cells were microinjected with valsartan (100 nm) prior to FITC-Ang-II injection. 4′,6-Diamidino-2-phenylindole (DAPI) was used as a nuclear marker. No fluorescence was observed in adjacent cells at any time. (Results similar to those in A and B were obtained for 10 microinjected cells from 10 rats each).
Nuclear Ang-II Receptors Regulate Transcription Initiation
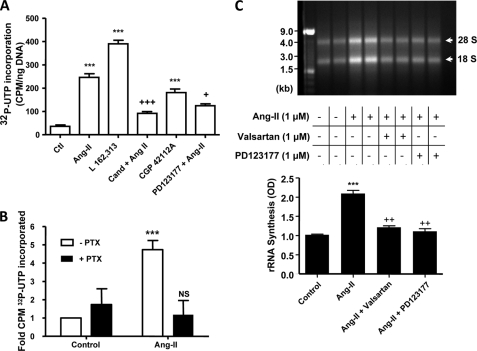
β-Adrenergic receptors were recently shown to stimulate [32P]UTP incorporation in isolated nuclei (16). To determine whether nuclear ATRs are able to control transcription, freshly isolated cardiomyocyte (Fig. 5) or cardiac tissue (supplemental Fig. S4) nuclei were incubated with [α-32P]UTP in addition to ATR ligands and antagonists. Ang-II, L162,313 (AT1R-selective agonist), PD123177 (AT2R-selective agonist), candesartan (AT1R-selective antagonist), and PD123177 (AT2R-selective antagonist) were added directly to the incubation medium (Fig. 5A). Both non-selective and subtype-specific agonists increased the synthesis of RNA, although stimulation with an AT1R agonist produced a greater response than with the AT2R agonist (390 ± 16 cpm/ng of DNA versus 181 ± 7 cpm/ng of DNA, n = 4/group, p < 0.001). Both AT1R and AT2R antagonists significantly reduced the ability of Ang-II to enhance transcription.
FIGURE 5.
AT1R and AT2R in nuclear membranes regulate cardiomyocyte transcription initiation. A, de novo RNA synthesis. Isolated cardiomyocyte nuclear preparations were stimulated with Ang-II, L-162,313 (a non-peptide AT1R-selective agonist), CGP42112A (an AT2R-selective agonist), candesartan plus Ang-II, or PD123177 plus Ang-II (all at 10 μm), as indicated. Following the addition of antagonists candesartan (Cand) and PD123177, nuclei were preincubated for 30 min prior to the addition of Ang-II. ***, p < 0.001 versus control; +, p < 0.05; +++, p < 0.001 versus Ang-II. B, cardiomyocyte nuclei were treated with 5 μg/ml of pertussis toxin for 2 h and then stimulated with Ang-II. Data represent mean ± S.E. of at least five separate experiments performed in triplicate and normalized to control. ***, p < 0.001 versus control; NS, non-significant versus control. C, representative 2% agarose gel electrophoresis of RNA extracted from purified cardiomyocyte nuclei of two separate experiments stained with ethidium bromide (GTP and CTP not omitted) under the following conditions: non-stimulated (lanes 1 and 2); stimulated with Ang-II (10 μm, lanes 3 and 4); stimulated with Ang-II in the presence of valsartan (10 μm, lanes 5 and 6); stimulated with Ang-II in the presence of PD123177 (10 μm, lanes 7 and 8). Results in lanes 1, 3, 5, and 7 are from one experiment, lanes 2, 4, 6, and 8 from another. 1 μg of each sample was loaded. Bottom panel shows mean ± S.E. results as arbitrary optical density (OD) units from 4 different experiments/condition. ***, p < 0.001 versus control; ++, p < 0.01 versus Ang-II.
To determine whether the activation of heterotrimeric G proteins are involved in coupling ATRs within the nuclear membrane to transcription, freshly isolated nuclei were pre-treated for 120 min with pertussis toxin. Pretreatment of isolated cardiomyocyte nuclei with pertussis toxin blocked the ability of Ang-II to increase de novo RNA synthesis (Fig. 5B). Thus, Gi is involved in coupling Ang-II receptors to transcription.
Ribosomal RNA (rRNA) constitutes the most abundant form of RNA. To determine whether stimulation of ATRs on nuclear membranes alters the abundance of rRNA following stimulation of isolated nuclear preparations, total RNA was resolved on 2% agarose gels and visualized by staining with ethidium bromide. Ang-II increased rRNA levels (Fig. 5C). Overall, Ang-II increased the signal strength (18 and 28 S) to 2.09 ± 0.08 OD, compared with 1.02 ± 0.02 OD in control (n = 4/group, p < 0.001). The Ang-II effect was attenuated by valsartan and PD123177, which reduced the signal strength to 1.21 ± 0.04 OD and 1.11 ± 0.07 OD (n = 4/group, p < 0.001), respectively. Responses in total cardiac nuclear preparations (supplemental Fig. S4) were qualitatively similar to results from isolated cardiomyocyte nuclei (Fig. 5).
Nuclear Ang-II Receptors Regulate NFκB Gene Expression
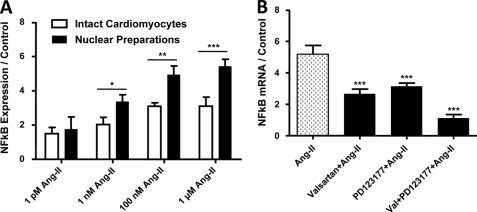
Studies have shown that Ang-II is implicated in the activation of various nuclear transcription factors, including NFκB, and control of NFκB gene transcription is a potentially important regulatory mechanism (17). To assess the possible role of nuclear ATRs in the control of NFκB transcription, we treated isolated cardiomyocytes and purified nuclei with different concentrations of Ang-II. Following RNA isolation, the expression of NFκB was assessed by qPCR and normalized to the average of three housekeeping genes, β2-microglobulin, glyceraldehyde-3-phosphate dehydrogenase, and heat shock protein 90-kDa α, class B member 1. The primer sequences are provided in supplemental Table S2. Ang-II produced clear concentration-response curves, both when applied to intact cells and to nuclei isolated from cardiac tissues (supplemental Fig. S5A). Fig. 6A shows dose-response results obtained from 120-min applications of Ang-II to isolated intact cardiomyocytes (extracellular) or to nuclear preparations isolated from cardiomyocytes. At higher concentrations, there was a significantly greater increase in NFκB mRNA expression following Ang-II application to cardiomyocyte-nuclear preparations versus extracellular application to isolated cardiomyocytes. Preincubation of nuclei with valsartan (10−6 m) or PD123177 (10−6 m) prior to Ang-II administration reduced the Ang-II-induced increase in NFκB mRNA abundance (49 and 39% inhibition, respectively, versus Ang-II alone; n = 4/group, p < 0.001, Fig. 6B), whereas pretreatment with both antagonists abolished the NFκB mRNA expression response to Ang-II (n = 4, p = NS versus control).
FIGURE 6.
Regulation of cardiomyocyte nuclear NFκB mRNA expression by nuclear ATRs. Isolated nuclei were treated for 2 h with Ang-II at different concentrations. NFκB mRNA was quantified by qPCR. A, data are presented as NFκB mRNA expression relative to an average of three housekeeping genes (n = 6/concentration/group). *, p < 0.05; **, p < 0.01; ***, p < 0.001 versus intact cells. B, valsartan (10 μm) or PD123177 (10 μm) significantly reduced the Ang-II (10 μm) induced NFκB activity, whereas pretreatment of nuclei with both AT1 and AT2 antagonists completely abolished the NFκB gene expression response. Results are expressed as mean ± S.E. ***, p < 0.001 versus Ang-II.
Nuclear AT1R Stimulation Induces Nuclear [Ca2+] Responses via IP3R-mediated Mechanisms and Thereby Influences Transcription Initiation
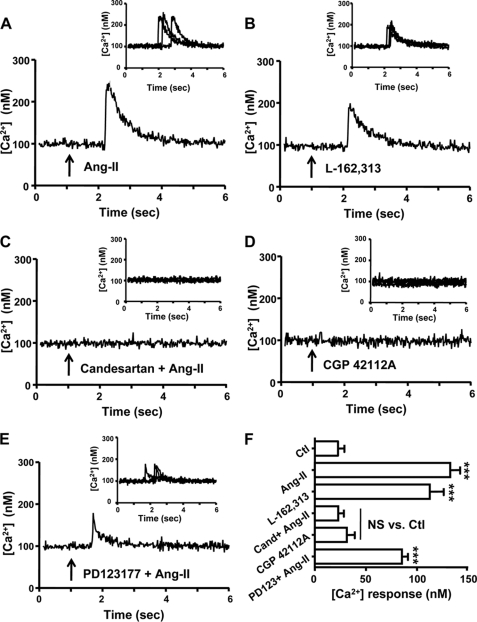
The nuclear envelope serves as a pool for calcium and has been proposed to regulate nuclear Ca2+ signals (18). Several mechanisms for generating Ca2+-transients in the nucleus have been identified (19). The effect of ATR agonists on nuclear Ca2+ concentration was examined in freshly isolated nuclei using the ratiometric fluorescent Ca2+ indicator, Fura-2/AM. Exposure to vehicle alone did not alter nuclear Ca2+ signals (supplemental Fig. S6). Exposure of nuclei to Ang-II (10 μm) produced a prompt increase in [Ca2+]. In the example shown in Fig. 7A, [Ca2+] in nuclei isolated from cardiomyocytes rose from a baseline value of 111 to 243 nm, followed by a return to baseline values. The AT1R-selective agonist L162,313 (10 μm) also caused an intranuclear [Ca2+] response (Fig. 7B), and the Ang-II response was prevented by co-administration with the AT1R inhibitor candesartan (10 μm) (Fig. 7C). Unlike AT1R-selective agonists, the AT2R agonist CGP42112A (10 μm) failed to elicit a nuclear [Ca2+] response (Fig. 7D) and the AT2R antagonist PD123177 (10 μm) was unable to prevent an Ang-II-mediated Ca2+ rise (Fig. 7E). Overall mean data (n = 4/group) are summarized in Fig. 7F, indicating a significant increase in nuclear [Ca2+] with AT1R agonists, which is blocked by an AT1R antagonist. AT2R selective agonists produced no significant change in [Ca2+], nor did antagonism of AT2R significantly attenuate the response to Ang-II. Similar results were obtained in nuclei isolated from whole hearts (supplemental Fig. S7).
FIGURE 7.
Coupling of ATRs to Ca2+ entry in cardiomyocyte nuclear enriched preparations. FURA-2/AM-loaded freshly isolated cardiomyocyte nuclei were seeded onto glass slides and nuclear Ca2+ concentration [Ca2+] was measured with an IonOptix microspectrofluorimeter (λex = 340 and 380 nm; λem = 509 nm). Typical recordings of internal Ca2+ are shown, with recordings from all preparations studied shown in insets, after administration of: A, Ang-II (10 μm); B, L-162,313 (10 μm); C, candesartan (10 μm) plus Ang-II (10 μm); D, CGP42112A (10 μm); E, PD123177 (10 μm) plus Ang-II (10 μm). F, summary of mean ± S.E. [Ca2+] response amplitudes (n = 4/group/condition); ***, p < 0.001 versus control; NS, non-significant versus control; arrows in A–E indicate the time of drug application.
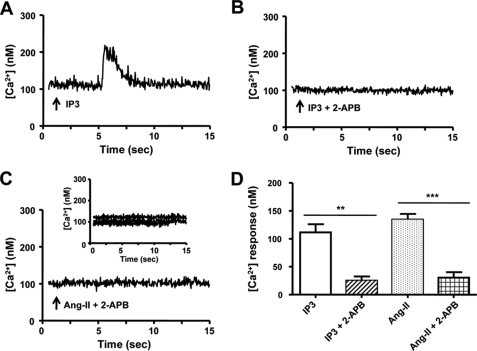
IP3 is an important mediator of nuclear Ca2+ mobilization via nuclear envelope Ca2+ stores (20). We therefore tested the hypothesis that Ang-II regulates nuclear [Ca2+] via IP3-dependent Ca2+ release. As shown in Fig. 8A, IP3 (10 μm) caused a transient increase of [Ca2+] in nuclei isolated from cardiomyocytes, whereas the application of IP3 after pre-treatment with the IP3R blocker 2-APB (10 μm) failed to increase nuclear [Ca2+] significantly (Fig. 8B). Pretreatment of nuclei with 2-APB suppressed the nuclear [Ca2+] responses induced by Ang-II (Fig. 8C). Overall mean ± S.E. [Ca2+] response amplitudes are summarized in Fig. 8D. Similar results were seen for nuclei isolated from whole hearts (supplemental Fig. S8).
FIGURE 8.
IP3-dependent Ca2+ signals from isolated cardiomyocyte nuclei. A, isolated nuclei were exposed to IP3 (10 μm). B, the IP3R blocker 2-APB (10 μm) followed by exposure to IP3. C, the IP3R blocker 2-APB (10 μm) followed by exposure to Ang-II (10 μm). D, summary of [Ca2+] response amplitudes, mean ± S.E. (n = 5/group/condition) **, p < 0.01; ***, p < 0.001; arrows indicate the time of drug application in A–C.
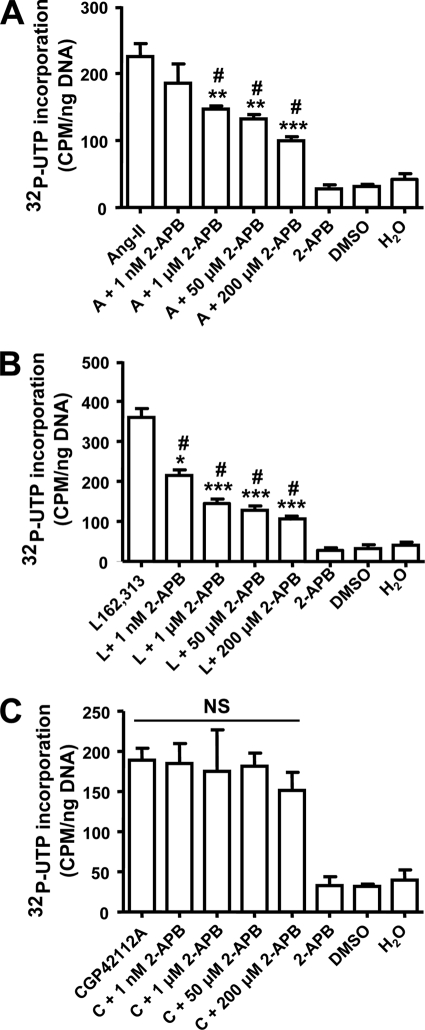
To examine the potential role of the AT1R-mediated nuclear Ca2+ rise in the AT1R-induced transcription response, we pretreated cardiomyocyte nuclei with various concentrations of 2-APB prior to stimulation with Ang-II, L-162,313 (AT1R agonist), or CGP42112A (AT2R agonist). At a threshold concentration of 1 μm, 2-APB significantly decreased transcription initiation by Ang-II (Fig. 9A, n = 4/condition, p < 0.05) and by the AT1R agonist L-162,313 (Fig. 9B, n = 4/condition, p < 0.01). Maximum inhibition with 200 μm APB suppressed but did not eliminate Ang-II and L-162,313 responses, pointing to Ca2+-dependent and Ca2+-independent components. Consistent with the lack of nuclear [Ca2+] response to AT2R stimulation, 2-APB failed to alter CGP42112A-induced transcription initiation (Fig. 9C, n = 4/condition). Similar results were obtained with nuclei isolated from intact cardiac tissues (supplemental Fig. S9).
FIGURE 9.
Role of IP3R signaling for AT1R-mediated transcription initiation. Isolated nuclei were pre-treated with various concentrations of 2-APB for 30 min and incubated with: A, Ang-II; B, L-162,313; or C, CGP42112A (all at 10 μm) and de novo RNA synthesis was measured by [32P]UTP incorporation, mean ± S.E. (n = 4/group/condition). ***, p < 0.001; **, p < 0.01; or *, p < 0.05 versus agonist alone (Ang-II or l-162,313); #, p < 0.05 versus 2-APB (50 μm), dimethyl sulfoxide (DMSO), or H2O alone in A and B; NS, non-significant from each other.
Assessment of Intracellular Components of Angiotensin Synthesis System
We found by ELISA that lysates prepared from isolated cardiomyocytes contain Ang-II at concentrations of 32.7 ± 4.1 fmol/mg of protein in the free cytosol. In addition, we found by qPCR that components required to produce Ang-II such as angiotensin converting enzyme, renin, angiotensinogen, and cathepsin are present inside cardiomyocytes (supplemental Fig. 1B).
DISCUSSION
Main Findings
In the present study, we examined the subcellular localization of Ang-II receptors and their functionality in adult rat ventricular cardiomyocytes. Our data indicate that both AT1R and AT2R localize to and signal at the nuclear envelope, and that this localization is not a result of post-endocytotic trafficking. We also found that nuclear AT1Rs and AT2Rs mediate de novo RNA synthesis, affecting the abundance of both rRNA and NFκB mRNA, and that Gi availability is essential for this Ang-II effect. Ang-II signaling via AT1Rs induces [Ca2+] responses in isolated nuclei via IP3R-dependent pathways, which participate in AT1R-induced de novo RNA synthesis.
Relation to Previous Studies of GPCR Nuclear Receptors
Classically, GPCRs, which comprise the largest protein superfamily in the human genome, are thought to induce intracellular effects via downstream signaling pathways from the plasma membrane (21, 22). In recent years, we and others have confirmed that endothelin (15), β- and α-adrenergic (17, 23), prostaglandin E2 (24) receptors, in addition to the signaling molecules associated with many GPCRs, including adenylate cyclase (25), G-protein coupled receptor kinases (GRK) (26, 27), phospholipase proteins (22), Gi, Gs, and Gq, are present on the nuclear/perinuclear membranes in a constitutive manner, independent of agonist stimulation. Determining the subcellular localization of proteins provides crucial information concerning their function and interaction with other molecules in a specific microenvironment, and thus represents a critical step in genome annotation.
The data in the present paper suggest that Ang-II stimulates cardiomyocyte nuclear receptors to induce transcriptional responses in a Gi-dependent manner, similar to previous observations for cardiac nuclear β-adrenoceptors (17). We found that Ang-II increases [Ca2+]i in nuclear-enriched preparations via AT1Rs. Intracellular Ang-II increases nuclear [Ca2+] in vascular smooth muscle cells, an effect that is blocked by intracellular but not extracellular AT1R blockade (28). Intracellular application of Ang-II increases cell [Ca2+]i in A7r5 vascular smooth muscle cells lacking extracellular ATRs, an effect prevented by AT1R, but not AT2R blockers (29). Nuclear Ca2+ signaling appears to be an important regulator of gene transcription, particularly in neurons (30), and IP3 receptors are involved in nuclear Ca2+ signaling in a muscle cell line (31). Our observation of nuclear AT1R-selective effects to increase nuclear [Ca2+] suggests a potential role for AT1R-mediated nuclear Ca2+ changes in transcriptional responses. The degree of [32P]UTP incorporation enhancement was greater with nuclear preparation application of the AT1R agonist L-162,313 than with the AT2R agonist CGP42112A (Fig. 5A), consistent with the notion that AT1R-related Ca2+-dependent nuclear signaling may participate in transcriptional responses. However, clearly the Ang-II-induced transcriptional response does not depend solely on increased nuclear [Ca2+], because Ang-II-induced rRNA (Fig. 5C) and NFκB (Fig. 6B) RNA expression changes were sensitive to both AT1R and AT2R blockade, and selective AT2R stimulation with CGP42112A-induced transcriptional responses. Further work will be needed to characterize in detail how Ang-II induces nuclear [Ca2+] responses and to define nuclear [Ca2+]-sensitive and -insensitive transcriptional control pathways.
Evidence for a Role of Intracellular Ang-II Signaling
The involvement of an intracellular renin-angiotensin system in biological responses has long been debated. We found significant expression of the components needed to produce Ang-II in cardiomyocyte lysates, and measured cytoplasmic Ang-II concentrations of over 30 fmol/mg of protein, of the same order as reported by Singh et al. (5). Ichihara et al. (32) demonstrated the existence of nonproteolytically activated intracardiac prorenin and elevated tissue Ang-II concentrations in genetically hypertensive rats, which produced end organ damage despite prevention of systemic renin-angiotensin activation. By contrast, the prevention of intracellular prorenin activation fully prevented cardiac fibrosis, despite the maintenance of systemic renin-angiotensin activation and severe hypertension (32). Mice engineered to lack intracardiac angiotensinogen lack cardiac hypertrophy and fibrosis despite hypertension comparable with similarly hypertensive control mice (33). In a rat vascular smooth muscle cell line (A7r5) devoid of plasma membrane ATRs, intracellular (liposome-based) Ang-II delivery enhances cell proliferation, whereas extracellular Ang-II has no effect, with intracellular Ang-II responses suppressed by intracellular application of AT1R or AT2R blockers (29). Independent of systemic hemodynamic effects, local cardiac Ang-II may cause deleterious myocardial remodeling and functional deterioration post-myocardial infarction (34). In summary, there is evidence for a role of intracellular Ang-II signaling in cardiovascular remodeling. Our data, which indicate that AT1Rs and AT2Rs are present on cardiomyocyte nuclei and that Ang-II induces AT1R- and AT2R-mediated transcriptional responses in purified nuclear preparations, suggest that nuclear ATRs may be important mediators of intracellular Ang-II effects on the heart.
Potential Role of Nuclear AT1 and AT2 Receptors in Cardiac Remodeling
Ang-II is an important signaling molecule for cardiac remodeling, although there remains uncertainty over whether cardiac Ang-II signaling alone is enough to induce remodeling or whether Ang-II actions conspire with stressors (like hypertension and excess hemodynamic load) to induce remodeling (35). Overexpression of AT1Rs is a much more potent stimulus to cardiac remodeling than Ang-II overproduction, suggesting that receptor density may be the limiting factor for Ang-II-related remodeling (35). It has long been known that radiolabeled Ang-II preferentially localizes in the perinuclear regions of cardiomyocytes following intraventricular injection (36). The presence of nuclear Ang-II receptors has been demonstrated in the liver (11, 12) and kidneys (37). Similar to our findings, direct application of Ang-II to isolated renal-cortical cell nuclei enhances in vitro transcription of a variety of genes (37). Ang-II activates several nuclear transcription factors and is implicated in the pathogenesis of vascular damage through NFκB (18). NFκB increases the expression of cytokines, enzymes, and adhesion molecules, as well as other products involved in inflammation, proliferation, and hypertrophy (38). Our observations raise the interesting possibility that direct nuclear receptor signaling may be an important mediator of the action of Ang-II to promote cardiac remodeling via altered gene transcription.
Novel Elements and Potential Implications
Our work is the first demonstration, to our knowledge, that cardiomyocytes express nuclear envelope Ang-II receptors that can induce changes in cardiac gene transcription, that Ang-II stimulation of nuclear receptors can induce nuclear [Ca2+] responses via IP3-mediated pathways in an AT1R-specific fashion, and that blockade of IP3R-mediated nuclear [Ca2+] changes suppress the AT1R-mediated effect on cardiac gene transcription. To demonstrate the properties of the nuclear angiotensin system in cardiomyocytes, we developed and applied a novel nucleus-enriched preparation from isolated cardiomyocytes, to our knowledge for the first time in the literature. Our findings provide mechanistic insights into observations suggesting that Ang-II acts through intracellular receptors to regulate cardiomyocyte growth and induce cardiac remodeling (39).
There is growing interest in the development of intracrine pharmacology, small molecule compounds designed to modulate intracellular signaling systems mediated by compounds synthesized within the target cell (40). Lipid-soluble renin inhibitors and angiotensin converting enzyme inhibitor prodrugs are particularly effective in inhibiting ATR-related glioblastoma (41) and neuroblastoma (42) cell growth, pointing to the potential importance of blocking intracellular Ang-II signaling. Further information about the nature, role, and significance of cardiomyocyte nuclear ATRs should contribute to the development of rationally based intracrine pharmacology for cardiac remodeling prevention.
Potential Limitations
Transmembrane receptors can exist in monomeric, homodimeric, or heterodimeric states, and the multimeric state of the receptor may alter its pharmacological properties. AT1 and bradykinin B2 receptors form stable heterodimers, increasing G-protein activation (43). The dimerization status of the nuclear membrane ATRs could have important implications for the intracrine physiology of the renin-angiotensin system, but is beyond the scope of the present study. We have not investigated the specific molecular properties of nuclear ATRs, and it remains to be determined whether they are identical to cell-membrane receptors that are simply targeted to the nucleus, or whether a subset of ATRs with specific molecular compositions are selectively targeted to nuclear membranes.
Angiotensin-receptor blockers are known to suppress angiotensin-related cardiac remodeling. To act via nuclear angiotensin-receptor inhibition they would have to achieve significant intracellular concentrations. The extent to which commercially available agents cross the plasma membranes of heart cells is incompletely known, although telmisartan, a lipid-soluble agent, has been shown to achieve 10-fold concentration in the intracellular compartment versus culture medium (44).
Conclusions
The current study provides novel insights into cardiac intracellular Ang-II signaling by demonstrating the existence of nuclear AT1Rs and AT2Rs that are coupled to RNA transcription and nuclear Ca2+ signaling in cardiomyocytes. Ang-II acts via AT1Rs to induce Ca2+ mobilization in cardiomyocyte nuclear preparations via IP3 receptor-mediated mechanisms. A better understanding of the nature and role of nuclear Ang-II receptors will help to provide a better appreciation of the molecular basis for cardiac remodeling and hopefully lead to the development of improved pharmacological interventions for cardiac disease prevention and therapy.
Supplementary Material
Acknowledgments
We thank Annick Fortier for expert statistical analysis; George Vaniotis, Dr. Balazs Ordog, and Chantal St-Cyr for excellent technical assistance and suggestions; Dr. Clemance Merlen, Dr. Eric Thorin, and Dr. Ling Xiao for providing endothelial cells, smooth muscle cells, and brain tissue; and France Thériault for secretarial support.
This work was supported by Canadian Institutes of Health Research Grant MGP 6957 and the European-North American Atrial Fibrillation Research Alliance (ENAFRA) award from Fondation Leducq.

The on-line version of this article (available at http://www.jbc.org) contains supplemental Figs. S1–S9 and Tables SI and SII.
- Ang-II
- angiotensin-II
- qPCR
- quantitative PCR
- IP3
- inositol 1,4,5-trisphosphate
- 2-APB
- 2-aminoethoxydiphenyl borate
- ELISA
- enzyme-linked immunosorbent assay
- GRK
- G-protein coupled receptor kinases
- GPCR
- G-protein coupled receptor
- ATR
- Ang-II receptor
- PBS
- phosphate-buffered saline
- FITC
- fluorescein isothiocyanate
- rRNA
- ribosomal RNA.
REFERENCES
- 1.Dahlöf B., Devereux R. B., Kjeldsen S. E., Julius S., Beevers G., de Faire U., Fyhrquist F., Ibsen H., Kristiansson K., Lederballe-Pedersen O., Lindholm L. H., Nieminen M. S., Omvik P., Oparil S., Wedel H. (2002) Lancet 359, 995–1003 [DOI] [PubMed] [Google Scholar]
- 2.Wachtell K., Hornestam B., Lehto M., Slotwiner D. J., Gerdts E., Olsen M. H., Aurup P., Dahlöf B., Ibsen H., Julius S., Kjeldsen S. E., Lindholm L. H., Nieminen M. S., Rokkedal J., Devereux R. B. (2005) J. Am. Coll. Cardiol. 45, 705–711 [DOI] [PubMed] [Google Scholar]
- 3.Groth W., Blume A., Gohlke P., Unger T., Culman J. (2003) J. Hypertens. 21, 2175–2182 [DOI] [PubMed] [Google Scholar]
- 4.De Mello W. C. (2006) Regul. Pept. 133, 10–12 [DOI] [PubMed] [Google Scholar]
- 5.Singh V. P., Le B., Khode R., Baker K. M., Kumar R. (2008) Diabetes 57, 3297–3306 [DOI] [PMC free article] [PubMed] [Google Scholar]
- 6.Re R. N., Cook J. L. (2007) Nat. Clin. Pract. Cardiovasc. Med. 4, 549–557 [DOI] [PubMed] [Google Scholar]
- 7.Singh V. P., Le B., Bhat V. B., Baker K. M., Kumar R. (2007) Am. J. Physiol. Heart Circ. Physiol. 293, H939–H948 [DOI] [PubMed] [Google Scholar]
- 8.Sadoshima J., Xu Y., Slayter H. S., Izumo S. (1993) Cell 75, 977–984 [DOI] [PubMed] [Google Scholar]
- 9.Peters J., Farrenkopf R., Clausmeyer S., Zimmer J., Kantachuvesiri S., Sharp M. G., Mullins J. J. (2002) Circ. Res. 90, 1135–1141 [DOI] [PubMed] [Google Scholar]
- 10.De Mello W. C. (1998) Hypertension 32, 976–982 [DOI] [PubMed] [Google Scholar]
- 11.Booz G. W., Conrad K. M., Hess A. L., Singer H. A., Baker K. M. (1992) Endocrinology 130, 3641–3649 [DOI] [PubMed] [Google Scholar]
- 12.Tang S. S., Rogg H., Schumacher R., Dzau V. J. (1992) Endocrinology 131, 374–380 [DOI] [PubMed] [Google Scholar]
- 13.Battle T., Arnal J. F., Challah M., Michel J. B. (1994) Tissue Cell 26, 943–955 [DOI] [PubMed] [Google Scholar]
- 14.Boivin B., Chevalier D., Villeneuve L. R., Rousseau E., Allen B. G. (2003) J. Biol. Chem. 278, 29153–29163 [DOI] [PubMed] [Google Scholar]
- 15.Livak K. J., Schmittgen T. D. (2001) Methods 25, 402–408 [DOI] [PubMed] [Google Scholar]
- 16.Boivin B., Lavoie C., Vaniotis G., Baragli A., Villeneuve L. R., Ethier N., Trieu P., Allen B. G., Hébert T. E. (2006) Cardiovasc. Res. 71, 69–78 [DOI] [PubMed] [Google Scholar]
- 17.Meberg P. J., Kinney W. R., Valcourt E. G., Routtenberg A. (1996) Brain Res. Mol. Brain Res. 38, 179–190 [DOI] [PubMed] [Google Scholar]
- 18.Malviya A. N., Rogue P. J. (1998) Cell 92, 17–23 [DOI] [PubMed] [Google Scholar]
- 19.Zima A. V., Bare D. J., Mignery G. A., Blatter L. A. (2007) J. Physiol. 584, 601–611 [DOI] [PMC free article] [PubMed] [Google Scholar]
- 20.Gerasimenko O., Gerasimenko J. (2004) J. Cell Sci. 117, 3087–3094 [DOI] [PubMed] [Google Scholar]
- 21.Bockaert J., Pin J. P. (1999) EMBO J. 18, 1723–1729 [DOI] [PMC free article] [PubMed] [Google Scholar]
- 22.Gether U. (2000) Endocr. Rev. 21, 90–113 [DOI] [PubMed] [Google Scholar]
- 23.Wright C. D., Chen Q., Baye N. L., Huang Y., Healy C. L., Kasinathan S., O'Connell T. D. (2008) Circ. Res. 103, 992–1000 [DOI] [PMC free article] [PubMed] [Google Scholar]
- 24.Bhattacharya M., Peri K. G., Almazan G., Ribeiro-da-Silva A., Shichi H., Durocher Y., Abramovitz M., Hou X., Varma D. R., Chemtob S. (1998) Proc. Natl. Acad. Sci. U.S.A. 95, 15792–15797 [DOI] [PMC free article] [PubMed] [Google Scholar]
- 25.Willard F. S., Crouch M. F. (2000) Immunol. Cell Biol. 78, 387–394 [DOI] [PubMed] [Google Scholar]
- 26.Martini J. S., Raake P., Vinge L. E., DeGeorge B. R., Jr., Chuprun J. K., Harris D. M., Gao E., Eckhart A. D., Pitcher J. A., Koch W. J. (2008) Proc. Natl. Acad. Sci. U.S.A. 105, 12457–12462 [DOI] [PMC free article] [PubMed] [Google Scholar]
- 27.Sorriento D., Ciccarelli M., Santulli G., Campanile A., Altobelli G. G., Cimini V., Galasso G., Astone D., Piscione F., Pastore L., Trimarco B., Iaccarino G. (2008) Proc. Natl. Acad. Sci. U.S.A. 105, 17818–17823 [DOI] [PMC free article] [PubMed] [Google Scholar]
- 28.Haller H., Lindschau C., Erdmann B., Quass P., Luft F. C. (1996) Circ. Res. 79, 765–772 [DOI] [PubMed] [Google Scholar]
- 29.Filipeanu C. M., Henning R. H., de Zeeuw D., Nelemans A. (2001) Br. J. Pharmacol. 132, 1590–1596 [DOI] [PMC free article] [PubMed] [Google Scholar]
- 30.Bezin S., Charpentier G., Lee H. C., Baux G., Fossier P., Cancela J. M. (2008) J. Biol. Chem. 283, 27859–27870 [DOI] [PubMed] [Google Scholar]
- 31.Kusnier C., Cárdenas C., Hidalgo J., Jaimovich E. (2006) Biol. Res. 39, 541–553 [DOI] [PubMed] [Google Scholar]
- 32.Ichihara A., Kaneshiro Y., Takemitsu T., Sakoda M., Suzuki F., Nakagawa T., Nishiyama A., Inagami T., Hayashi M. (2006) Hypertension 47, 894–900 [DOI] [PubMed] [Google Scholar]
- 33.Kang N., Walther T., Tian X. L., Bohlender J., Fukamizu A., Ganten D., Bader M. (2002) J. Mol. Med. 80, 359–366 [DOI] [PubMed] [Google Scholar]
- 34.Xu J., Carretero O. A., Lin C. X., Cavasin M. A., Shesely E. G., Yang J. J., Reudelhuber T. L., Yang X. P. (2007) Am. J. Physiol. Heart Circ. Physiol. 293, H1900–H1907 [DOI] [PMC free article] [PubMed] [Google Scholar]
- 35.Reudelhuber T. L., Bernstein K. E., Delafontaine P. (2007) Hypertension 49, 1196–1201 [DOI] [PMC free article] [PubMed] [Google Scholar]
- 36.Robertson A. L., Jr., Khairallah P. A. (1971) Science 172, 1138–1139 [DOI] [PubMed] [Google Scholar]
- 37.Li X. C., Zhuo J. L. (2008) Am. J. Physiol. Cell Physiol. 294, C1034–C1045 [DOI] [PMC free article] [PubMed] [Google Scholar]
- 38.Barnes P. J., Karin M. (1997) N. Engl. J. Med. 336, 1066–1071 [DOI] [PubMed] [Google Scholar]
- 39.Baker K. M., Chernin M. I., Schreiber T., Sanghi S., Haiderzaidi S., Booz G. W., Dostal D. E., Kumar R. (2004) Regul. Pept. 120, 5–13 [DOI] [PubMed] [Google Scholar]
- 40.Re R. N., Cook J. L. (2008) J. Clin. Pharmacol. 48, 344–350 [DOI] [PubMed] [Google Scholar]
- 41.Juillerat-Jeanneret L., Celerier J., Chapuis Bernasconi C., Nguyen G., Wostl W., Maerki H. P., Janzer R. C., Corvol P., Gasc J. M. (2004) Br. J. Cancer 90, 1059–1068 [DOI] [PMC free article] [PubMed] [Google Scholar]
- 42.Chen L., Re R. N., Prakash O., Mondal D. (1991) Proc. Soc. Exp. Biol. Med. 196, 280–283 [DOI] [PubMed] [Google Scholar]
- 43.AbdAlla S., Lother H., Quitterer U. (2000) Nature 407, 94–98 [DOI] [PubMed] [Google Scholar]
- 44.Shao J., Nangaku M., Inagi R., Kato H., Miyata T., Matsusaka T., Noiri E., Fujita T. (2007) J. Hypertens. 25, 1643–1649 [DOI] [PubMed] [Google Scholar]
Associated Data
This section collects any data citations, data availability statements, or supplementary materials included in this article.


