

Abstract
Purpose
Type 2 diabetes mellitus (T2DM) has been associated with reduced peak exercise capacity (V̇O2peak). The causes of this impairment are not clearly established, but evidence suggests that abnormalities in cardiac function play a significant role. We hypothesized that exercise would be associated with impaired cardiac function and hemodynamics in recently diagnosed T2DM, even in the absence of clinically evident cardiovascular complications.
Methods
After baseline normal echocardiography screening, 10 premenopausal women with uncomplicated T2DM (average duration of diagnosed T2DM, 3.6 yr) and 10 healthy nondiabetic women of similar age, weight, and activity levels performed a peak cardiopulmonary exercise test while instrumented with an indwelling pulmonary artery catheter for assessing cardiac function. On separate days, technetium-99m sestamibi (cardolite) imaging was performed to assess myocardial perfusion at rest and peak exercise in seven T2DM and seven control patients.
Results
Resting measures of cardiac hemodynamics were similar in T2DM and control subjects. Absolute V̇O2peak (mL·min−1) and peak cardiac output (L·min−1) tended to be lower in T2DM than in control subjects but did not reach statistical significance. However, pulmonary capillary wedge pressure (PCWP) rose significantly more during exercise in T2DM than in controls (148% vs 109% increase at peak exercise, P < 0.01). Normalized myocardial perfusion index was lower in persons with diabetes than in controls (11.0 ± 3.5 × e−9 vs 17.5 ± 8.1 × e−9, respectively, P < 0.05) and inversely related to peak exercise PCWP (R = −0.56, P < 0.05).
Conclusions
Cardiac hemodynamics during graded exercise are altered in women with recently diagnosed T2DM as demonstrated by the disproportionate increase in PCWP at peak exercise compared with controls subjects. Cardiac abnormalities observed are potentially early signs of subclinical cardiac dysfunction associated with T2DM, which may precede the more greatly impaired cardiac function at rest and with exercise observed in longer established T2DM.
Keywords: PEAK OXYGEN CONSUMPTION, TYPE 2 DIABETES MELLITUS, PULMONARY CAPILLARY WEDGE PRESSURE, HEMODYNAMIC, MYOCARDIAL PERFUSION
Persons with type 2 diabetes mellitus (T2DM) have an impaired ability to carry out exercise even in the absence of clinically evident cardiovascular disease (2,16,26,28,32). For example, peak oxygen uptake (V̇O2peak) is reduced by approximately 20% compared with nondiabetic controls matched for age, weight, and physical activity level (2,16,26,28,32). Understanding the mechanisms of the exercise impairment in T2DM is important because they may be an early reflection of the cardiovascular complications commonly associated with more advanced diabetes (3,22,29).
The mechanisms of the T2DM exercise impairment are not known, and in particular, the purported role of T2DM-related cardiac dysfunction in the exercise impairments is not clearly understood (2,16,26,28,32). Previous work has indicated that resting left ventricular (LV) systolic and diastolic dysfunctions are common in established T2DM (8). Moreover, others have suggested diastolic dysfunction in T2DM as a potential contributor to the exercise abnormality in T2DM based on resting measurements (1,7,11,23,30,31,36). However, direct studies of cardiac function during peak exercise in T2DM are scarce and confounded by lack of measurements performed during exercise stress or in patients with more advanced diabetic complications. In addition, it was not known whether cardiac perfusion is abnormal in T2DM during exercise and whether perfusion abnormalities might be related to functional or hemodynamic impairments. Thus, the purpose of the current study was to invasively evaluate cardiac hemodynamics, function, and perfusion during graded exercise in patients with recently diagnosed diabetes who had no evidence of either systolic or diastolic dysfunction by echocardiography at rest. We evaluated the hypothesis that graded exercise would be associated with impaired cardiac function and hemodynamics in recently diagnosed T2DM, even in the absence of clinically evident resting cardiovascular complications. Women were specifically chosen for the study because preliminary data suggest that women with T2DM may have a greater exercise impairment than their male counterparts compared with nondiabetic gender- and age-similar controls (28).
METHODS
Studies were carried out in 10 moderately obese, sedentary, premenopausal women with uncomplicated T2DM and 10 healthy, nondiabetic women of similar age, weight, and level of physical activity. No subject was more than 140% of ideal body weight. Sedentary behavior was defined as not participating in a regular exercise program (more than one bout of exercise per week). The study was approved by the Colorado Multiple Institutional Review Board, and all subjects gave informed written consent to be studied.
Presence of T2DM was documented by chart review confirming diagnosis of diabetes. Persons with T2DM were included in the study if their diabetes was treated by diet or sulfonylurea drugs, but not insulin, because these subjects tend to have a more advanced disease. Metformin and thiazolidinediones were excluded because of potential effects on lactate metabolism in the former case and endothelial function in the latter (25). Other than sulfonylurea drugs, subjects with T2DM were taking no medicines and were accepted for study only if they had total HbA1c levels <9% on therapy. The duration of diabetes from diagnosis was noted in all patients.
Premenopausal women were chosen to limit the age range in the study because exercise performance is affected by age. Premenopausal status was evaluated in women by history, and all patients were tested in the follicular stage of the menstrual cycle as previously reported (18,27).
Absence of comorbid conditions was confirmed by history, physical examination, and laboratory testing. Resting echocardiograms (Sonos 5500; Royal Philips Electronics, Amsterdam, the Netherlands) were obtained at screening in all subjects to exclude global or regional contractile LV dysfunction, LV hypertrophy, increased LV mass, abnormal LV filling using the mitral inflow Doppler pattern, or evidence of valvular abnormalities using standard criteria established by the American Society of Echocardiography (12,24). Tissue Doppler analysis was not available at the onset of this study; however, during the course of the study, tissue Doppler analysis became available and was performed in the remaining 5 of 10 patients with T2DM and 6 of 10 normal control subjects (Sonos 5500; Royal Philips Electronics; S-3 Sector Probe). In these subjects, measurements of both LV septal and free wall E′ and A′ were obtained. Notably, there were no echocardiographic differences in the mitral inflow Doppler patterns between the subjects evaluated with and without tissue Doppler analysis.
Persons with evidence of ischemic heart disease by history, symptoms, or abnormal resting or exercise electrocardiogram (ECG) were excluded. Additional exclusions included hypertension, peripheral arterial disease, autonomic dysfunction, peripheral neuropathy, microalbuminuria, kidney disease, and smoking (within 2 yr) because these conditions can negatively impact exercise function (26,28).
Healthy control subjects were screened identically to persons with T2DM but were taking no medications.
Study protocol
All subjects underwent a resting echocardiographic examination for the evaluation of LV systolic and diastolic functions as well as interrogation of cardiac chambers and valves. During a screening visit, after history and physical examination, subjects were tested on a bicycle ergometer to V̇O2peak. Both T2DM and normal control subjects underwent a noninvasive cardiopulmonary test, which served as both a familiarization test as well as a screening test for ECG abnormalities suggestive of cardiac ischemia. Two days later, after an overnight fast, patients had a pulmonary artery thermodilution oximetric catheter (Abbott Laboratories) inserted into their pulmonary artery via the right internal jugular vein done in the cardiac catheterization laboratory of the University of Colorado Hospital by one of the investigators (B.M.G.). After catheter insertion, patients performed V̇O2peak testing with measures of cardiac function on the General Clinical Research Center (GCRC). On separate days, a subgroup of patients (T2DM = 7, controls = 7) reported to the nuclear stress testing laboratory of the University of Colorado Hospital for resting and exercise portions of the technetium-99m sestamibi (Cardiolite, Mallinkrodt, Hazelwood, MO) test to assess myocardial perfusion.
Measures of cardiac function
Catheters were inserted into the pulmonary artery for measurements of cardiac output (CO; by both direct Fick and thermodilution methods) (6,9,13,35), arteriovenous oxygen content (A-V̇O2) difference, and intracardiac filling pressures. CO was calculated by the direct Fick method (output = V̇O2/A-V̇O2 difference) using A-V̇O2 difference and pulmonary V̇O2 measurements (6,9,13,35). Assessment of thermodilution, a highly reproducible, well-accepted method, provided a direct and independent measure of CO. The thermodilution CO measurements were obtained using the Hewlett-Packard thermodilution catheter connected to the Hewlett Packard hemodynamic monitoring equipment in the GCRC. The recorder was calibrated to the type of catheter and the amount of injectate with each measurement. Ten milliliters of cold saline was used for each injection by the bolus technique. The morphology of each indicator–dilution curve was observed on the recording device to determine the validity of each measurement. Measurements were made in duplicate at rest and during exercise. If there was a discrepancy between the two measurements, a third measurement was obtained, when feasible within the time restraints of the protocol. Blood for mixed venous oxygen content (MV̇O2) determination was always aspirated from the thermodilution catheter before the thermodilution measurements to avoid destabilization of the thermister at the tip of the catheter from flushing of the lumen with room temperature sterile saline. Right atrial pressure (RAP) and pulmonary artery pressure (PAP) were measured from calibrated recordings at rest and during exercise. To set the zero point for the pressure measurements, disposable fluid-filled transducers were calibrated to zero pressure at 5 cm below the sternal angle and in the midthoracic position between the front and back of the chest with phasic recordings on a Hewlett Packard hemodynamic monitoring system. Thus, by convention, the transducers were positioned in the midatrial level. The transducers were fastened to the gown of each subject with adhesive tape and safety pins, and they were zeroed and recalibrated before collection of any intracardiac pressure data. One transducer recorded RAP, whereas the second one recorded either PAP or pulmonary capillary wedge pressure (PCWP). The position of the transducers was rechecked periodically during the exercise study to maintain appropriate positioning. PCWP was obtained after inflation of a balloon catheter and averaged for three consecutive beats. The PCWP recordings were consistently obtained in end-expiration, and the subject was coached during the measurements. Because this was a fluid-filled system and there was motion of the catheter within the heart during exercise, special attention was given to a consistent measurement of PCWP, both within and between subjects in this study.
Graded peak exercise testing
Subjects performed a graded test to V̇O2peak sitting upright on a bicycle ergometer (Excalibur; Lode, Groningen, the Netherlands) as previously reported (26,28) using a metabolic measurement system (Medgraphics CPX/D; Medical Graphics Corp., St. Paul, MN). After the 3-min rest period, the graded test began at 25 W and increased 25 W every 3 min until attainment of V̇O2peak. The highest 20-s averages of V̇O2 and heart rate (HR) achieved during exercise testing were considered peak values. RER provided a measure of exercise intensity.
Blood pressure, HR, CO, and A-V̇O2 difference were measured at the end of each stage of exercise during the test. Arterial oxygen content was calculated from the saturation obtained by pulse oximetry and the hemoglobin concentration (Hgb) measured from a pulmonary arterial blood sample using the following formula: oxygen content = [Hgb] × 1.36 × oxygen saturation. MV̇O2 content was directly measured from a pulmonary arterial sample using a hemoximeter (OSM-3; Radiometer International). Intracardiac filling pressures (RAP, PAP, and PCWP) were used as independent markers of cardiac function. HR was recorded from the ECG that was constantly available as part of our hemodynamic monitoring. Arterial blood pressure was obtained by sphygmomanometry at rest within the last 30 s of each exercise stage and at peak exercise by the same investigator throughout the study. Mean arterial pressure (MAP) was calculated by the formula MAP = 0.33(SBP − DBP) + DBP. Left ventricular stroke work (LVSW) was calculated as follows: LVSW = (MAP − PCWP) SV × 0.0136, where MAP was used as a surrogate for mean aortic systolic pressure usually obtained with invasive measurements. SV is stroke volume. Systemic vascular resistance (SVR) was calculated according to the following formula:
Blood collection and preparation
Fasting blood was drawn for measurement of HbA1c levels, drawn on the same day as the test but before any procedures or tests had been carried out. These were assayed as previously reported (26,28).
Technetium-99m sestamibi (Cardiolite) stress testing
On two separate days, most subjects (seven per group) came to the nuclear stress test for a 2-d exercise/rest myocardial perfusion study using technetium-99m sestamibi single-photon emission computed tomography (SPECT) imaging.
Stress myocardial perfusion protocols
All patients underwent exercise treadmill testing to age-predicted peak HR. Thirty mCi of technetium-99m sestamibi were injected at peak stress, followed by gated SPECT imaging (Prism 3000 XP; Phillips Medical Systems, Andover, MA). Data were acquired at pixels of 5.34 mm × 5.34 mm size. The rest portion of the study was performed on a separate day after a 30-mCi technetium-99m TC sestamibi injection.
Data processing
Resting echo and SPECT data were analyzed by investigators blinded to patient group. Gated SPECT images were analyzed for end-diastolic LV volume, LV mass, and ejection fraction. Stress/rest myocardial perfusion (a marker of blood flow) was assessed visually and quantified using a myocardial perfusion index (MPI). Stress and rest perfusion SPECT images were scored quantitatively based on a 17-segment model of the left ventricle (4). MPI was defined as mean stress count values divided by mean rest counts, analyzed using 4D-MSPECT software (Invia, Ann Arbor, MI) corrected for dose, decay, and time of imaging.
Statistical analysis
Data are reported as means ± SD. The two groups were compared using an unpaired t-test. Correlations were made using a Pearson product moment correlation coefficient. Results were considered significant if P < 0.05.
RESULTS
Women with T2DM and controls did not differ with regard to age, weight, height, or body mass index (BMI; all P = NS; Table 1). HbA1c was higher in the diabetic patients (P < 0.05). Resting echocardiographic measures showed no systolic or diastolic abnormalities in either controls or persons with T2DM at screening. In the subgroup with tissue Doppler assessment, measurements indicated no abnormalities in either the septum or the free wall (in six healthy controls and five persons with T2DM). The resting E/E′, a noninvasive estimate of resting PCWP, was normal in both groups with no intergroup differences (8.1 ± 0.9 in persons with T2DM and 6.9 ± 1.8 in controls, P = NS). These subjects seemed qualitatively comparable to those who were entered earlier in the study because there were no differences in mitral inflow Doppler measurements between subjects with or without tissue Doppler measurement in either T2DM or control groups. Mitral inflow and tissue Doppler data were consistent with the normal, invasively measured PCWP at rest in both groups.
TABLE 1.
Demographic variables in controls and persons with T2DM.
| Controls (N = 10) | T2DM (N = 10) | |
|---|---|---|
| Age (yr) | 39.3 ± 6.6 | 42.5 ± 6.3 |
| Duration of diagnosed diabetes (yr) | — | 3.6 ± 4.6 |
| Height (cm) | 156.3 ± 7.4 | 160.3 ± 4.8 |
| Weight (kg) | 74.3 ± 13.2 | 81.8 ± 11.6 |
| BMI (kg·m−2) | 28.3 ± 3.9 | 31.9 ± 4.3 |
| HbA1c (%) | 5.0 ± 0.4 | 6.9 ± 2.3* |
| Total cholesterol | 194 ± 33 | 188 ± 20 |
Data are given as mean ± SD.
P < 0.05 difference between controls and T2DM.
HbA1c (%), glycosylated hemoglobin.
There were no differences in resting HR, MAP, CO, or PCWP between the two groups (Table 2). Resting RAP and PAP were also similar and within normal range for both groups (Table 2).
TABLE 2.
Resting gas exchange and hemodynamic measures in controls and persons with T2DM.
| Controls (N = 10) | T2DM (N = 10) | |
|---|---|---|
| V̇O2 (mL·kg−1·min−1) | 3.6 ± 0.2 | 3.4 ± 0.3 |
| RER | 0.87 ± 0.07 | 0.85 ± 0.07 |
| HR (beats·min−1) | 84 ± 11 | 86 ± 9 |
| CI (Fick) (L·min−1·m−2) | 2.4 ± 0.3 | 2.5 ± 0.3 |
| CI (thermodilution) (L·min−1·m−2) | 2.5 ± 0.3 | 2.4 ± 0.3 |
| Arteriovenous oxygen difference (vol.%) | 6.2 ± 0.6 | 6.0 ± 0.6 |
| SVR (dyn·s·cm−5) | 1493 ± 282 | 1430 ± 246 |
| MAP (mm Hg) | 87.1 ± 3.5 | 88.8 ± 8.7 |
| RAP (mm Hg) | 6.8 ± 2.5 | 5.5 ± 2.2 |
| Mean pulmonary arterial pressure (mm Hg) | 16.6 ± 3.0 | 17.9 ± 3.1 |
| PCWP (mm Hg) | 8.0 ± 2.2 | 9.5 ± 1.8 |
Data are given as mean ± SD.
There are no significant differences for the two groups between any of the variables in this table.
Formula for calculating SVR is provided in the text.
CI, CO/body surface area.
Values obtained during the peak exercise test are given in Table 3. V̇O2peak was not different between groups expressed in absolute terms (mL·min−1), although it was significantly lower in T2DM than in controls when normalized to kilograms of body weight (by 18%). RPE, RER, and peak HR did not differ between groups and demonstrated a peak exercise effort for both groups (Table 3). Cardiac index (CI) was not significantly different between groups whether measured by direct Fick or thermodilution (Table 3) methods. Peak A-V̇O2 difference did not differ between groups (Table 3). LVSW was also similar between the two subject groups at peak exercise.
TABLE 3.
Peak exercise gas exchange and hemodynamic variables in controls and persons with T2DM.
| Controls (N = 10) | T2DM (N = 10) | |
|---|---|---|
| V̇O2peak (mL·kg−1·min−1) | 22.3 ± 4.2 | 18.7 ± 2.3* |
| V̇O2peak (mL·min−1) | 1639.9 ± 336.8 | 1519.8 ± 248.6 |
| RER | 1.14 ± 0.05 | 1.18 ± 0.05 |
| RPE | 17.1 ± 1.4 | 16.6 ± 1.8 |
| Watts | 123 ± 27.5 | 110 ± 21.1 |
| HR peak (beats·min−1) | 166 ± 15 | 169 ± 8 |
| CO (Fick) (L·min−1) | 13.5 ± 2.1 | 13.0 ± 1.9 |
| CI (Fick) (L·min−1·m−2) | 7.6 ± 1.1 | 7.1 ± 0.8 |
| CO (thermodilution) (L·min−1) | 16.2 ± 3.5 | 14.7 ± 2.3 |
| CI (thermodilution) (L·min−1·m−2) | 9.1 ± 1.6 | 7.9 ± 1.1 |
| Arteriovenous oxygen difference (vol.%) | 12.1 ± 1.4 | 11.8 ± 1.8 |
| SVR (dyn·s·cm−5) | 608 ± 112 | 668 ± 120 |
| LVSW (g·m−1) | 104 ± 24 | 101 ± 19 |
| MAP (mm Hg) | 107.6 ± 7.3 | 117.7 ± 12.6† |
| RAP (mm Hg) | 10.8 ± 3.1 | 10.7 ± 3.8 |
| Mean pulmonary arterial pressure (mm Hg) | 30.3 ± 6.7 | 34.0 ± 1.5 |
| PCWP (mm Hg) | 16.7 ± 3.7 | 23.6 ± 3.9‡ |
Data are given as mean ± SD.
Formula for calculating SVR is provided in the text.
P < 0.05, difference between controls and T2DM.
P = 0.06, difference between controls and T2DM.
P < 0.01, difference between controls and T2DM.
CI, CO/body surface area; V̇O2peak, peak oxygen consumption.
Systemic MAP at peak exercise was numerically higher in persons with T2DM than controls, but this did not reach significance (P = 0.06, Table 3). There were no significant differences in peak mean RAP or mean PAP between groups at peak exercise (Table 3). SVR also did not differ between groups at peak exercise. However, the increase in PCWP at peak exercise was significantly greater in T2DM (rising from 9.5 ± 1.8 to 23.6 ± 3.9 mm Hg (148% increase)) than in controls (rising from 8.0 ± 2.2 to 16.7 ± 3.7 mm Hg (109% increase)) (Table 3; Fig. 1). This difference in PCWP was not present for the two groups at rest and only developed during exercise and was noted at every workload beginning with 25 W and continuing through all progressive workloads to maximally tolerated effort. The PCWP rise was not correlated with the increase in MAP or the SVR in either group.
FIGURE 1.

PCWP increases disproportionately more with increasing work rate during graded exercise to V̇O2peak in women with T2DM (upper panel) compared with nondiabetic controls (lower panel).
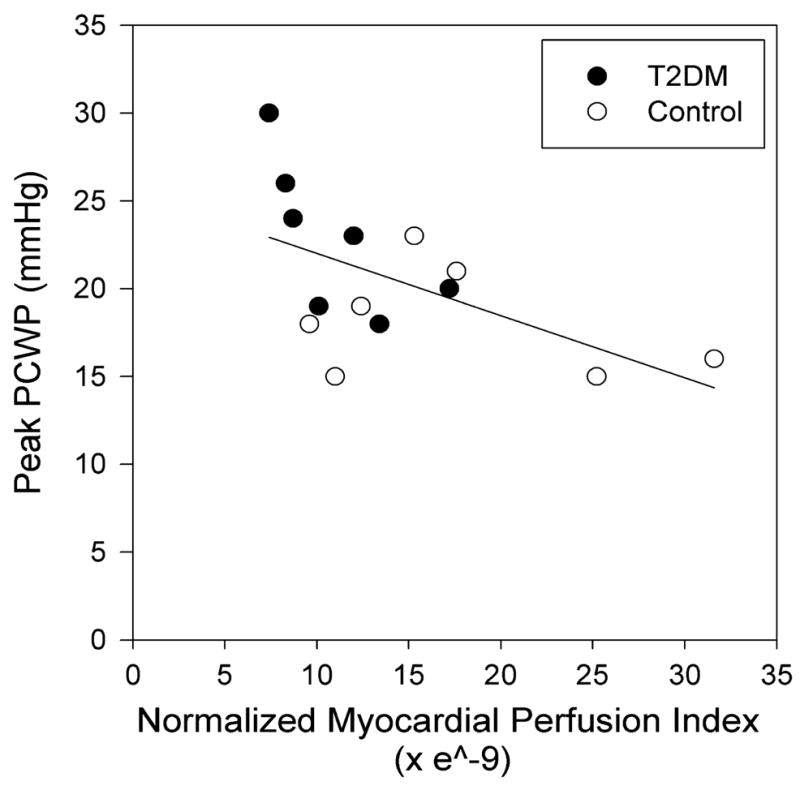
None of the 14 patients who participated in the myocardial perfusion substudy had visually evident myocardial perfusion defects. Stress counts normalized to myocardial mass (a measure of global myocardial perfusion) were significantly lower in persons with T2DM versus controls (4.28 ± 0.75 and 6.60 ± 2.15, respectively, P < 0.02) (Table 4), whereas there was no difference in rest count distribution (5). MPI did not differ between groups. However, MPI was lower in the diabetic group compared with controls (11.0 ± 3.5 × e−9 and 17.5 ± 8.1 × e−9, respectively, P < 0.05) when normalized by myocardial mass, BMI, and peak exercise double product. There was an inverse relationship between the PCWP response at peak exercise and normalized MPI (R = −0.56, P < 0.05; Fig. 2). We normalized MPI to myocardial mass because fully quantitative measurements of coronary blood flow (i.e., with PET or MRI) are made in milliliters per minute per gram of tissue. Our MPI method is analogous to these techniques. We then normalized to BMI and double product to factor out differences in body habitus or exercise performance. We did this because a larger person’s heart needs to work more to provide adequate organ perfusion versus a small person’s heart. Similarly, if a person exercises harder (i.e., achieves a higher HR or blood pressure), coronary blood flow would increase to account for the higher metabolic demand.
TABLE 4.
Results of nuclear stress (technetium-99m sestamibi) tests in controls versus persons with T2DM.
| Controls (N = 7) | T2DM (N = 7) | |
|---|---|---|
| Age (yr) | 41 ± 7 | 43 ± 6 |
| BMI (kg·m−2) | 28.3 ± 3.2 | 32.1 ± 5.2 |
| Mean rest counts | 493.1 ± 138.4 | 420.0 ± 106.7 |
| Mean stress counts | 834.8 ± 216.4 | 656.9 ± 139.4* |
| MPI (ratio) | 1.66 ± 0.33 | 1.44 ± 0.22 |
| Normalized MPI | 17.5 ± 8.1 × e−9 | 11.0 ± 3.5 × e−9† |
| Resting LV mass (g) | 138.6 ± 22.3 | 138.1 ± 18.2 |
| Mean stress counts/resting myocardial mass (g) | 6.60 ± 2.15 | 4.28 ± 0.75† |
| Resting end-diastolic volume (mL) | 85.43 ± 20.11 | 81.29 ± 19.70 |
| Resting ejection fraction (%) | 78.43 ± 7.67 | 73.43 ± 10.9 |
These tests were performed in 14 of the participants from the main study.
MPI is normalized by LV mass, BMI, and rate pressure product, which is HR × SBP. Ejection fraction is calculated by the formula, LVEF = [(end-diastolic volume − end-systolic volume)/end-diastolic volume] × 100.
LV, left ventricular.
P = 0.06, difference between persons with T2DM and controls.
P < 0.05, difference between persons with T2DM and controls.
FIGURE 2.
MPI is inversely related to PCWP at peak exercise in T2DM and nondiabetic subjects. MPI is normalized by myocardial mass (g), BMI (kg·m−2), and peak exercise double product (mm Hg × HR). Open circles denote subjects with T2DM; closed circles, nondiabetic subjects.
DISCUSSION
Patients with recently diagnosed T2DM but no evidence of cardiac dysfunction at rest by echocardiography exhibited an abnormally increased PCWP response during graded exercise compared with healthy subjects. At peak exercise, the elevated PCWP was inversely correlated with impaired myocardial perfusion. The finding of elevated PCWP, collected using invasive methods, suggests the presence of cardiac dysfunction during exercise in persons with recently diagnosed T2DM that may be related to impaired cardiac perfusion associated with T2DM. Importantly, the exaggerated PCWP responses were found in all diabetic subjects tested and occurred in subjects screened for, and who demonstrated, normal systolic and diastolic functions at rest.
Cardiac dysfunction and exercise intolerance have been widely described in patients with T2DM (2,3,16,22,23,26,28,29,32). For example, previous studies using noninvasive measurements have suggested abnormal resting LV systolic and diastolic functions in patients with advanced diabetes (3,22,29). Furthermore, two recent echocardiographic studies suggested a direct relationship between resting diastolic function and exercise capacity in subjects with the metabolic syndrome or diabetes compared with healthy controls (21,36). Early invasive studies demonstrated elevated LV end-diastolic pressure and decreased LV filling rates in the resting state in patients with advanced diabetes (31). However, in all of these studies, cardiac measures were made in the resting state and among patients with T2DM across a broad range of disease history and comorbidities. In contrast, using invasive methods, the current study evaluated cardiac function during exercise in patients with recently diagnosed T2DM who demonstrated no evidence of resting LV systolic dysfunction or diastolic dysfunction by echocardiography or perfusion defects by nuclear imaging. We found no differences in the HR, SV, or CO responses at peak exercise between groups. We also observed no significant differences in absolute V̇O2 at peak exercise although V̇O2peak in milliliters per kilogram per minute was lower in persons with diabetes than controls as had been previously reported (27). These subjects may differ from individuals previously studied by our group and others due to rigorous prestudy exclusion of cardiovascular disease by baseline echocardiogram. Although these data indicate that cardiac and systemic exercise performance was not significantly impaired in these recently diagnosed T2DM subjects, we observed a profound increase in PCWP with exercise in the subjects with T2DM that was not observed in healthy counterparts.
The accentuated PCWP response during exercise in people with T2DM, and in particular those with short disease duration, has not been previously reported. This finding is clinically significant in that it indicates an elevated filling pressure for a given amount of ventricular volume. Importantly, this condition is thought to precede the development of overt cardiac dysfunction and is commonly observed in patients with LV cardiac failure (15).
There are a number of factors that could be related to the abnormal rise in exercise PCWP including LV systolic dysfunction, diastolic dysfunction, or an increase in SVR (cardiac afterload). In the current study, we found no evidence of resting LV systolic dysfunction either with echocardiography or nuclear imaging in the persons with T2DM as LV ejection fraction (LVEF) was normal and no different from that of control subjects. There was also no significant difference in the LVSW response to exercise between groups. CO was also similar at peak exercise in both groups. It is plausible that incomplete LV emptying because of reduced LVEF or contractility during exercise could lead to our observation of elevated PWCP; however, in light of the similar peak exercise cardiac functional measures, we interpret these data to suggest that LV systolic dysfunction is an unlikely or at least an incomplete explanation for the abnormal elevation in PCWP.
Alternatively, the abnormal PCWP response during exercise in diabetic subjects is consistent with a finding of diastolic dysfunction. Abnormal diastolic function of the left ventricle is associated with prolonged ventricular relaxation time, and thus, there would be an excessively elevated LV filling pressure, as seen using our invasive measure of PCWP. This pathophysiologic state results in alterations in ventricular filling that can also be analyzed by noninvasive techniques using tissue Doppler echocardiography. For example, Ha et al. (10) used noninvasive measurement of ventricular tissue velocities during low to moderate exercise to describe blunted systolic and diastolic tissue velocities in T2DM subjects compared with control subjects. The significance of the study by Ha et al. was that resting tissue Doppler measurements were normal in the T2DM subjects, and tissue contractile abnormalities only developed with the onset of low- and moderate-intensity exercises. Our invasively obtained data are consistent with these echocardiographic findings in that we found no evidence of hemodynamic or cardiac dysfunction at rest in these T2DM subjects but that they demonstrated an abnormal increase in PCWP that began with the lowest work rate and continued to increase until peak exercise. Given the previous data suggesting a relationship between resting diastolic function and exercise capacity (21,36), the present data would seem to support a functional role for abnormal diastolic function during exercise in persons with early diabetic disease. Although we did not obtain echocardiography measurements during exercise in the current study, our results provide invasive evidence for diastolic dysfunction during exercise in subjects with early diabetes and directly support the noninvasive findings of a prior study by Ha et al. (11) in nondiabetic subjects with exertional dyspnea.
Other possible explanations for an accentuated rise in PCWP with exercise include decreased ventricular compliance and increased afterload related to an elevated MAP. We noted that MAP at peak exercise tended to be higher in T2DM than in control subjects; however, there was no correlation between this measure and PCWP at peak exercise. Furthermore, there were no differences in rest or peak SVR between persons with T2DM and controls, suggesting that vasodilatory reserve was not a major factor.
In contrast, our findings from the technetium Tc 99m sestamibi substudy suggested that myocardial perfusion obtained at peak exercise was reduced in T2DM compared with controls. This observation supports a model wherein subclinical hypoperfusion at the microvascular level may be one factor related to impaired cardiac function in T2DM. Recently, cardiac imaging with SPECT has been used for the noninvasive estimation of coronary flow reserve, a marker of myocardial vascular function (33,34) and is comparable with invasive intracoronary measurements of blood flow (33). Technetium-99m SPECT imaging has been demonstrated to be an accurate and simple way to noninvasively estimate coronary flow reserve with a good interobserver and intraobserver reproducibility (33). Limitations of this technique include low-resolution–related factors, such as attenuation or partial volume average effects, which may be cancelled out by using the ratio of stress to rest counts. In the current study, we noted that the change in normalized MPI was associated with the PCWP response. It has been previously shown that T2DM subjects with established microvascular disease have been reported to have defects in stress-induced cardiac perfusion and a trend toward decreased diastolic function (17) although this is not universally observed (21). Given the small sample size of the current study, further studies with a larger number of patients will be needed to corroborate the finding of abnormal MPI in patients with “early-onset” diabetes and its relationship with decreased exercise capacity and LV diastolic abnormalities. Thus, these results pose a provocative question in terms of perfusion and potential metabolic mechanisms for our functional hemodynamic findings. Indeed, abnormalities in the T2DM myocardium (e.g., diabetic cardiomyopathy) may have their pathogenesis in several important processes including impaired calcium homeostasis, advanced glycation end-products, activation of the renin–angiotensin system, increased oxidative stress, mitochondrial dysfunction, and altered myocardial substrate metabolism (3). It is likely that these changes are present early in the natural history of insulin resistance and may be manifest as alterations in cardiac function as demonstrated by the elevated PCWP responses in this study. Our study supports the notion that diabetes-related cardiomyopathy begins very early in the pathogenesis of insulin resistance and T2DM.
Other, noncardiac components of oxygen delivery or extraction could also cause impairment in exercise performance in T2DM including increased capillary basement membrane thickening, greater blood viscosity (19,20), or skeletal muscle and mitochondrial abnormalities (14). Future studies should explore the various etiologic factors possibly responsible for the exercise impairment observed in T2DM.
In contrast to prior studies, we found that the decrease in V̇O2peak in T2DM compared with controls was less than previously observed (2,16,26,28,32). Our small sample size may have played a role, or alternatively, lack of differences may be due to patient selection bias compared with prior studies given that patients were volunteering for cardiac catheterization. In addition, patients were required to have normal cardiac function at rest by echocardiography. Given that patients were early in the course of T2DM by diagnosis, PCWP differences may have been the earliest sign of altered cardiac mechanics. Because only women were studied, these results may not be generalizable to men. Women were studied exclusively in this study for two reasons. First, we have observed that women with T2DM perform worse with regard to exercise tolerance than men with T2DM compared with their nondiabetic counterparts (28). In addition, subject homogeneity likely facilitates ascertaining whether significant differences between diabetic and nondiabetic subjects exist.
CONCLUSIONS
In conclusion, cardiac hemodynamics during graded exercise are altered in newly diagnosed T2DM as reflected by a disproportionate increase in PCWP compared with controls. Increased PCWP was inversely correlated with decreased regional myocardial perfusion in T2DM. These abnormalities may contribute to the impaired exercise responses often described in this patient group. Future work should specifically address cardiac function abnormalities during exercise as related to cardiac energetics and metabolism as potential mechanisms of exercise intolerance in T2DM.
Acknowledgments
Results of the current study do not constitute endorsement by the ACSM. The authors are very grateful to the 20 participants for their participation. Funding support was provided to Dr. Regensteiner by NIH grant no. R55 DK53776 and by the General Clinical Research Center NIH grant no. M01-RR00051. Dr. Reusch is supported by VA merit review funding. The authors also thank the Medical and Nursing Staff of the Cardiac Catheterization Laboratory and the General Clinical Research Center who gave generously of their time for this study. The authors also thank Vermed, Inc., for their generous donation of ECG electrodes for all of our exercise studies.
References
- 1.Ahmed SS, Jaferi GA, Narang RM, Regan TJ. Preclinical abnormality of left ventricular function in diabetes mellitus. Am Heart J. 1975;89(2):153–8. doi: 10.1016/0002-8703(75)90039-3. [DOI] [PubMed] [Google Scholar]
- 2.Baldi JC, Aoina JL, Whalley GA, et al. The effect of type 2 diabetes on diastolic function. Med Sci Sports Exerc. 2006;38(8):1384–8. doi: 10.1249/01.mss.0000228954.90591.95. [DOI] [PubMed] [Google Scholar]
- 3.Boudina S, Abel ED. Diabetic cardiomyopathy revisited. Circulation. 2007;115(25):3213–23. doi: 10.1161/CIRCULATIONAHA.106.679597. [DOI] [PubMed] [Google Scholar]
- 4.Cerqueira MD, Weissman NJ, Dilsizian V, et al. Standardized myocardial segmentation and nomenclature for tomographic imaging of the heart: a statement for healthcare professionals from the Cardiac Imaging Committee of the Council on Clinical Cardiology of the American Heart Association. Circulation. 2002;105(4):539–42. doi: 10.1161/hc0402.102975. [DOI] [PubMed] [Google Scholar]
- 5.Christian TF, Rettmann DW, Aletras AH, et al. Absolute myocardial perfusion in canines measured by using dual-bolus first-pass MR imaging. Radiology. 2004;232(3):677–84. doi: 10.1148/radiol.2323030573. [DOI] [PubMed] [Google Scholar]
- 6.Conway J, Lund-Johansen P. Thermodilution method for measuring cardiac output. Eur Heart J. 1990;11(Suppl I):17–20. doi: 10.1093/eurheartj/11.suppl_i.17. [DOI] [PubMed] [Google Scholar]
- 7.Di Bonito P, Moio N, Cavuto L, et al. Early detection of diabetic cardiomyopathy: usefulness of tissue Doppler imaging. Diabet Med. 2005;22(12):1720–5. doi: 10.1111/j.1464-5491.2005.01685.x. [DOI] [PubMed] [Google Scholar]
- 8.Fang ZY, Yuda S, Anderson V, Short L, Case C, Marwick TH. Echocardiographic detection of early diabetic myocardial disease. J Am Coll Cardiol. 2003;41(4):611–7. doi: 10.1016/s0735-1097(02)02869-3. [DOI] [PubMed] [Google Scholar]
- 9.Feustel PJ, Perkins RJ, Oppenlander JE, Stratton HH, Cohen IL. Feasibility of continuous oxygen delivery and cardiac output measurement by application of the Fick principle. Am J Respir Crit Care Med. 1994;149(3 Pt 1):751–8. doi: 10.1164/ajrccm.149.3.8118646. [DOI] [PubMed] [Google Scholar]
- 10.Ha JW, Lee HC, Kang ES, et al. Abnormal left ventricular longitudinal functional reserve in patients with diabetes mellitus: implication for detecting subclinical myocardial dysfunction using exercise tissue Doppler echocardiography. Heart. 2007;93(12):1571–6. doi: 10.1136/hrt.2006.101667. [DOI] [PMC free article] [PubMed] [Google Scholar]
- 11.Ha JW, Oh JK, Pellikka PA, et al. Diastolic stress echocardiography: a novel noninvasive diagnostic test for diastolic dysfunction using supine bicycle exercise Doppler echocardiography. J Am Soc Echocardiogr. 2005;18(1):63–8. doi: 10.1016/j.echo.2004.08.033. [DOI] [PubMed] [Google Scholar]
- 12.Henry WL, DeMaria A, Gramiak R, et al. Report of the American Society of Echocardiography Committee on nomenclature and standards in two-dimensional echocardiography. Circulation. 1980;62(2):212–7. doi: 10.1161/01.cir.62.2.212. [DOI] [PubMed] [Google Scholar]
- 13.Higginbotham MB, Morris KG, Williams RS, McHale PA, Coleman RE, Cobb FR. Regulation of stroke volume during submaximal and maximal upright exercise in normal man. Circ Res. 1986;58(2):281–91. doi: 10.1161/01.res.58.2.281. [DOI] [PubMed] [Google Scholar]
- 14.Kelley DE, He J, Menshikova EV, Ritov VB. Dysfunction of mitochondria in human skeletal muscle in type 2 diabetes. Diabetes. 2002;51(10):2944–50. doi: 10.2337/diabetes.51.10.2944. [DOI] [PubMed] [Google Scholar]
- 15.Kitzman DW, Higginbotham MB, Cobb FR, Sheikh KH, Sullivan MJ. Exercise intolerance in patients with heart failure and preserved left ventricular systolic function: failure of the Frank–Starling mechanism. J Am Coll Cardiol. 1991;17(5):1065–72. doi: 10.1016/0735-1097(91)90832-t. [DOI] [PubMed] [Google Scholar]
- 16.Kjaer M, Hollenbeck CB, Frey-Hewitt B, Galbo H, Haskell W, Reaven GM. Glucoregulation and hormonal responses to maximal exercise in non–insulin-dependent diabetes. J Appl Physiol. 1990;68(5):2067–74. doi: 10.1152/jappl.1990.68.5.2067. [DOI] [PubMed] [Google Scholar]
- 17.Kusunoki K, Nomura M, Kageyama N, et al. Detection of coronary arterial microvascular disorders using (99m)Tc-tetrofosmin uptake increase during exercise and coronary blood flow velocity patterns obtained by magnetic resonance imaging. Heart Vessels. 2004;19(1):1–7. doi: 10.1007/s00380-003-0718-8. [DOI] [PubMed] [Google Scholar]
- 18.Lavoie JM, Dionne N, Helie R, Brisson GR. Menstrual cycle phase dissociation of blood glucose homeostasis during exercise. J Appl Physiol. 1987;62(3):1084–9. doi: 10.1152/jappl.1987.62.3.1084. [DOI] [PubMed] [Google Scholar]
- 19.MacRury SM, Small M, MacCuish AC, Lowe GD. Association of hypertension with blood viscosity in diabetes. Diabet Med. 1988;5(9):830–4. doi: 10.1111/j.1464-5491.1988.tb01119.x. [DOI] [PubMed] [Google Scholar]
- 20.McMillan DE. Exercise and diabetic microangiopathy. Diabetes. 1979;28(Suppl 1):103–6. doi: 10.2337/diab.28.1.s103. [DOI] [PubMed] [Google Scholar]
- 21.Moir S, Hanekom L, Fang ZY, et al. Relationship between myocardial perfusion and dysfunction in diabetic cardiomyopathy: a study of quantitative contrast echocardiography and strain rate imaging. Heart. 2006;92(10):1414–9. doi: 10.1136/hrt.2005.079350. [DOI] [PMC free article] [PubMed] [Google Scholar]
- 22.Mustonen JN, Uusitupa MI, Tahvanainen K, et al. Impaired left ventricular systolic function during exercise in middle-aged insulin-dependent and noninsulin-dependent diabetic subjects without clinically evident cardiovascular disease. Am J Cardiol. 1988;62(17):1273–9. doi: 10.1016/0002-9149(88)90273-1. [DOI] [PubMed] [Google Scholar]
- 23.Poirier P, Bogaty P, Garneau C, Marois L, Dumesnil JG. Diastolic dysfunction in normotensive men with well-controlled type 2 diabetes: importance of maneuvers in echocardiographic screening for preclinical diabetic cardiomyopathy. Diabetes Care. 2001;24(1):5–10. doi: 10.2337/diacare.24.1.5. [DOI] [PubMed] [Google Scholar]
- 24.Quinones MA, Otto CM, Stoddard M, Waggoner A, Zoghbi WA. Recommendations for quantification of Doppler echocardiography: a report from the Doppler Quantification Task Force of the Nomenclature and Standards Committee of the American Society of Echocardiography. J Am Soc Echocardiogr. 2002;15(2):167–84. doi: 10.1067/mje.2002.120202. [DOI] [PubMed] [Google Scholar]
- 25.Regensteiner JG, Bauer TA, Reusch JE. Rosiglitazone improves exercise capacity in individuals with type 2 diabetes. Diabetes Care. 2005;28(12):2877–83. doi: 10.2337/diacare.28.12.2877. [DOI] [PubMed] [Google Scholar]
- 26.Regensteiner JG, Bauer TA, Reusch JE, et al. Abnormal oxygen uptake kinetic responses in women with type II diabetes mellitus. J Appl Physiol. 1998;85(1):310–7. doi: 10.1152/jappl.1998.85.1.310. [DOI] [PubMed] [Google Scholar]
- 27.Regensteiner JG, Hiatt WR, Byyny RL, Pickett CK, Woodard WD, Moore LG. Short-term effects of estrogen and progestin on blood pressure of normotensive postmenopausal women. J Clin Pharmacol. 1991;31(6):543–8. doi: 10.1002/j.1552-4604.1991.tb03735.x. [DOI] [PubMed] [Google Scholar]
- 28.Regensteiner JG, Sippel J, McFarling ET, Wolfel EE, Hiatt WR. Effects of non–insulin-dependent diabetes on oxygen consumption during treadmill exercise. Med Sci Sports Exerc. 1995;27(5):661–7. [PubMed] [Google Scholar]
- 29.Roy TM, Peterson HR, Snider HL, et al. Autonomic influence on cardiovascular performance in diabetic subjects. Am J Med. 1989;87(4):382–8. doi: 10.1016/s0002-9343(89)80818-6. [DOI] [PubMed] [Google Scholar]
- 30.Rubler S, Dlugash J, Yuceoglu YZ, Kumral T, Branwood AW, Grishman A. New type of cardiomyopathy associated with diabetic glomerulosclerosis. Am J Cardiol. 1972;30(6):595–602. doi: 10.1016/0002-9149(72)90595-4. [DOI] [PubMed] [Google Scholar]
- 31.Sanderson JE, Brown DJ, Rivellese A, Kohner E. Diabetic cardiomyopathy? An echocardiographic study of young diabetics. Br Med J. 1978;1(6110):404–7. doi: 10.1136/bmj.1.6110.404. [DOI] [PMC free article] [PubMed] [Google Scholar]
- 32.Schneider SH, Amorosa LF, Khachadurian AK, Ruderman NB. Studies on the mechanism of improved glucose control during regular exercise in type 2 (non–insulin-dependent) diabetes. Diabetologia. 1984;26(5):355–60. doi: 10.1007/BF00266036. [DOI] [PubMed] [Google Scholar]
- 33.Storto G, Cirillo P, Vicario ML, et al. Estimation of coronary flow reserve by Tc-99m sestamibi imaging in patients with coronary artery disease: comparison with the results of intracoronary Doppler technique. J Nucl Cardiol. 2004;11(6):682–8. doi: 10.1016/j.nuclcard.2004.08.007. [DOI] [PubMed] [Google Scholar]
- 34.Sugihara H, Yonekura Y, Kataoka K, Fukai D, Kitamura N, Taniguchi Y. Estimation of coronary flow reserve with the use of dynamic planar and SPECT images of Tc-99m tetrofosmin. J Nucl Cardiol. 2001;8(5):575–9. doi: 10.1067/mnc.2001.115934. [DOI] [PubMed] [Google Scholar]
- 35.Taylor BC, Sheffer DB. Understanding techniques for measuring cardiac output. Biomed Instrum Technol. 1990;24(3):188–97. [PubMed] [Google Scholar]
- 36.Wong CY, O’Moore-Sullivan T, Fang ZY, Haluska B, Leano R, Marwick TH. Myocardial and vascular dysfunction and exercise capacity in the metabolic syndrome. Am J Cardiol. 2005;96(12):1686–91. doi: 10.1016/j.amjcard.2005.07.091. [DOI] [PubMed] [Google Scholar]