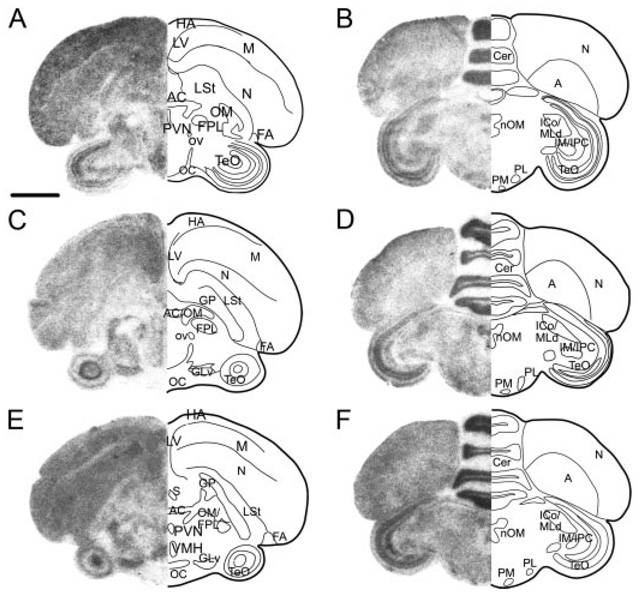
FIG. 9.
StAR, CYP11A1, and 3β-HSD expression is widely distributed but is specific to brain area and gene. Left side of each panel shows low-magnification film images of StAR (A and B), CYP11A1 (C and D), and 3β-HSD (E and F) at two anterior-posterior levels [A, C, and E at the level of the anterior commissure (AC) and B, D, and F at the level of the nucleus of the III cranial nerve (nOM)]. Right side of each panel is schematic drawing highlighting some major anatomical features of the brain section. Not all nuclei are equally distinct for each gene, and each gene shows a unique specific pattern of hybridization. Anterior sections are illustrated in Fig. 7. LV, Lateral ventricle; OM, tractus occipitomesencephalicus; FPL, lateral forebrain bundle; OC, optic chiasm; FLM, fasciculus longitudinalis medialis; Cer, cerebellum. Scale bar, 1 mm.

