

Abstract
A fundamental property of neuronal networks in Ammon's horn is that each area comprises a single glutamatergic cell population and various types of GABAergic neurons. Here we describe an exception to this rule, in the form of granule cells that reside within the CA3 area and function as glutamatergic nonprincipal cells with distinct properties.
CA3 granule cells in normal, healthy rats, similarly to dentate gyrus granule cells, coexpressed calbindin and the homeobox protein Prox1. However, CA3 granule cells were located outside of the dentate gyrus, often hundreds of micrometers from the hilar border, in the lucidum and radiatum layers. CA3 granule cells were present in numbers that were comparable to the rarer GABAergic neuronal subtypes, and their somato-dendritic morphology, intrinsic properties, and perforant path inputs were similar to those of dentate gyrus granule cells. CA3 granule cell axons displayed giant mossy fiber terminals with filopodial extensions, demonstrating that not all mossy fibers originate from the dentate gyrus. Somatic paired recordings revealed that CA3 granule cells innervated CA3 pyramidal and GABAergic cells similarly to conventional mossy fiber synapses. However, CA3 granule cells were distinct in the specific organization of their GABAergic inputs. They received GABAergic synapses from cholecystokinin-expressing mossy fiber-associated cells that did not innervate the dentate granule cell layer, and these synapses demonstrated unusually strong activity-dependent endocannabinoid-mediated inhibition of GABA release.
These results indicate that granule cells in the CA3 constitute a glutamatergic, nonprincipal neuronal subtype that is integrated into the CA3 synaptic network.
Introduction
The dentate gyrus (DG) and CA3 are anatomically and physiologically distinct regions whose interaction plays key roles in hippocampal information processing, including memory and spatial representation functions (Nakazawa et al., 2004; Leutgeb et al., 2007; Bakker et al., 2008; Nakashiba et al., 2008). The DG and CA3 are separated by a V-shaped border connecting the tips of the granule cell (GC) layer with the hilar end of the CA3 pyramidal cell (PC) layer. GCs, the numerically dominant, principal cell type of the DG, are located in a discrete cell layer, with some ectopic GCs present in the hilus or molecular layer (Scharfman et al., 2000, 2007; Williams et al., 2007). Although the generally accepted notion is that GCs are restricted to the DG, some previous studies noted the potential presence of GC-like neurons within the CA3, based on examinations of Golgi-stained material (Amaral and Woodward, 1977; Marti-Subirana et al., 1986) or calbindin (CB) immunoreactivity (Toth and Freund, 1992). However, in contrast to ectopic GCs within the DG that have been studied especially in connection with their potential roles in epilepsy (for review, see Scharfman et al., 2007), such potentially GC-like neurons have not been definitively described even in the normal, healthy CA3. In particular, there is no information available about the properties of CA3 GCs, the degree to which they may differ from their counterparts located in the dentate GC layer, and whether and how they are integrated into the synaptic circuits of the CA3 region.
The questions relating to the identity and properties of GC-like neurons in the CA3 are particularly interesting because GCs, in general, have unique features (Williams and Johnston, 1991; Jonas et al., 1993; Nicoll and Malenka, 1995), including their highly specialized axonal output in the form of the mossy fibers (MFs) (Acsády et al., 1998; Frotscher et al., 2006; Rollenhagen et al., 2007). MFs constitute individually sparse but functionally important links between the DG and CA3, targeting significantly more GABAergic cells (30–50 cells per single MF) than CA3 PCs (10–20 cells) (Acsády et al., 1998). It is currently unclear whether CA3 cells with somato-dendritic morphology similar to GCs emit MFs. It is especially important to determine whether CA3 GCs give rise to MFs, since CA3-derived MFs would demonstrate that not all MFs originate from within the DG and therefore not all MFs contribute directly to the dentate–CA3 interface. Furthermore, it is not known whether CA3 GCs are actively embedded in the hippocampal circuitry through cell-type-specific connections, a key piece of information needed to define CA3 GCs as a distinct neuronal subtype in the hippocampus proper.
Here we show that GCs are present in the CA3 where they contribute to the MF pathway and form synapses on CA3 neurons with properties similar to those MFs that originate from the DG. However, CA3 GCs receive GABAergic inputs that are unique to the CA3 region, indicating that they play functional roles that are likely to be different from those described for DG GCs.
Materials and Methods
Our experimental protocols were approved by the Institutional Animal Care and Use Committee of the University of California, Irvine.
Electrophysiological recordings.
Slices were prepared from adolescent Wistar rats (postnatal days 22–37, both sexes) as described previously (Szabadics and Soltesz, 2009). Briefly, animals were deeply anesthetized with isoflurane, and 350-μm-thick slices were cut in ice-cold artificial CSF [consisting of (in mm) 85 NaCl, 75 sucrose, 2.5 KCl, 25 glucose, 1.25 NaH2PO4, 4 MgCl2, 0.5 CaCl2, and 24 NaHCO3] using an orientation in which the majority of the MFs and dendrites of CA3 PCs were parallel to the surface of the slice and thus were better preserved [described in detail in Bischofberger et al. (2006)]. Following the preparation of the slices, they were transferred to a holding chamber that was kept at room temperature, until the slices were used for recordings. Slices were visualized with an upright microscope (Eclipse FN-1; Nikon) with infrared (750 nm) Nomarksi differential interference contrast (DIC) optics. A recording solution was composed of (in mm) 126 NaCl, 2.5 KCl, 26 NaHCO3, 2 CaCl2, 2 MgCl2, 1.25 NaH2PO4, and 10 glucose. Electrophysiological recordings were performed at 35.5 ± 0.5°C. Recording pipettes were filled with an intracellular solution containing (in mm) 90 potassium gluconate, 43.5 KCl, 1.8 NaCl, 1.7 MgCl2, 0.05 EGTA, 10 HEPES, 2 Mg-ATP, 0.4 Na2-GTP, 10 phosphocreatine-disodium, and 8 biocytin (pH 7.2; 270–290 mOsm; pipette resistance, 3–4.5 MΩ). For studying CA3 GCs, somatic whole-cell patch-clamp recordings were made from cells in the stratum lucidum or in the neighboring stratum radiatum that possessed small cell bodies and no apparent dendrites on the basal pole of the soma (facing the CA3 PC layer). Possible synaptic partners were targeted for recordings in a random manner in the proximity of simultaneously recorded CA3 GCs. Electrical stimulation of presumed entorhinal cortical fibers, or CA3 PCs, was evoked through a high-resistance (0.5 MΩ) tungsten bipolar stimulating electrode placed near the fissure of the DG (stimulation duration, 0.5 ms; intensity, 0.1–3 mA).
The chemicals listed above were purchased from Sigma. Values are mean and SEM. Input resistance was measured from voltage responses to −20 pA current injections; membrane time constant was fitted to the initial part of the voltage response to −100 pA current injections. Membrane capacitance was measured (see also Geiger and Jonas, 2000) as Cm = τm/R, where τm is the weighted time constant of the exponential fit (double exponential) of the (uncompensated) current signal in response to ±5 mV voltage steps and R is the membrane resistance measured from the steady-state current amplitude in response to the same voltage step (5 mV). For statistical analysis, Student's t test (or, where noted, Wilcoxon matched-pairs test) was used. Significant differences were at the level of p < 0.05.
Anatomical methods and analysis.
After the recordings, slices were fixed in 0.1 m phosphate buffer containing 4% paraformaldehyde and 0.1% picric acid for 2 d at 4°C. After fixation, slices were resectioned at 60 μm. For immunocytochemistry, sections were incubated with two of the following primary antibodies raised against parvalbumin (PV; PV28, 1:1000, polyclonal rabbit; Swant), cholecystokinin (CCK; 1:1500, polyclonal mouse; provided by Dr. G. V. Ohning, CURE/Digestive Diseases Research Center, Antibody/RIA Core, Los Angeles, CA), somatostatin (SOM; MAB354, 1:500, monoclonal rat, YC7; Millipore Bioscience Research Reagents), neuropeptide Y (NPY; 208001, 1:1000, polyclonal rabbit; DiaSorin; note that the PV and NPY antibodies were never incubated together), CB (300, 1:1000 monoclonal mouse; Swant), and Prox1 (AB5475, 1:1000, polyclonal rabbit; Millipore Bioscience Research Reagents) overnight in 0.5% Triton X-100 and 2% normal goat serum containing TBS buffer at 4°C. Immunoreactions were revealed using appropriate Alexa 488- or Alexa 594-conjugated secondary goat antibodies against rabbit, mouse, and rat IgGs, and biocytin staining was revealed using Alexa 350-conjugated streptavidin. After determining the immunoreactivity of the recorded cells, sections were further processed to reveal the fine details of the morphology of the cells using the conventional diaminobenzidine (DAB) staining method. Briefly, after washing in phosphate buffer, endogenous peroxidase activity was blocked with 1% H2O2. After another wash, sections were incubated with ABC reagent (Vectastain ABC Elite kit, 1:500; Vector Laboratories) in 0.1% Triton X-100-containing buffer for 1 h at room temperature. Sections were preincubated with DAB and NiCl2, and the reactions were developed with 0.2% H2O2 for 3–10 min. Sections were dehydrated (50, 70, 90, and 95%; absolute ethanol and CitriSolv solutions) on slides, and mounted using DPX mounting medium (Electron Microscopy Sciences). Cells were visualized with epifluorescence or conventional transmitted light microscopy (Axioskop 2; Zeiss). The axonal arbors and the dendrites of cells were drawn using camera lucida using 100× and 60× objectives, respectively. CA3 GCs were fully reconstructed. In the case of GABAergic cells, the dendrites were fully reconstructed from all available sections, and, for clarity, the axons were drawn only from the section that contained the soma. For estimating the total number of GCs in the CA3 using an unbiased, systematic technique, we followed our previously described cell-counting procedures (Toth et al., 1997). Briefly, whole hippocampi of 3-month-old rats were dissected out from paraformaldehyde-fixed brains, extended slightly, frozen, and sectioned transversely at nominally 60 μm with a freezing microtome. The serial order of the sections was kept, and every 10th section was processed for immunocytochemistry for CB and Prox1, as described above. CB and Prox1 double-immunopositive cells that came into focus while the counting investigator focused down through the slice (the dissector height) were counted (West et al., 1991; Buckmaster et al., 1996; Toth et al., 1997).
For electronmicroscopic (EM) investigation of the boutons of the recorded CA3 GCs, the slices were fixed in a fixative similar to that described above for light microscopical investigations, with an additional amount of glutaraldehyde (1.25%). After 2 d in the fixative solution, the slices were washed in 0.1 m phosphate buffer, incubated in a cryoprotector solution (30% sucrose dissolved in 0.1 m phosphate buffer) overnight, and freeze thawed in liquid nitrogen. Next, the slices were resectioned at 60 μm. Biocytin was visualized with the conventional peroxidase ABC method without the use of Triton X-100. The sections were osmicated (osmium-tetroxide; 1% in 0.1 m phosphate buffer; Electron Microscopy Sciences) for 25 min, washed in distilled water several times, contrast enhanced with uranil acetate (1%; Electron Microscopy Sciences) for 40 min, and dehydrated in an ascending series of alcohol. Finally, after propylene-oxide treatment, the sections were soaked in Durcupan (Fluka) overnight and flat-embedded between glass slides and coverslips. After drawing the somato-dendritic and axonal arborizations of the cells, putative giant mossy boutons were remounted on Durcupan blocks and resectioned into 70 nm ultrathin sections. These sections were analyzed on a JEOL transmission electron microscope (JEM-1400), and pictures were taken with a Gatan SC1000 ORIUS CCD camera. EM images were prepared using Adobe Photoshop CS2.
Results
Coexpression of CB and Prox1 indicates the presence of putative GCs within the CA3 area
Golgi staining and CB immunoreactivity suggested the possible presence of GC-like neurons outside of the DG within the CA3 region throughout the septo-temporal extent of the hippocampal formation (Marti-Subirana et al., 1986; Toth and Freund, 1992) (but see Amaral and Woodward, 1977). Since CB is expressed in GCs of the DG as well as in GABAergic neurons (note that many of these CB-positive GABAergic cells project outside of the hippocampus) (Toth and Freund, 1992), we combined CB immunocytochemistry with immunostaining for the homeodomain transcription factor Prox1, which has been reported to strongly label the nuclei of DG GCs (Fig. 1) (Liu et al., 2000; Pleasure et al., 2000). In addition to the expected CB and Prox1 double-labeled cells in the DG GC layer (Fig. 1A,C), there were cells within the CA3 that also coexpressed these markers (Fig. 1A,B, arrowhead) (note that not all CB-positive cells were Prox1 positive). The small soma size and the lack of basal dendrites indicated that the general morphology of these CB- and Prox1-positive cells was similar to GCs in the DG (Fig. 1B). In terms of hippocampal layers, as illustrated in Figure 1, the location of the double-immunopositive cells was typically in the strata lucidum and radiatum. The cell counts from n = 3 animals estimated that there were 330 ± 36 CB- and Prox1-positive cells in the hippocampus. In agreement with previous observations (Marti-Subirana et al., 1986; Toth and Freund, 1992), these cells could be observed along the entire long axis of the hippocampus, without a statistical difference between the septal, middle, and temporal thirds of the hippocampus (data not shown).
Figure 1.

Colocalization of GC markers in a subpopulation of cells in the CA3. A, Low-magnification confocal image of CB (top) and Prox1 (middle; Prox1 immunostaining is restricted to the nuclei of positive cells) immunoreactivity. The bottom panel shows the superimposed images of the CB and Prox1 immunostainings (scale bar, 100 μm; asterisks mark MFs in the CA3 area). B, Some CA3 cells are positive to both CB and Prox1 (horizontal arrows). Note the cells immunopositive for CB only (vertical arrowhead). Note also that dendrite-like, CB-positive processes emerge only from the apical side of double-positive cells, whereas CB-positive but Prox1-negative cells have different multipolar somata (scale bar, 20 μm). C, CB and Prox1 staining of DG GCs.
These results indicated that although the presumed CA3 GCs were not abundant, their frequency of occurrence relative to CA3 principal cells [330 per 250,000, or 0.13%; for the total number of CA3 principal cells, see Andersen et al. (2007) and the references therein] was in the same range as that of some of the rarer GABAergic neurons, including axo-axonic (chandelier) cells (e.g., the relative frequency of axo-axonic cells with respect to principal cells in the DG has been estimated to be about 0.2%) (Dyhrfjeld-Johnsen et al., 2007). It is interesting to note that ectopic GCs in the DG in normal animals also represent ∼0.1–0.2% of the total principal cell population (Scharfman et al., 2007).
Somato-dendritic morphology of the electrophysiologically recorded and subsequently visualized putative GCs in the CA3 area
The information about the location, size, and shape of the CB- and Prox1-positive cells in the CA3 from the immunocytochemical experiments described above served as general cues for the subsequent electrophysiological studies. We performed somatic whole-cell patch-clamp recordings in the strata radiatum and lucidum within the CA3 from cells that, on the infrared (IR)-DIC image, appeared to possess small cell bodies without basal dendrites. The somata of the recorded putative CA3 GCs were located outside (at least by a few hundred micrometers) of the DG. All CA3 GCs (n = 105) (Fig. 2A1–3) displayed somato-dendritic morphology that was similar to DG GCs. The dendrites of the visualized CA3 GCs were oriented toward the stratum lacunosum-moleculare and were densely covered with dendritic spines (Fig. 2A2). The dendrites of the majority (80.9%) of these cells were located exclusively within the CA3 (Figs. 2, 6), with only a minority of cells exhibiting small dendritic branches in the molecular layer of the DG (note that, in the latter analysis, we took into account only those cells whose dendrites appeared to be fully stained and not cut on the surface of the slice).
Figure 2.

Morphology and firing properties of CA3 GCs. A, Whole-cell recorded, biocytin filled, and subsequently reconstructed CA3 GC. A1, Dendritic and axonal arborizations of a CA3 GC (DG, GC layer of the inner blade of the DG; s.rad., stratum radiatum; s.luc., stratum lucidum; s.pyr., stratum pyramidale). The black dot in the inset indicates the location of the soma of the recorded cell within the hippocampus. Note the presence of large (“giant”) terminals with filopodial extensions on the camera lucida reconstruction of the axonal arbor primarily restricted to the stratum lucidum; see also A2. A2, Light micrographs of dendritic spines (top and middle) and of a large MF-like axon varicosity (bottom; arrowheads, main axon; asterisks, filopodia). The asterisk in A1 marks the terminal whose photograph is shown in the bottom panel in A2). A3, Accommodating firing pattern of the cell shown in A1 and A2 in response to depolarizing constant current injection. A4, Accommodating firing pattern of a DG GC. B, CB and Prox1 immunoreactivity of a CA3 GCs (left) and its firing pattern (right). C, CA3 GCs form giant MF terminals in the CA3. Electron micrographs of synaptic contacts formed by the axons of two different CA3 GCs (C1–C3, respectively; C3 is a higher-magnification image of the synaptic contacts in C2). ad, Apical dendrite; b, presynaptic terminal of the labeled CA3 GC; s, postsynaptic spine that originated from the apical dendrite labeled ad. Note the multiple synaptic specializations formed on the same postsynaptic structure (arrowheads), the large number of presynaptic vesicles, and the large size of the terminals, all typical characteristics of giant MF terminals.
Figure 6.

Evidence for entorhinal cortical inputs to CA3 GCs. A, Ten consecutive traces (gray) and the average response (black) in a CA3 GC (reconstruction shown on the right) after the stimulation of presumed entorhinal cortical fibers in the presence of 1 μm DVG IV and 5 μm gabazine. Inset, Relative position of the stimulation electrode (near the fissure; not shown) and the cell body (black dot). Note the facilitation of the EPSCs in response to paired pulses, in agreement with the entorhinal origin of the stimulated fibers. Note also that the dendrites of this particular CA3 GCs did not enter the DG. B, Amplitude of individual evoked responses during the washing in of a low concentration of the AMPA/kainate receptor antagonist NBQX in the perfusing medium. Note the gradual decrease of the evoked EPSC, indicative of monosynaptic connections. C, Perforant pathway-evoked responses in a DG GC (note the similarity to the response of the CA3 GC shown in A).
Direct demonstration of CB and Prox1 expression in the whole-cell recorded GCs was technically challenging, because the immunoreactivity for both markers seemed to be highly sensitive to long-lasting whole-cell patch-clamp recordings. Therefore, in a separate series of experiments (Fig. 2B) specifically conducted to overcome the latter technical issue, we tested the CB and Prox1 immunopositivity in CA3 GCs that were recorded for only a short period of time (<4 min). The CA3 GCs that were tested in this way for CB and Prox1 showed expression of these markers (CB, n = 5 positive of five tested; Prox1, n = 4 positive of four tested) (Fig. 2B).
Intrinsic electrophysiological properties of putative CA3 GCs
Analysis of the single-cell recordings from the putative CA3 GCs (Fig. 2A3,B) supported the hypothesis that these cells were GC-like neurons in their intrinsic electrophysiological properties. In response to long (1 s), suprathreshold, depolarizing current pulses, CA3 GCs fired trains of action potentials that demonstrated marked accommodation (Fig. 2A3,B) (average relative increase in interspike intervals between the last two action potentials in the train with respect to the first two was 4.8 ± 1.1; n = 12; the firing frequency was between 10 and 20 Hz during these measurements). The accommodating firing pattern to long depolarizing current pulses is a well-described property of DG GCs (Staley et al., 1992; Penttonen et al., 1997; Andersen et al., 2007), also displayed by the DG GCs recorded in our experiments (Fig. 2A4) (increase in the last with respect to first interspike intervals in the trains was 3.6 ± 0.4; n = 12). In addition, CA3 GCs and DG GCs displayed statistically similar hyperpolarized resting membrane potentials (−78 ± 0.5 and −77.5 ± 0.8 mV; n = 15 and 12, respectively), relatively large input resistances (139 ± 11 and 141 ± 17 MΩ), and fast membrane time constants (17.1 ± 1.8 and 18 ± 2.1 ms), and the CA3 and DG GCs sharply differed in these properties from CA3 PCs (n = 15; resting membrane potential, −74.8 ± 1.3 mV; CA3 PCs compared with CA3 GCs, p < 0.03; CA3 PCs compared with DG GCs, p < 0.05; input resistance, 112 ± 9 MΩ, p < 0.05; membrane time constant, 47 ± 6.3 ms, p < 0.003 and p < 0.0004). As expected from the differences in input resistance and membrane time constant values, the membrane capacitance of CA3 GC (11.3 ± 1 pF; n = 15) was significantly different from that of CA3 PCs (43.2 ± 3.6 pF; n = 15). Furthermore, similar to the spike-broadening characteristics of DG GCs and MF terminals (Geiger and Jonas, 2000), action potentials of CA3 GCs also showed a gradual broadening during action potential trains (50 Hz; half-width of the first AP was 821 ± 29 μs, compared with the 25th at 1044 ± 28 μs and the 50th at 1072 ± 35 μs; p < 10−8 and p < 0.0005, respectively). These data supported the hypothesis that the small cells that lacked basal dendrites in the CA3 strata radiatum and lucidum (as observed in the IR-DIC image during the slice experiments) were GCs, whose properties were clearly distinct from CA3 PCs.
CA3 GCs form giant MF terminals
In addition to the somato-dendritic morphology and the intrinsic electrophysiological properties, a major defining feature of GCs, in general, is that their axons are part of the MF pathway. The axon collaterals of all of the electrophysiologically recorded and anatomically reconstructed CA3 GCs were restricted to the stratum lucidum, with occasional branches in the stratum pyramidale of the CA3. At the light microscopic level, the axons of all putative CA3 GCs showed large varicosities (Fig. 2A1), similar to the giant MF terminals originating from DG GCs (Frotscher, 1985; Acsády et al., 1998; Rollenhagen et al., 2007). A second, major characteristic of conventional MFs, the filopodial extensions emanating from the giant axon terminals (Acsády et al., 1998; Frotscher et al., 2006), were also present on the axons of CA3 GCs (Fig. 2A1,A2, bottom inset). The MF-like nature of the axons of CA3 GCs was also supported by ultrastructural observations made on a subset of CA3 GCs that were processed for electron microscopy (n = 6). As shown in Figure 2C, the large terminals belonging to CA3 GCs showed all the defining characteristics of the giant mossy terminals, including the presence of multiple release sites and the large number of presynaptic vesicles, engulfing complex spines originating from PC apical dendrites (Fig. 2C2, s) within the stratum lucidum (Acsády et al., 1998; Frotscher et al., 2006; Rollenhagen et al., 2007). Serial EM reconstruction of giant mossy terminals from n = 3 intracellularly labeled CA3 GCs showed that the volume of these terminals was not significantly different from nearby unlabeled giant mossy terminals [the overwhelming majority of which presumably originated from DG GCs; volume of terminals originating from CA3 GCs, 8.4 ± 2.9 μm3; unlabeled nearby giant terminals, 9.9 ± 2.7 μm3; note that these values were close to those reported by Rollenhagen et al. (2007) for giant MF terminals]. These results provided evidence that not all MFs originate from the DG.
Synaptic outputs of CA3 GCs are similar to those of DG GCs
MFs from the DG innervate PCs and GABAergic neurons in the CA3 (Williams and Johnston, 1991; Jonas et al., 1993; Nicoll and Malenka, 1995; Salin et al., 1996; Acsády et al., 1998; Maccaferri et al., 1998; Min et al., 1998; Nicoll and Schmitz, 2005; Pelkey and McBain, 2008). Because of the low number of CA3 PCs innervated by single MFs (Acsády et al. 1998), it is extremely challenging to obtain synaptically connected DG GC-to-CA3 PC pairs using somatic patch-clamp recordings. Since MFs originating from CA3 GCs appeared to be morphologically similar to the MFs from the DG (see above), it was not surprising that the CA3 GC-to-CA3 PC connectivity was apparently sparse, as we found only a single synaptically connected CA3 GC-to-CA3 PC pair of n = 40 simultaneously recorded CA3 GC and CA3 PC pairs using somatic whole-cell patch-clamp techniques. The responses from the synaptically connected CA3 GC-to-CA3 PC pair are shown in Figure 3A. When the presynaptic CA3 GC was stimulated at high-frequency bursts (seven action potentials at 50 Hz), the postsynaptic response showed strong facilitation, similarly to the markedly facilitating responses exhibited by conventional MFs (Jonas et al., 1993; Salin et al., 1996; Maccaferri et al., 1998).
Figure 3.

Synaptic outputs of CA3 GCs. A, Monosynaptically connected CA3 GC-to-CA3 PC pair: gray traces, CA3 GC; black traces, CA3 PC. Note the facilitation of the average postsynaptic EPSC (A1) in response to a high-frequency burst of presynaptic action potentials (7 action potentials at 50 Hz) and the short onset delay of the individual responses (A2; illustrated events were in response to the 7th AP from the 50 Hz train). B, Onset delays (from the peak of presynaptic spike to the EPSC onset) for individual monosynaptic (dark bars) and polysynaptic (gray bars) pairs (note that the postsynaptic cells included both CA3 PCs and CA3 GABAergic neurons). Inset, Example traces from a polysynaptic connection between a CA3 GC (gray) and a CA3 PC (black). The calibration bar in A2 also applies to B.
In addition to the monosynaptic (delay to onset of postsynaptic responses, <1.2 ms) connections described above, CA3 GCs were also able to evoke synaptic events in cells that were not monosynaptically connected to them. These polysynaptic responses (Fig. 3B) were characterized by long, variable onset delays (3.47 ± 0.24 ms; n = 13 pairs), and they could be recorded after single action potentials in CA3 GCs in CA3 PCs (n = 6), as well as in CA3 GABAergic neurons (n = 7; see below).
A characteristic property of the MF output from the DG is that GABAergic neurons in the hilus and the CA3 comprise most of the postsynaptic targets (Frotscher, 1985; Acsády et al., 1998; Lawrence and McBain, 2003; Frotscher et al., 2006; Szabadics and Soltesz, 2009). Furthermore, MFs elicit EPSCs in specific subtypes of CA3 GABAergic neurons, including the spiny stratum lucidum cells (SLCs; the dendrites of these cells are restricted to the stratum lucidum, hence the name; their axons project to the septum), the fast spiking basket cells (FSBCs; these cells are immunoreactive for PV), the ivy cells (IvyC; a member of the neurogliaform cell family) (Fuentealba et al., 2008), and the regular spiking basket cells (RSBCs; these cells express CCK or CCK) (Acsády et al., 1998; Szabadics and Soltesz, 2009). We conducted a series of somatic paired recording experiments to determine whether the output from CA3 GCs onto CA3 GABAergic neurons followed the same basic pattern that was described for conventional MFs. The somatic paired recording revealed monosynaptic connections from CA3 GCs onto SLCs (Fig. 4A1,2) (n = 11; eight SLCs were SOM+ of eight tested; four were NPY+ of four tested), RSBCs (Fig. 4B) (n = 2; one CCK+ of one tested, zero SOM+ of two tested), IvyCs (Fig. 4C) (n = 2; one NPY+ of one tested, zero SOM+ of two tested), and FSBCs (data not shown; n = 3; two PV+ of two tested). Additionally, we found monosynaptic CA3 GC inputs to four unidentified cells. These paired recording data between presynaptic CA3 GCs and postsynaptic CA3 GABAergic cells suggested that MFs originating from CA3 GCs innervated the same types of GABAergic neurons as described for conventional MFs.
Figure 4.

Monosynaptic output from CA3 GCs onto CA3 GABAergic cells. A1, A2, Dendritic structure (A1) and immunocytochemical characterization (A2) of an SLC that received synaptic connection from a CA3 GC. Note that SLCs project to the medial septum and thus have few, if any, local collaterals. A3, Postsynaptic response in the SLC shown in A1, evoked by a train of 50 action potentials at 50 Hz in the CA3 GCs (gray traces). A4, Individual superimposed presynaptic spikes and postsynaptic responses from A3 indicate the tight temporal coupling between the presynaptic action potential and the postsynaptic response. A5, Average probability of transmission from CA3 GC to SLCs (n = 8) during 50 Hz action potential trains (note that the presynaptic action potential train in A3 is aligned with the x-axis, indicating the action potential number in the train). B, C, Dendritic structure, axonal arborization, and immunocytochemical characterization of a CCK-positive RSBC (B) and of an IvyC (C) in the CA3 area and the monosynaptic EPSCs evoked by pairs of action potentials in presynaptic CA3 GCs (gray traces). Note the large responses in both cell types evoked by the presynaptic CA3 GCs (compare with the small initial responses evoked by CA3 GCs in SLCs). Scale bars, 100 μm.
The physiological properties could be analyzed in detail for the CA3 GC-to-SLC connections, for which a sufficiently high number of pairs (n = 11) was available. Monosynaptic inputs from CA3 GC to SLCs (n = 11) showed extremely low initial transmission probability (3.2 ± 1.1% for the first presynaptic action potential) and displayed increasing facilitation in response to prolonged, high-frequency presynaptic stimulation (50 presynaptic action potentials at 50 Hz; transmission probabilities: 1–10th APs, 8.6 ± 2.2%; 11–20th, 26.7 ± 6.6%; 21–30th, 42.1 ± 9.6%; 31–40th, 53.3 ± 9.6%; 41–50th, 56.4 ± 10.2%; p values: 1–10th APs compared with 11–20th APs, the latter compared with the next 10, and so on: 0.0065, 0.015, 0.0045, and 0.26, respectively; note that the increase in the transmission probability was not significant between the 31–40th and 41–50th presynaptic APs) (Fig. 4A3–5). These data obtained from CA3 GC-to-SLC pairs were virtually identical to those observed for conventional MF-to-SLC connections [compare our Fig. 4A3–5 with Fig. 5C1&2 of Szabadics and Soltesz (2009)]. In contrast to CA3 GC inputs to SLCs, the CA3 GC inputs to RSBCs and IvyCs were large even after the first action potential (average EPSC amplitudes: RSBC1, 35.5 ± 5 pA; RSBC2, 50.8 ± 5 pA; IvyC1, 258.7 ± 29.4 pA; IvyC2, 35.3 ± 5.2 pA), again closely paralleling the properties of the conventional MF inputs to these GABAergic cells in the CA3 (Szabadics and Soltesz, 2009).
Figure 5.

Mechanisms of postsynaptic effects of CA3 GCs. A1, A2, Effect of the metabotropic glutamate receptor agonist DCG IV (1 μm) on CA3 GC-evoked responses in an SLC and an IvyC (single traces are shown). A3, Summary data of the DCG IV effect on the probability of monosynaptic responses evoked by CA3 GCs in postsynaptic CA3 GABAergic cells (n = 4). Probability values were normalized to predrug control. B, Representative experiment demonstrating the effect of the AMPA/kainate receptor antagonist NBQX (10 μm) on the monosynaptic responses evoked by a CA3 GC in an SLC neuron in the CA3. s.luc., Stratum lucidum; s.pyr., stratum pyramidale.
Synaptic events originating from MFs are known to be sensitive to activation of group II metabotropic glutamate receptors (mGluR II) (Kamiya et al., 1996; Toth and McBain, 1998). Therefore, we tested the sensitivity of monosynaptic responses evoked by CA3 GCs in postsynaptic cells to the selective mGluR II agonist DCG IV (1 μm; n = 4, including one SLC, one FSBC, one IvyC, and one unidentified cell). There was a 61 ± 5.8% decrease in the probability of CA3 GC-evoked monosynaptic events (Fig. 5A) (p < 0.002), with partial recovery after washout (15 min). The sensitivity of CA3 GC-evoked responses to DCG IV provides additional pharmacological evidence for the MF-like nature of the synaptic output from CA3 GCs. Furthermore, application of the AMPA/kainate receptor antagonist 2,3-dioxo-6-nitro-1,2,3,4-tetrahydrobenzo[f]quinoxaline-7-sulfonoamide (NBQX; 10 μm) abolished the monosynaptic events evoked by CA3 GCs (Fig. 5B) (n = 6, including four SLCs, one RSBC, and one unidentified cell), indicating the glutamatergic nature of the transmission. In contrast, the GABAA receptor antagonist gabazine (5 μm) did not have a statistically significant effect on these events (n = 4; the peak amplitude was 102.2 ± 8.6% after gabazine application compared with predrug control; data not shown).
As mentioned above, CA3 GCs were also able to evoke synaptic events in CA3 GABAergic neurons that were not monosynaptically connected to them (n = 7; these included two FSBCs, two RSBCs, and three unidentified cells) (Fig. 3B). The presence of polysynaptic responses in CA3 PCs and CA3 GABAergic cells demonstrates that single spikes in CA3 GCs are able to elicit action potentials in postsynaptic neurons, indicating that CA3 GCs actively engage the hippocampal network. It should be noted that similar results were shown for DG GCs as well (Mori et al., 2004, 2007; Szabadics and Soltesz, 2009), providing additional support for the MF-like nature of the output from CA3 GCs.
Excitatory inputs to CA3 GCs
A major property of DG GCs is that they receive perforant path inputs from the entorhinal cortex. The presence of the dendritic branches of CA3 GCs in the stratum lacunosum-moleculare of the CA3 and occasionally in the stratum moleculare of the DG suggests that, similarly to DG GCs, CA3 GCs may also receive inputs from the entorhinal cortex. To test the latter possibility, a stimulating electrode was placed near the fissure between the upper blade of the DG and CA1, at an average distance of 901 ± 182 μm from the soma of the recorded CA3 GCs (Fig. 6A). In an effort to minimize the possibility of activation of polysynaptic signals after the electrical stimulation, the extracellular solution contained 1 μm DCG IV (to reduce the synaptic output of DG GCs) and 5 μm gabazine (to block fast GABAergic events). Experiments with perforant path input to DG GCs were executed similarly (distance, 629 ± 280 μm) (Fig. 6C), and in two cases, evoked responses were tested in consecutively recorded CA3 GCs and DG GCs within the same slices without moving the stimulation electrode. These experiments revealed that electrical stimulation of the afferents evoked similar EPSCs in CA3 GCs and DG GCs (average amplitude of first responses, 28.1 ± 9.2 and 21.7 ± 2.9 pA; n = 4 and 3 cells, respectively; p < 0.55; onset delays, measured from the onset of stimuli: in DG GCs, 4.3 ± 0.05 ms; in CA3 GCs, 4.8 ± 0.19 ms; p < 0.06). The presumed entorhinal cortical afferent input similarly facilitated in the case of both the CA3 and the DG GCs (paired-pulse ratio was 1.55 ± 0.07 and 1.54 ± 0.09, respectively; no significant difference; Wilcoxon matched-pairs test; median values for the paired-pulse ratios were 1.5 and 1.57, respectively). To further confirm that the evoked events were monosynaptically mediated, a low concentration of the AMPA/kainate receptor antagonist NBQX (0.8 μm) was perfused through the recording chamber. If multiple intermediate synaptic steps were involved in the evoked excitatory responses in CA3 GCs, the probability of the evoked events should decrease suddenly during the minutes-long wash-in period. In contrast, the amplitude of the individual evoked events decreased gradually to baseline during NBQX wash-in (Fig. 6B), supporting the hypothesis that CA3 GCs receive direct monosynaptic innervation from the entorhinal cortex.
In addition to the perforant path input, CA3 GCs may also receive excitatory inputs from local CA3 PCs. During the paired recordings between CA3 GCs and CA3 PCs described above, we did not observe monosynaptic CA3 PC-to-CA3 GC connections, indicating that inputs from CA3 PCs to CA3 GCs may be rare. Although direct evidence from paired recordings could not be obtained, indirect evidence from additional experiments was consistent with the existence of monosynaptic connections between CA3 PCs to CA3 GCs (supplemental Fig. 1, available at www.jneurosci.org as supplemental material). Specifically, in the presence of DCG IV and gabazine, electrical stimulation at the alveus/oriens border or in the stratum pyramidale in the CA3 evoked EPSCs in CA3 GCs with short latencies (2.86 ± 0.22 ms; n = 9) (supplemental Fig. 1A, available at www.jneurosci.org as supplemental material). Furthermore, pharmacologically induced hyperpolarization of CA3 PCs by the 5HT1A receptor agonist xaliproden resulted in a significant decrease in the frequency of spontaneous EPSCs in CA3 GCs (without a change in the average spontaneous EPSC amplitude), and this effect was reversed after subsequent application of the 5HT1A antagonist S-WAY-100135 (supplementary Fig. 1B, available at www.jneurosci.org as supplemental material). These data indicate that CA3 GCs are likely to receive monosynaptic CA3 PC inputs (note that there is anatomical evidence that CA3 PCs may also innervate DG GCs) (Li et al., 1994; for review, see Scharfman et al., 2007), and therefore the perforant path may not be the sole source of synaptic excitation to CA3 GCs.
Local GABAergic input to CA3 GCs
Together, the data in Figures 2–6 show multiple similarities between CA3 GCs and DG GCs, including somato-dendritic and axonal morphology, intrinsic electrophysiological properties, innervations of GABAergic postsynaptic target cell populations, and excitatory inputs. These similarities may be taken to imply that the two GC populations might behave identically in the functioning of the hippocampal circuit. However, the DG and CA3 subserve distinct information processing properties (Nakazawa et al., 2004; Leutgeb et al., 2007; Bakker et al., 2008; Nakashiba et al., 2008), and local GABAergic cells play a major role in shaping the behavioral state-dependent firing properties of principal cells (Klausberger et al., 2003; Klausberger and Somogyi, 2008). Therefore, in the next series of experiments, we sought to determine whether CA3 GCs receive inputs from local CA3 GABAergic neurons that do not provide simultaneous innervation to DG GCs.
During paired recordings between presynaptic CA3 GABAergic cells and postsynaptic CA3 GCs, we found monosynaptic connections to CA3 GCs from the so-called MF-associated cells (MFAs; n = 5; three CCK+ of three tested) (Fig. 7A,B), IvyCs (n = 4; three NPY+ of three tested, zero SOM+ of three tested) (Fig. 7C,D), and FSBC (n = 1, PV+ but SOM negative), and three unidentified dendrite targeting cells. Among these GABAergic cell types, IvyCs have spatially restricted axonal arbors (Tamas et al., 2003; Fuentealba et al., 2008) and MFAs project to the stratum lucidum of the CA3 and to the hilus (without innervating the strata granulosum or moleculare of the DG) (Vida and Frotscher, 2000; Losonczy et al., 2004). Therefore, CA3 IvyCs and MFAs do not provide synaptic innervations to DG GCs located in the principal cell layer. Both of these two presynaptic GABAergic cell types in the CA3 evoked large-amplitude responses in postsynaptic CA3 GCs (Fig. 7B,D) (properties of the unitary IPSCs from MFAs and IvyCs, respectively: average amplitude, 164.9 ± 37.1 and 43.9 ± 29.6 pA; 10–90% rise time, 0.53 ± 0.08 and 1.51 ± 0.43 ms; decay time constant, 4.6 ± 0.8 and 9.7 ± 1.1 ms). These results show that CA3 GCs receive substantial local GABAergic inputs that are different from those experienced by DG CGs.
Figure 7.

Synaptic inputs from local CA3 GABAergic cells to CA3 GCs. A, Dendritic structure, representative axonal arborization, and immunocytochemical characterization of a presynaptic IvyC. Note the NPY-positive, SOM-negative nature of the cell; note also the characteristically dense axonal arbor (s.ori., stratum oriens). B, Postsynaptic responses evoked by the IvyC (A; presynaptic spikes elicited at 0.04 Hz) in a CA3 GC. C, Dendritic structure, representative axonal arborization, and immunocytochemical characterization of a presynaptic MFA. Note the axons in the stratum lucidum and in the dentate hilus (closely overlapping with the termination zones of MFs, hence the name of this GABAergic CA3 cell type; s.gran., stratum granulosum of the DG). Note also the immunopositivity to CCK and the immunonegativity for SOM (both features are characteristics of MFAs). D, Postsynaptic responses evoked by the MFA (C; presynaptic spikes elicited at 10 Hz) in a CA3 GCs.
Distinct endocannabinoid modulation of the GABAergic responses in CA3 GCs
The synaptic output of CCK-expressing GABAergic cells (including MFAs) is subject to presynaptic modulation through cannabinoid type-1 (CB1) receptors (Katona and Freund, 2008; Kano et al., 2009). Depolarization of PCs by relatively short (500 ms) depolarizing pulses is known to lead to a robust, endocannabinoid-mediated, short-term suppression of GABA release from CB1 receptor- and CCK-expressing GABAergic cells, a phenomenon referred to as depolarization-induced suppression of inhibition (DSI) (Pitler and Alger, 1992; Vincent et al., 1992). In contrast to PCs, DG GCs have been shown to exhibit no or only weak DSI under similar conditions (Chen et al., 2003; Isokawa and Alger, 2005) (note that the precise reason for this difference is not yet understood). However, since, as discussed above, CA3 GCs and DG GCs receive distinct inhibitory innervations from local GABAergic neurons, it is possible that CA3 GCs and DG GCs show significantly different DSI. To test this hypothesis, we compared DSI at the MFA-to-CA3 GC connections with DSI at the GABAergic connections on DG GCs formed by RSBCs (CCK+ basket cells). Surprisingly, depolarization of CA3 GCs for 500 ms (to 0 mV) dramatically reduced the GABAergic unitary synaptic events evoked by presynaptic MFAs (Fig. 8A,B) (n = 5; 84.3 ± 4.7% decrease in average IPSC amplitude, including failures, was 0.8–1.4 s after postsynaptic depolarization). As expected, the DSI of the MFA-to-CA3 GC connection was abolished after the application of the CB1 receptor antagonist AM251 (10 μm; MFA inputs to CA3 PCs also exhibited robust DSI after 500-ms-long depolarization) (Fig. 8C,E). However, under the same experimental conditions, depolarization for 500 ms in DG GCs was not able to induce a detectable suppression of the responses evoked by the local CCK-positive RSBC (Fig. 8D, left) (n = 4; 6.1 ± 3.6%; note that longer depolarization of DG GCs was able to evoke DSI in the same pairs) (Fig. 8D, right). Therefore, the endocannabinoid modulation of GABAergic synapses onto CA3 GCs and DG GCs are remarkably different (Fig. 8F), supporting the hypothesis that the GABAergic interneuronal modulation of the two GC populations are likely to be functionally distinct.
Figure 8.
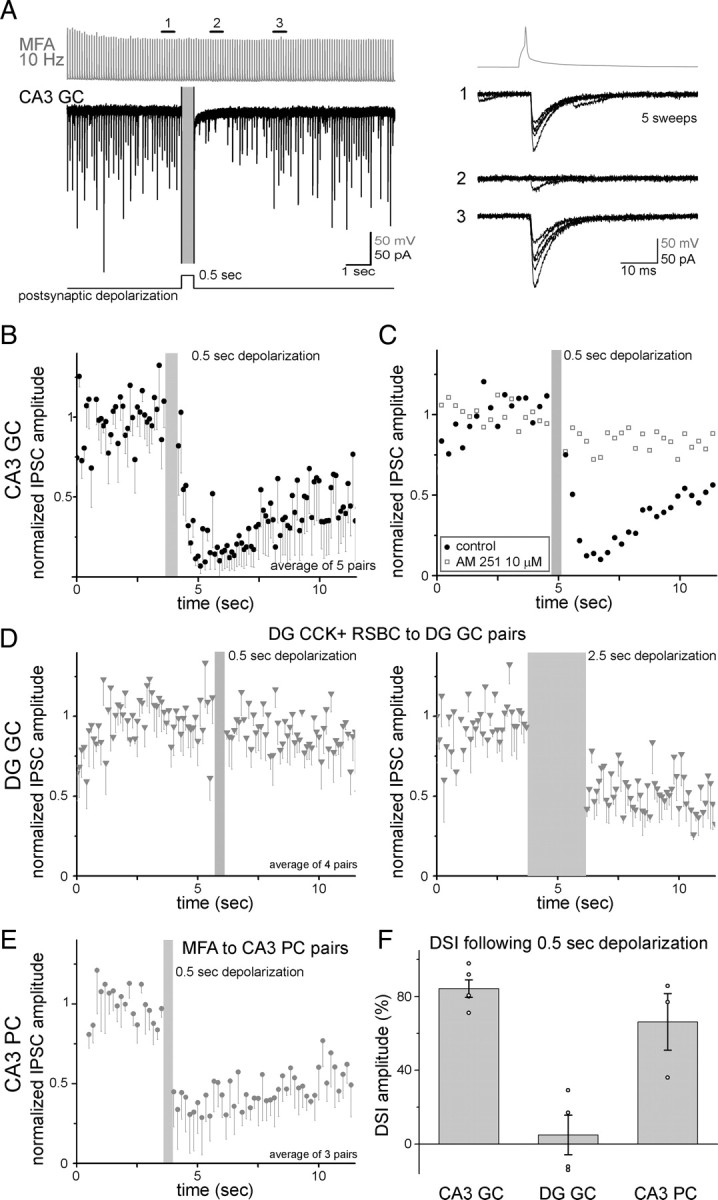
Differential endocannabinoid signaling at GABAergic synapses on CA3 GCs and DG GCs. A, Depolarization of the postsynaptic CA3 GCs to 0 mV for 500 ms resulted in strong DSI of the MFA-evoked unitary IPSCs. Right, Example traces before, during, and after the suppression. B, Summary data of the average amplitude of IPSCs (including failures) in MFA-to-CA3 GC pairs (n = 5) during DSI protocol. The IPSC amplitudes were normalized to the average of control amplitude value in each pair. The gray bar indicates the time of the postsynaptic depolarization. C, DSI in MFA–CA3 GC pairs were abolished by the application of the CB1 receptor antagonist AM251 (10 μm; control data correspond the same pairs before drug application). D, Similar depolarizations (0.5 s) in DG GCs did not result in detectable DSI of the responses evoked by the local (intradentate), CCK-positive RSBCs (left); longer (2.5 s) postsynaptic depolarization was able to induce DSI in the same pairs (right). E, Summary data of the average amplitude of IPSCs (including failures) in MFA to CA3 PC pairs (n = 3) during DSI protocol (0.5 s). F, Summary of DSI exhibited by CCK+ inputs to three excitatory cell populations after 0.5 s depolarization of the postsynaptic cells. Gray bars show the averages, and the open circles indicate individual experiments (pairs).
Discussion
The data here show that CB- and Prox1-positive GCs exist in the CA3 region of the normal, healthy rat. CA3 GCs are similar to DG GCs in their somato-dendritic morphology, intrinsic electrophysiological properties, and the MF-like nature of their axons, and they are present in numbers that are comparable to the rarer GABAergic cell types. CA3 GCs receive monosynaptic excitatory inputs from entorhinal afferents, and the synaptic output from CA3 GCs can be abolished by blockade of AMPA/kainate glutamate receptors and significantly decreased by the activation of mGluR II receptors. CA3 GCs, similar to DG GCs, innervate PCs and specific types of GABAergic cells in the CA3 area. CA3 GCs receive inputs from local (within CA3) GABAergic neurons, such the MFAs, that do not innervate cells in the DG GC layer, and CA3 GCs display significantly stronger DSI compared with DG GCs. Together, these results show that MFs can originate both from within as well as outside of the DG and that CA3 GCs constitute a glutamatergic nonprincipal cell in the hippocampus proper that is integrated into the CA3 neuronal network with distinct properties.
CA3 GCs as a new hippocampal “local circuit” element
Information carried by MFs from the DG to the hippocampus is implicated in important memory and spatial representation functions, including the disambiguation of small differences in cortical inputs referred to as pattern separation (Leutgeb et al., 2007; Bakker et al., 2008). The DG–hippocampal interface cannot be understood at the microcircuit level without precise knowledge of the cellular and synaptic elements that are integrated in the network. The results presented in this study demonstrate that GCs are present and actively engaged in the CA3 network and that these cells are likely to contribute to entorhinal–CA3 interplay.
The presence of these cells has been indicated by previous studies, which noted GC-like neurons in the CA3 (Amaral and Woodward, 1977; Marti-Subirana et al., 1986; Toth and Freund, 1992). However, no additional information was available about these neurons beyond limited descriptions of their somato-dendritic morphology made on the basis of Golgi staining or CB immunoreactivity. The comprehensive analysis of these cells presented here demonstrates that CA3 GCs receive presumed entorhinal afferents and form MFs [note that the latter point remained controversial in previous studies (see Amaral and Woodward, 1977)], indicating that these cells contribute to the entorhinal–hippocampal interactions. Although CA3 GCs are present in relatively low abundance, their numbers are comparable to some of the GABAergic interneurons, and GCs (at least those that are located in the DG) have been shown to be able to powerfully modulate the discharges of their CA3 postsynaptic targets in vivo (Henze et al., 2002), indicating that CA3 GCs are likely to contribute to CA3 network processes, to some degree. Although it is not possible to unequivocally address the network contribution of CA3 GCs at present, it is interesting to note that CA3 GCs, despite their general similarity to DG CGs, possess some clearly distinct properties that may shape their circuit function and behavior in vivo. CA3 GCs receive GABAergic inputs from local interneurons that do not innervate cells in the DG GC layer, which, in light of the key role that GABAergic neurons play in the generation of network oscillations (Klausberger et al., 2003; Klausberger and Somogyi, 2008), suggests that it is possible that CA3 GCs follow oscillatory dynamics and in vivo behavior characteristics of the CA3 region and not the DG. A prediction of the latter hypothesis that may be testable in the future is that CA3 GCs should exhibit place-field properties more reminiscent of CA3 PCs than DG GCs (Leutgeb et al., 2007) (note that the latter prediction is also supported by the likely similar entorhinal cortical information received by CA3 PCs and CA3 GCs on their dendrites in the CA3 lacunosum moleculare).
The results included in the present study provide quantitative data on the intrinsic and synaptic properties of CA3 GCs, which can be incorporated into anatomically and biophysically realistic computational models of the hippocampal formation (Dyhrfjeld-Johnsen et al., 2007) to test hypotheses regarding the function of CA3 GCs. It is interesting to note that functional differences between DG GCs and CA3 GCs may also result from the fact that the primary axon of CA3 GCs is considerably shorter that the MF belonging to DG GCs. The latter feature may lead to significant differences in the timing of postsynaptic responses, and the shorter distance between the soma and the presynaptic terminal is also expected to enhance the ability of the somatic membrane potential to modulate synaptic transmission (Alle and Geiger, 2006; Scott et al., 2008). In addition, it will be important to determine whether the number of CA3 GCs dramatically increases after insults such as severe seizures, similarly to what takes place in the case of ectopic DG GCs (Scharfman et al., 2007).
Cannabinoid signaling in GCs
A long-standing puzzle in the study of hippocampal endocannabinoid signaling is the observation that DG GCs, uniquely among principal cells in the hippocampal formation, display no or only weak DSI (Chen et al., 2003; Isokawa and Alger, 2005). Although the precise reason for the apparent weakness of DSI in DG GCs is not known, it is surprising that CA3 GCs, which in several other properties appear to be quite similar to DG GCs, exhibited robust DSI. It should be noted that we compared the activity-dependent, retrograde short-term plasticity (in the form of DSI) of MFA to CA3 GC synapses with RSBC-to-DG GC inputs (note that MFAs do not innervate GCs in the DG principal cell layer and we found no RSBC inputs to CA3 GCs; consequently, the reverse experiment was not feasible). Therefore, it is possible that the significant differences in the ability of CA3 and DG GCs to exhibit DSI are related to presynaptic factors. Whereas the observation that CA3 GCs are able to powerfully decrease their GABAergic inputs originating from CB1- and CCK-expressing MFAs in general supports the hypothesis that CA3 GCs may play roles in the circuit that are distinct from DG GCs, future studies will be needed to unequivocally determine the reasons underlying the difference in the DSI generating abilities between the CA3 and DG GC populations.
GCs in the CA3 as components of the DG–hippocampal interface
The identification of all distinct elements of cortical and hippocampal neuronal circuits is critically important for achieving a microcircuit level, “bottom-up” understanding of how neuronal networks generate animal behavior. Our data demonstrate, for the first time, that CA3 GCs constitute a distinct hippocampal cell type that integrates into the local network as a glutamatergic local circuit element. In Ammon's horn, the only glutamatergic neurons that have been described previously are the PCs; therefore, CA3 GCs represent a novel, unique population of glutamatergic nonprincipal cells. It is not known whether CA3 GCs are adult-born neurons that migrate incorrectly, but it is interesting that these cells, despite their unusual location, are able to form axons with giant terminals and filopodia and join the MF bundle. Furthermore, CA3 GCs apparently select postsynaptic GABAergic target cells in a manner that closely resembles the rules followed by conventional MFs (Acsády et al., 1998; Frotscher et al., 2006; Szabadics and Soltesz, 2009). Specifically, CA3 GCs were presynaptic to perisomatically (FSBCs and RSBCs) and dendritically (IvyCs) projecting CA3 GABAergic neurons, and CA3 GCs also evoked EPSCs in SLCs. These results indicate that CA3 GCs can likely influence the release of GABA onto both the perisomatic and dendritic regions of CA3 PCs and modulate the septo-hippocampal interplay. In addition to the similar nature of the target selection between conventional MFs and CA3 GC axons, it is noteworthy that the physiological properties of the excitatory connections also appeared to be similar. Conventional MFs provide frequent innervations to SLCs (perhaps because of the close alignment of the SLC dendrites and MFs in the stratum lucidum) (Fig. 4A1) and FSBCs, but the inputs to SLCs and FSBCs tend to be weak. The weakness of the MF-EPSCs is especially prominent for SLCs, where the MF inputs exhibit extremely low release probability and a unique pattern of facilitation that requires numerous presynaptic spikes for significant MF-EPSCs to emerge in SLCs (one possible explanation for the frequent but individually weak MF inputs to these cells is that this particular arrangement may enable SLCs and FSBCs to detect changes in the average firing rates to a population of DG GCs) (Szabadics and Soltesz, 2009). Our paired recordings data indicate that CA3 GCs also frequently innervate SLCs and that the CA3 GC to SLC EPSCs display low initial release probability and a pattern of facilitation that closely resembles that of the MF-EPSCs in SLCs.
In summary, our results provide novel insights into the complexity and functional organization of the DG-CA3 interface and indicate that CA3 GCs, a nonprincipal cell type within Ammon's horn, may be able to modulate perisomatic and dendritic GABAergic inputs within the CA3 and influence the GABAergic modulation of extrahippocampal areas.
Footnotes
This work was supported primarily by National Institutes of Health Grant NS35915 (I.S.) and the George E. Hewitt Foundation for Medical Research (J.S.) and supported in part by the Wellcome Trust International Senior Research Fellowship (087497; J.S.) and the “Lendület” initiative of the Hungarian Academy of Sciences (J.S.). We thank Rose Zhu and Dóra Hegedűs for technical assistance and Dr. Stephen Ross for the generous loan of a Nikon Eclipse FN1 microscope.
References
- Acsády L, Kamondi A, Sik A, Freund T, Buzsaki G. GABAergic cells are the major postsynaptic targets of mossy fibers in the rat hippocampus. J Neurosci. 1998;18:3386–3403. doi: 10.1523/JNEUROSCI.18-09-03386.1998. [DOI] [PMC free article] [PubMed] [Google Scholar]
- Alle H, Geiger JR. Combined analog and action potential coding in hippocampal mossy fibers. Science. 2006;311:1290–1293. doi: 10.1126/science.1119055. [DOI] [PubMed] [Google Scholar]
- Amaral DG, Woodward DJ. A hippocampal interneuron observed in the inferior region. Brain Res. 1977;124:225–236. doi: 10.1016/0006-8993(77)90881-2. [DOI] [PubMed] [Google Scholar]
- Andersen P, Morris R, Amaral DG, Bliss TV, O'Keefe J. The hippocampus book. Oxford: Oxford UP; 2007. [Google Scholar]
- Bakker A, Kirwan CB, Miller M, Stark CE. Pattern separation in the human hippocampal CA3 and dentate gyrus. Science. 2008;319:1640–1642. doi: 10.1126/science.1152882. [DOI] [PMC free article] [PubMed] [Google Scholar]
- Bischofberger J, Engel D, Li L, Geiger JR, Jonas P. Patch-clamp recording from mossy fiber terminals in hippocampal slices. Nat Protoc. 2006;1:2075–2081. doi: 10.1038/nprot.2006.312. [DOI] [PubMed] [Google Scholar]
- Buckmaster PS, Tam E, Schwartzkroin PA. Electrophysiological correlates of seizure sensitivity in the dentate gyrus of epileptic juvenile and adult gerbils. J Neurophysiol. 1996;76:2169–2180. doi: 10.1152/jn.1996.76.4.2169. [DOI] [PubMed] [Google Scholar]
- Chen K, Ratzliff A, Hilgenberg L, Gulyas A, Freund TF, Smith M, Dinh TP, Piomelli D, Mackie K, Soltesz I. Long-term plasticity of endocannabinoid signaling induced by developmental febrile seizures. Neuron. 2003;39:599–611. doi: 10.1016/s0896-6273(03)00499-9. [DOI] [PubMed] [Google Scholar]
- Dyhrfjeld-Johnsen J, Santhakumar V, Morgan RJ, Huerta R, Tsimring L, Soltesz I. Topological determinants of epileptogenesis in large-scale structural and functional models of the dentate gyrus derived from experimental data. J Neurophysiol. 2007;97:1566–1587. doi: 10.1152/jn.00950.2006. [DOI] [PubMed] [Google Scholar]
- Frotscher M. Mossy fibres form synapses with identified pyramidal basket cells in the CA3 region of the guinea-pig hippocampus: a combined Golgi-electron microscope study. J Neurocytol. 1985;14:245–259. doi: 10.1007/BF01258450. [DOI] [PubMed] [Google Scholar]
- Frotscher M, Jonas P, Sloviter RS. Synapses formed by normal and abnormal hippocampal mossy fibers. Cell Tissue Res. 2006;326:361–367. doi: 10.1007/s00441-006-0269-2. [DOI] [PubMed] [Google Scholar]
- Fuentealba P, Begum R, Capogna M, Jinno S, Marton LF, Csicsvari J, Thomson A, Somogyi P, Klausberger T. Ivy cells: a population of nitric-oxide-producing, slow-spiking GABAergic neurons and their involvement in hippocampal network activity. Neuron. 2008;57:917–929. doi: 10.1016/j.neuron.2008.01.034. [DOI] [PMC free article] [PubMed] [Google Scholar]
- Geiger JR, Jonas P. Dynamic control of presynaptic Ca(2+) inflow by fast-inactivating K(+) channels in hippocampal mossy fiber boutons. Neuron. 2000;28:927–939. doi: 10.1016/s0896-6273(00)00164-1. [DOI] [PubMed] [Google Scholar]
- Hefft S, Jonas P. Asynchronous GABA release generates long-lasting inhibition at a hippocampal interneuron-principal neuron synapse. Nat Neurosci. 2005;8:1319–1328. doi: 10.1038/nn1542. [DOI] [PubMed] [Google Scholar]
- Henze DA, Wittner L, Buzsaki G. Single granule cells reliably discharge targets in the hippocampal CA3 network in vivo. Nat Neurosci. 2002;5:790–795. doi: 10.1038/nn887. [DOI] [PubMed] [Google Scholar]
- Isokawa M, Alger BE. Retrograde endocannabinoid regulation of GABAergic inhibition in the rat dentate gyrus granule cell. J Physiol. 2005;567:1001–1010. doi: 10.1113/jphysiol.2005.094219. [DOI] [PMC free article] [PubMed] [Google Scholar]
- Jonas P, Major G, Sakmann B. Quantal components of unitary EPSCs at the mossy fibre synapse on CA3 pyramidal cells of rat hippocampus. J Physiol. 1993;472:615–663. doi: 10.1113/jphysiol.1993.sp019965. [DOI] [PMC free article] [PubMed] [Google Scholar]
- Kamiya H, Shinozaki H, Yamamoto C. Activation of metabotropic glutamate receptor type 2/3 suppresses transmission at rat hippocampal mossy fibre synapses. J Physiol. 1996;493:447–455. doi: 10.1113/jphysiol.1996.sp021395. [DOI] [PMC free article] [PubMed] [Google Scholar]
- Kano M, Ohno-Shosaku T, Hashimotodani Y, Uchigashima M, Watanabe M. Endocannabinoid-mediated control of synaptic transmission. Physiol Rev. 2009;89:309–380. doi: 10.1152/physrev.00019.2008. [DOI] [PubMed] [Google Scholar]
- Katona I, Freund TF. Endocannabinoid signaling as a synaptic circuit breaker in neurological disease. Nat Med. 2008;14:923–930. doi: 10.1038/nm.f.1869. [DOI] [PubMed] [Google Scholar]
- Klausberger T, Somogyi P. Neuronal diversity and temporal dynamics: the unity of hippocampal circuit operations. Science. 2008;321:53–57. doi: 10.1126/science.1149381. [DOI] [PMC free article] [PubMed] [Google Scholar]
- Klausberger T, Magill PJ, Marton LF, Roberts JD, Cobden PM, Buzsaki G, Somogyi P. Brain-state- and cell-type-specific firing of hippocampal interneurons in vivo. Nature. 2003;421:844–848. doi: 10.1038/nature01374. [DOI] [PubMed] [Google Scholar]
- Lawrence JJ, McBain CJ. Interneuron diversity series: containing the detonation–feedforward inhibition in the CA3 hippocampus. Trends Neurosci. 2003;26:631–640. doi: 10.1016/j.tins.2003.09.007. [DOI] [PubMed] [Google Scholar]
- Leutgeb JK, Leutgeb S, Moser MB, Moser EI. Pattern separation in the dentate gyrus and CA3 of the hippocampus. Science. 2007;315:961–966. doi: 10.1126/science.1135801. [DOI] [PubMed] [Google Scholar]
- Li XG, Somogyi P, Ylinen A, Buzsáki G. The hippocampal CA3 network: an in vivo intracellular labeling study. J Comp Neurol. 1994;339:181–208. doi: 10.1002/cne.903390204. [DOI] [PubMed] [Google Scholar]
- Liu M, Pleasure SJ, Collins AE, Noebels JL, Naya FJ, Tsai MJ, Lowenstein DH. Loss of BETA2/NeuroD leads to malformation of the dentate gyrus and epilepsy. Proc Natl Acad Sci U S A. 2000;97:865–870. doi: 10.1073/pnas.97.2.865. [DOI] [PMC free article] [PubMed] [Google Scholar]
- Losonczy A, Biro AA, Nusser Z. Persistently active cannabinoid receptors mute a subpopulation of hippocampal interneurons. Proc Natl Acad Sci U S A. 2004;101:1362–1367. doi: 10.1073/pnas.0304752101. [DOI] [PMC free article] [PubMed] [Google Scholar]
- Maccaferri G, Toth K, McBain CJ. Target-specific expression of presynaptic mossy fiber plasticity. Science. 1998;279:1368–1370. doi: 10.1126/science.279.5355.1368. [DOI] [PubMed] [Google Scholar]
- Marti-Subirana A, Soriano E, Garcia-Verdugo JM. Morphological aspects of the ectopic granule-like cellular populations in the albino rat hippocampal formation: a Golgi study. J Anat. 1986;144:31–47. [PMC free article] [PubMed] [Google Scholar]
- Min MY, Rusakov DA, Kullmann DM. Activation of AMPA, kainate, and metabotropic receptors at hippocampal mossy fiber synapses: role of glutamate diffusion. Neuron. 1998;21:561–570. doi: 10.1016/s0896-6273(00)80566-8. [DOI] [PubMed] [Google Scholar]
- Mori M, Abegg MH, Gahwiler BH, Gerber U. A frequency-dependent switch from inhibition to excitation in a hippocampal unitary circuit. Nature. 2004;431:453–456. doi: 10.1038/nature02854. [DOI] [PubMed] [Google Scholar]
- Mori M, Gahwiler BH, Gerber U. Recruitment of an inhibitory hippocampal network after bursting in a single granule cell. Proc Natl Acad Sci U S A. 2007;104:7640–7645. doi: 10.1073/pnas.0702164104. [DOI] [PMC free article] [PubMed] [Google Scholar]
- Nakashiba T, Young JZ, McHugh TJ, Buhl DL, Tonegawa S. Transgenic inhibition of synaptic transmission reveals role of CA3 output in hippocampal learning. Science. 2008;319:1260–1264. doi: 10.1126/science.1151120. [DOI] [PubMed] [Google Scholar]
- Nakazawa K, McHugh TJ, Wilson MA, Tonegawa S. NMDA receptors, place cells and hippocampal spatial memory. Nat Rev Neurosci. 2004;5:361–372. doi: 10.1038/nrn1385. [DOI] [PubMed] [Google Scholar]
- Nicoll RA, Malenka RC. Contrasting properties of two forms of long-term potentiation in the hippocampus. Nature. 1995;377:115–118. doi: 10.1038/377115a0. [DOI] [PubMed] [Google Scholar]
- Nicoll RA, Schmitz D. Synaptic plasticity at hippocampal mossy fibre synapses. Nat Rev Neurosci. 2005;6:863–876. doi: 10.1038/nrn1786. [DOI] [PubMed] [Google Scholar]
- Pelkey KA, McBain CJ. Target-cell-dependent plasticity within the mossy fibre-CA3 circuit reveals compartmentalized regulation of presynaptic function at divergent release sites. J Physiol. 2008;586:1495–1502. doi: 10.1113/jphysiol.2007.148635. [DOI] [PMC free article] [PubMed] [Google Scholar]
- Penttonen M, Kamondi A, Sik A, Acsády L, Buzsaki G. Feed-forward and feed-back activation of the dentate gyrus in vivo during dentate spikes and sharp wave bursts. Hippocampus. 1997;7:437–450. doi: 10.1002/(SICI)1098-1063(1997)7:4<437::AID-HIPO9>3.0.CO;2-F. [DOI] [PubMed] [Google Scholar]
- Pitler TA, Alger BE. Postsynaptic spike firing reduces synaptic GABAA responses in hippocampal pyramidal cells. J Neurosci. 1992;12:4122–4132. doi: 10.1523/JNEUROSCI.12-10-04122.1992. [DOI] [PMC free article] [PubMed] [Google Scholar]
- Pleasure SJ, Collins AE, Lowenstein DH. Unique expression patterns of cell fate molecules delineate sequential stages of dentate gyrus development. J Neurosci. 2000;20:6095–6105. doi: 10.1523/JNEUROSCI.20-16-06095.2000. [DOI] [PMC free article] [PubMed] [Google Scholar]
- Rollenhagen A, Satzler K, Rodriguez EP, Jonas P, Frotscher M, Lubke JH. Structural determinants of transmission at large hippocampal mossy fiber synapses. J Neurosci. 2007;27:10434–10444. doi: 10.1523/JNEUROSCI.1946-07.2007. [DOI] [PMC free article] [PubMed] [Google Scholar]
- Salin PA, Scanziani M, Malenka RC, Nicoll RA. Distinct short-term plasticity at two excitatory synapses in the hippocampus. Proc Natl Acad Sci U S A. 1996;93:13304–13309. doi: 10.1073/pnas.93.23.13304. [DOI] [PMC free article] [PubMed] [Google Scholar]
- Scharfman H, Goodman J, McCloskey D. Ectopic granule cells of the rat dentate gyrus. Dev Neurosci. 2007;29:14–27. doi: 10.1159/000096208. [DOI] [PMC free article] [PubMed] [Google Scholar]
- Scharfman HE, Goodman JH, Sollas AL. Granule-like neurons at the hilar/CA3 border after status epilepticus and their synchrony with area CA3 pyramidal cells: functional implications of seizure-induced neurogenesis. J Neurosci. 2000;20:6144–6158. doi: 10.1523/JNEUROSCI.20-16-06144.2000. [DOI] [PMC free article] [PubMed] [Google Scholar]
- Scott R, Ruiz A, Henneberger C, Kullmann DM, Rusakov DA. Analog modulation of mossy fiber transmission is uncoupled from changes in presynaptic Ca2+ J Neurosci. 2008;28:7765–7773. doi: 10.1523/JNEUROSCI.1296-08.2008. [DOI] [PMC free article] [PubMed] [Google Scholar]
- Staley KJ, Otis TS, Mody I. Membrane properties of dentate gyrus granule cells: comparison of sharp microelectrode and whole-cell recordings. J Neurophysiol. 1992;67:1346–1358. doi: 10.1152/jn.1992.67.5.1346. [DOI] [PubMed] [Google Scholar]
- Szabadics J, Soltesz I. Functional specificity of mossy fiber innervation of GABAergic cells in the hippocampus. J Neurosci. 2009;29:4239–4251. doi: 10.1523/JNEUROSCI.5390-08.2009. [DOI] [PMC free article] [PubMed] [Google Scholar]
- Tamas G, Lorincz A, Simon A, Szabadics J. Identified sources and targets of slow inhibition in the neocortex. Science. 2003;299:1902–1905. doi: 10.1126/science.1082053. [DOI] [PubMed] [Google Scholar]
- Toth K, Freund TF. Calbindin D28k-containing nonpyramidal cells in the rat hippocampus: their immunoreactivity for GABA and projection to the medial septum. Neuroscience. 1992;49:793–805. doi: 10.1016/0306-4522(92)90357-8. [DOI] [PubMed] [Google Scholar]
- Toth K, McBain CJ. Afferent-specific innervation of two distinct AMPA receptor subtypes on single hippocampal interneurons. Nat Neurosci. 1998;1:572–578. doi: 10.1038/2807. [DOI] [PubMed] [Google Scholar]
- Toth Z, Hollrigel GS, Gorcs T, Soltesz I. Instantaneous perturbation of dentate interneuronal networks by a pressure wave-transient delivered to the neocortex. J Neurosci. 1997;17:8106–8117. doi: 10.1523/JNEUROSCI.17-21-08106.1997. [DOI] [PMC free article] [PubMed] [Google Scholar]
- Vida I, Frotscher M. A hippocampal interneuron associated with the mossy fiber system. Proc Natl Acad Sci U S A. 2000;97:1275–1280. doi: 10.1073/pnas.97.3.1275. [DOI] [PMC free article] [PubMed] [Google Scholar]
- Vincent P, Armstrong CM, Marty A. Inhibitory synaptic currents in rat cerebellar Purkinje cells: modulation by postsynaptic depolarization. J Physiol. 1992;456:453–471. doi: 10.1113/jphysiol.1992.sp019346. [DOI] [PMC free article] [PubMed] [Google Scholar]
- West MJ, Slomianka L, Gundersen HJ. Unbiased stereological estimation of the total number of neurons in the subdivisions of the rat hippocampus using the optical fractionator. Anat Rec. 1991;231:482–497. doi: 10.1002/ar.1092310411. [DOI] [PubMed] [Google Scholar]
- Williams PA, Larimer P, Gao Y, Strowbridge BW. Semilunar granule cells: glutamatergic neurons in the rat dentate gyrus with axon collaterals in the inner molecular layer. J Neurosci. 2007;27:13756–13761. doi: 10.1523/JNEUROSCI.4053-07.2007. [DOI] [PMC free article] [PubMed] [Google Scholar]
- Williams SH, Johnston D. Kinetic properties of two anatomically distinct excitatory synapses in hippocampal CA3 pyramidal neurons. J Neurophysiol. 1991;66:1010–1020. doi: 10.1152/jn.1991.66.3.1010. [DOI] [PubMed] [Google Scholar]