

Abstract
The dependence of the effective force on the distance between two DNA molecules was directly computed from a set of extensive all-atom molecular dynamics simulations. The simulations revealed that in a monovalent electrolyte the effective force is repulsive at short and long distances, but can be attractive in the intermediate range. This attractive force is, however, too weak (~5pN per turn of a DNA helix) to induce DNA condensation in the presence of thermal fluctuations. In divalent electrolytes, DNA molecules were observed to form a bound state, where Mg2+ ions bridged minor groves of DNA. The effective force in divalent electrolytes was predominantly attractive, reaching a maximum of 42pN per one turn of a DNA helix.
It is well known that genomic DNA is densely packed inside the cell nucleus and viral capsids. Such close packing suggests that electrostatic repulsion between negatively charged DNA in the condensed state is balanced by counterion-induced attraction1. Indeed, effective attraction between DNA in trivalent and quadrivalent electrolytes has been experimentally demonstrated2. Several theoretical models have been proposed to describe the origin of DNA attraction. Counterion correlation models3, that approximate DNA as a uniformly charged cylinder and neglect discreteness of the DNA charge and other structural features, predict DNA condensation in an electrolyte for ions of valence ≥ 33. The electrostatic zipper model4 accounts for the inhomogeneous charge distribution along DNA but assumes binding of counterions to the DNA grooves, which presumably renders them positively charged. In that model, effective attraction between two DNA molecules originates from interlocking positively charged grooves of one molecule with negatively charged backbone of the other. However, common counterions found in biological cells, such as Na+, K+, Ca2+, and Mg2+ (valence < 3), have high affinity to the DNA backbone, not to DNA grooves5.
Recent small angle x-ray scattering experiments6 demonstrated that short DNA fragments (tens of base pairs) could attract each other in a MgCl2 electrolyte. Synchrotron x-ray diffraction experiments7 showed evidence for attraction between λ-phage DNA in divalent electrolytes when DNA was confined to a two-dimensional cationic surface. It seems that parallel alignment of DNA fragments in the presence of divalent ions facilitates DNA attraction. In contrast to previous studies employing the primitive electrolyte model8, here we report direct observation of DNA attraction in mono- and divalent electrolytes from all-atom MD simulations.
We consider a system containing two double-stranded DNA molecules submerged in a rectangular box of electrolyte, Figure 1. Each DNA duplex, poly(dA10)·poly(dT10), is effectively infinite as each strand is covalently bond to itself over the periodic boundary. Thus, we investigate interaction between parallel DNA at close distances before forming a condensate. The simulation box measured 60×100×32 Å3, and contained about 18,000 atoms. The details of the simulation procedures are provided in Supporting Information.
Figure 1.
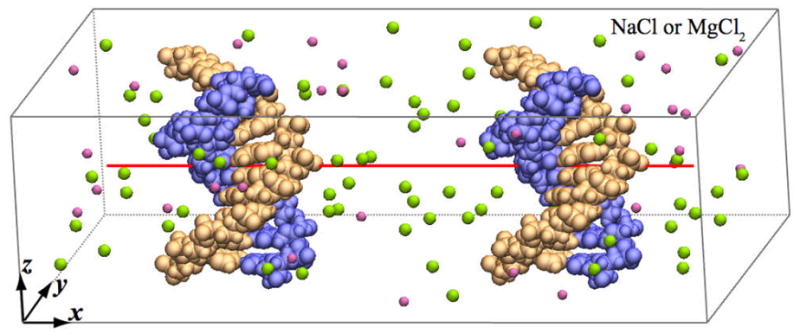
Simulation system. The two DNA strands are shown in blue and orange; pink and green spheres correspond to Cl− and Na+ ions. Water is not shown.
First we simulate free diffusion of DNA in several electrolytes. In these simulations, each DNA molecule could move along the x- and z-axes and rotate about its axis, while translation in the y direction was restrained via a harmonic force. The inter-DNA distance D, defined as the distance between the helical axes of DNA, is plotted versus simulation time in Figure 2 for NaCl (a–c) and MgCl2 (d–e) electrolytes. The shortest distance observed is about one DNA diameter while the longest one is a half of the system size along the x-axis.
Figure 2.
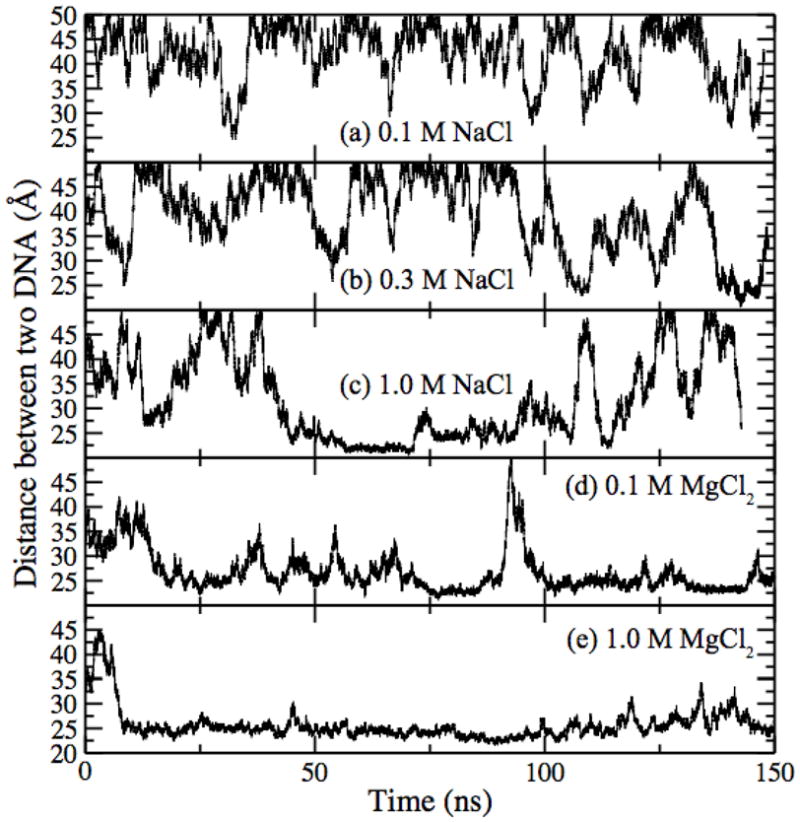
Distance between two DNA molecules versus time. In these simulations, DNA was allowed to freely diffuse along the x- and zaxes. The concentration and type of electrolyte are indicated in each panel.
As the concentration of NaCl increases, the DNA molecules are more likely to stay close to each other. At 1.0 M concentration, the two molecules formed a bound state that lasted for tens of nanoseconds but was eventually broken by a thermal agitation. In a 1.0 M MgCl2 electrolyte, the DNA molecules stayed close to each other (D ~ 24 Å) for most of the simulation trajectory. Thermal fluctuations were observed to transiently increase the inter-DNA distance but could not break the bound state. Even in the case of 0.1 M MgCl2, only one complete unbinding event was observed in 150 ns. These simulations strongly suggest that DNA can pair-wise attract in MgCl2 and high concentration NaCl electrolytes. In experiment6, attraction between multiple DNA molecules was observed even at 10 mM MgCl2.
To quantitatively characterize the interactions between DNA in different electrolytes, we directly measured the mean force using the following procedure. A bias harmonic potential (kspring= 3 nN/Å) was introduced to maintain the distance between DNA at a specified value. The inter-DNA distance was computed between the centers of mass of the phosphorus atoms projected on the xy plane. The force exerted on DNA to maintain the specified distance balanced the effective force between the two DNA molecules. For each value of the inter-DNA distance, a 160-ns MD simulation was performed to average out thermal fluctuations of the force.
Figure 3 shows the effective force F between DNA versus the inter-DNA distance D. In the 0.3 M NaCl electrolyte, the interaction force is repulsive at large and short distances. However, a weakly attractive force is observed at D = 25 Å. In the 1 M MgCl2 electrolyte, the effective force is predominantly attractive; the maximum attractive force is about 42 pN per helical turn. In the small angle X-ray diffraction experiment6, DNA attraction was observed in the presence of Mg2+ but not Na+, which is in agreement with our observations.
Figure 3.

Effective force versus distance. Inset: Potential of mean force obtained by integrating the force-versus-distance curves (open symbols) and the Boltzmann inversion method (solid symbols).
The inset to Figure 3 shows the potential of mean force (PMF) obtained by integrating the force-versus-distance dependence. For DNA in the 1 M MgCl2, the depth of the potential well is about 3.4 kBT per helical turn, close to the experimental estimate9. It is because of this potential well, DNA formed a bound state in the free diffusion simulations, Figure 2e. Although DNA can attract at short distances in the 0.3 M NaCl electrolyte, the attractive potential well in that case is too shallow (< 1 kBT per helical turn) to induce DNA condensation. For comparisons, we used the Boltzmann inversion (BI) procedure10 to compute PMF from the distribution of the inter-DNA distances resulting from the free diffusion simulations (see inset to Figure 3). General features of the PMFs obtained using the two methods appear to be very similar. It is, however, conceivable that much longer simulations are required for the BI method to achieve the accuracy of the direct force measurement.
Conformational analysis of the bound state revealed the mechanism of DNA attraction. In the bound state (Figure 4a), Mg2+ ions reside in the negatively charged pockets formed by phosphate groups of the DNA backbone. While it is possible for a Na+ ion to occupy such a pocket, the resulting attraction is not strong enough for the two DNA molecules to form a bound state. The presence of multiple Na+ ions in the same pocket has a large electrostatic penalty and was not observed.
Figure 4.

Mechanism of DNA attraction. (a) DNA conformation in a bound state. The two DNA molecules are shown in orange and blue; Mg2+ ions are shown in green; water is not shown. The phosphate groups forming the inter-DNA contacts are highlighted. (b) Histograms of ΔL at D = 25 and 30 Å. Each histogram corresponds to a 150-ns MD trajectory.
The relative alignment of the two side-by-side DNA can be characterized by ΔL=ΔLz−LΔθ/(2π), where ΔLz is the relative displacement of the DNA along the z-axis, Δθ is the relative rotation of the molecules about their helical axes, and L (~32 Å) is the length of one helical turn. When the absolute value of ΔL is L/2, the DNA molecules align side-by-side so that their minor grooves level with each other (Figure 4a). As shown in Figure 4b,ΔL is almost evenly distributed at D = 30 Å. However, at D = 25 Å, the distribution of ΔL peaks around L/2, indicating that two DNA molecules align in a minor-groove-to-minor-groove conformation.
In summary, our simulations suggest a possible mechanism of DNA attraction in divalent electrolytes: bridged by Mg2+ ions, DNA interlocks in the minor-grove-to-minor-grove conformation. In monovalent electrolytes, DNA attraction is possible, but too weak to form a stable bound state.
Supplementary Material
Acknowledgments
This work was supported by the NIH grants R01-HG003713 and PHS 5 P41-RR05969. The supercomputer time was provided via LRAC grant MCA05S028.
Footnotes
Supporting Information Available: Details of the MD procedures, an illustrated definition of the alignment parameterΔL, correlation plots of the inter-DNA distance D and ΔL, a plot of the averaged force versus time, and animations of the MD trajectories. This Material is available free of charge via the Internet at http://pubs.acs.org.
References
- 1.Bloomfield VA. Biopolymers. 1997;44:269–282. doi: 10.1002/(SICI)1097-0282(1997)44:3<269::AID-BIP6>3.0.CO;2-T. and references therein. [DOI] [PubMed] [Google Scholar]
- 2.(a) Deng H, Bloomfield VA. Biophys J. 1999;77:1556. doi: 10.1016/S0006-3495(99)77003-7. [DOI] [PMC free article] [PubMed] [Google Scholar]; (b) Yang J, Rau DC. Biophys J. 2005;89:1932. doi: 10.1529/biophysj.105.065060. [DOI] [PMC free article] [PubMed] [Google Scholar]; (c) Besteman K, EIJK K, Lemay SG. Nat Phys. 2007;3:641. [Google Scholar]
- 3.(a) Rouzina I, Bloomfield VA. J Phys Chem. 1996;100:9977. [Google Scholar]; (b) Shklovskii BI. Phys Rev Lett. 1999;82:3268. [Google Scholar]
- 4.Kornyshev AA, Leikin S. Phys Rev Lett. 1999;82:4138. [Google Scholar]
- 5.Tereshko V, Minasov G, Egli M. J Am Chem Soc. 1999;121:470. [Google Scholar]
- 6.Qiu X, Andresen K, Kwok LW, Lamb JS, Park HY, Pollack L. Phys Rev Lett. 2007;99:38104. doi: 10.1103/PhysRevLett.99.038104. [DOI] [PubMed] [Google Scholar]
- 7.Koltover I, Wagner K, Safinya C. Proc Natl Acad Sci USA. 2000;97:14046. doi: 10.1073/pnas.97.26.14046. [DOI] [PMC free article] [PubMed] [Google Scholar]
- 8.Allahyarov E, Gompper G, Löwen H. Phys Rev E. 2004;69:041904. doi: 10.1103/PhysRevE.69.041904. [DOI] [PubMed] [Google Scholar]
- 9.Rau DC, Parsegian VA. Biophys J. 1992;61:260. doi: 10.1016/S0006-3495(92)81832-5. [DOI] [PMC free article] [PubMed] [Google Scholar]
- 10.Bahar I, Kaplan M, Jernigan RL. Proteins: Struct, Func, Bioinf. 1997;29:292. doi: 10.1002/(sici)1097-0134(199711)29:3<292::aid-prot4>3.0.co;2-d. [DOI] [PubMed] [Google Scholar]
Associated Data
This section collects any data citations, data availability statements, or supplementary materials included in this article.