Abstract
Recently, A-836339 [2,2,3,3-tetramethylcyclopropanecarboxylic acid [3-(2-methoxyethyl)-4,5-dimethyl-3H-thiazol-(2Z)-ylidene]amide] (1) was reported to be a selective CB2 agonist with high binding affinity. Here we describe the radiosynthesis of [11C]A-836339 ([11C]1) via its desmethyl precursor as a candidate radioligand for imaging CB2 receptors with positron emission tomography (PET). Whole body and the regional brain distribution of [11C]1 in control CD1 mice demonstrated that this radioligand exhibits specific uptake in the CB2-rich spleen and little specific in vivo binding in the control mouse brain. However, [11C]1 shows specific cerebral uptake in the lipopolysaccharide (LPS)-induced mouse model of neuroinflammation and in the brain areas with Aβ-amyloid plaque deposition in a mouse model of Alzheimer's disease (APPswe/PS1dE9 mice). These data establish a proof of principle that CB2 receptors binding in the neuroinflammation and related disorders can be measured in vivo.
Keywords: neuroinflammation, Alzheimer's disease, cannabinoid receptor, CB2 receptor, positron emission tomography, PET
Introduction
At present there is a high demand for good positron-emission tomography (PET) radioligands for imaging of neuroinflammation that is caused by neurodegenerative (e.g. Alzheimer's1) or autoimmune (multiple sclerosis2) disorders, stroke or trauma3 or brain neoplasia.4 Historically, nearly all neuroinflammation PET radiotracer research dealt with peripheral benzodiazepine receptor (PBR) ligands because PBR is upregulated in microglial cells.5-8 Despite the substantial efforts that have been made in the development of PBR radioligands, PET imaging of neuroinflammation with PBR radioligands is often complicated due to the (a) considerable presence of PBR in intact central nervous system (CNS) and (b) high non-specific binding of the available PBR tracers.8 Development of a PET radiotracer that binds to a different receptor that is upregulated in neuroinflammation is an attractive alternative. One such alternative to PBR is cannabinoid receptor subtype 2 (CB2).
Two cannabinoid receptors, cannabinoid type 1 (CB1) and cannabinoid type 2 (CB2) have been identified as G-protein coupled receptors.9, 10 CB1 receptors are mainly found in the central nervous system,9, 11, 12 but there is also evidence for the expression of CB1 receptors in non-neural tissue.13
In the past, the CB2 receptor was considered to be expressed primarily by the immune system,10, 14, 15 but recently it has been found in the intact CNS tissue in very low concentration.16-18 CB2 receptors are highly expressed in disorders that are associated with inflammation including cancer, pain, osteoporosis, and liver diseases (see for review 19-21). The latest studies have demonstrated an up-regulation of CB2 in microglia in disorders that are associated with neuroinflammation (Alzheimer's disease, multiple sclerosis, human immunodeficiency virus (HIV)-induced encephalitis, and Down's syndrome 22).
Although substantial efforts have been made towards the development of CB1 PET radioligands (see for review23), the absence of adequate PET radioligands has hampered the noninvasive imaging of CB2. Only a few CB2 radioligands have been developed and evaluated in animals as potential PET radioligands24-27 (see for review28). Recently researchers presented a small animal PET study with [11C]GW405833 and [18F]FE-GW405833 in rats with local CB2 overexpression in the right striatum that was induced by stereotactic injection of a CB2 vector.29 The study demonstrated that the in vivo binding of radiotracers was specific which has prompted a search for CB2 PET radioligands with improved imaging profile.
A-836339 [2,2,3,3-tetramethylcyclopropanecarboxylic acid [3-(2-methoxy-ethyl)-4,5-dimethyl-3H-thiazol-(2Z)-ylidene]amide] (1), a selective CB2 agonist with relatively high binding affinity (Ki = 0.7 nM), was recently reported by Abbott Labs.30
This report describes the radiosynthesis of [11C]A-836339 ([11C]1) via a newly synthesized desmethyl precursor. The imaging properties of [11C]1 in control mice and two animal models, a mouse model of neuroinflammation and a mouse model of Alzheimer's disease-related brain amyloidosis, have been evaluated.
Results and Discussions
Chemistry
The first synthesis of (Z)-N-(3-(2-hydroxyethyl)-4,5-dimethylthiazol-2(3H)-ylidene)-2,2,3,3-tetramethylcyclopropanecarboxamide (2) as a precursor for radiolabeling is illustrated in Scheme 1. Briefly, 4,5-dimethylthiazol-2-ylamine (3) was alkylated with 2-bromoethanol (4) to give 2-(2-imino-4,5-dimethylthiazol-3(2H)-yl)ethanol hydrobromide (5). Subsequent reaction with 2,2,3,3-tetramethylcyclopropanecarboxylic acid (6) using benzotriazole-1-yl-oxytris(dimethylamino)-phosphonium hexafluorophosphate (BOP) as the coupling reagent produced 2 in good yield (75%). A model methylation of 2 with methyl iodide (Scheme 1) yielded 1 that was identical to the sample of 1 that has been prepared as described previously.31
Scheme 1.
Synthesis of precursor 2. Reaction conditions: (a) 85 °C, 16 h; (b) BOP/Et3N/CH2Cl2, 20 h; (c) CH3I/NaH/DMF, 0 °C to room temperature, 6 h.
Radiochemistry
[11C]A-836339 ([11C]1) was synthesized by treatment of 2 with [11C]methyl triflate ([11C]MeOTf) in DMF solution in the presence of potassium hydroxide. The total synthesis time was 40 min from the end-of-bombardment (EOB) with a non-decay-corrected radiochemical yield of 26±2% and specific radioactivity at the end-of-synthesis (EOS) of 304 ± 62 GBq/μmol (n=7) (Scheme 2). The radiochemical purity after purification by HPLC and solid-phase extraction was found to be >99%. The final product contained only trace amount of impurities (methanol < 5 ppm (GC analysis); precursor < 10 μg/batch (HPLC analysis)).
Scheme 2.
Radiosynthesis of compound [11C]A-836339 ([11C]1)
The identity of the radiotracer [11C]1 was confirmed by co-injection with non-radioactive reference compound A-836339 (1) onto an analytical HPLC system (HPLC traces are not shown). The final product [11C]1 was formulated as a sterile solution in saline with 8% alcohol.
In vivo experiments
Early studies in rodents have demonstrated that CB2 receptors are mainly present within the immune system with no quantifiable CB2 receptor in the brain.10, 14 Sanofi researchers demonstrated that the CB2 gene in human tissues was not expressed in the brain, but it was particularly plentiful in immune tissues. Although CB2 mRNA was also detected in some other peripheral tissues, its level remained very low. In the spleen and tonsils, the CB2 mRNA content was comparable to that of CB1 mRNA in the central nervous system.15 Recent studies have identified a presence of CB2 on brainstem neurons17 and have detected CB2 in a number of brain regions, all at levels much lower than those of CB1 receptors.16, 18
CB2 receptors are upregulated in neuroinflammation in the human brain in various disorders including Alzheimer's disease, multiple sclerosis, HIV-induced encephalitis, and Down's syndrome, stroke or trauma3 or brain neoplasia4 (see for review19-22). Recent studies have demonstrated that in human gliomas the immunoreactivity of CB1 is lower whereas the immunoreactivity of CB2 is 4-7 times greater than in normal post-mortem brain tissue.32
Currently, a CB2 PET radioligand for human studies is not available. To our knowledge, quantitative data on the binding density (Bmax) of CB2 receptor with CB2-selective radioligands in neuroinflammation are not currently available. Therefore, it is difficult to predict what in vitro properties (CB2 binding affinity, lipophilicity etc) are necessary for a suitable CB2 PET radioligand. In order to evaluate the CB2 imaging properties of [11C]1 in neuroinflammation we studied the radioligand in control mice and two animal models (LPS-treated mice, a common model of neuroinflammation33 and APPswe/PS1dE9 transgenic mouse model of Alzheimer's disease (see Methods)).
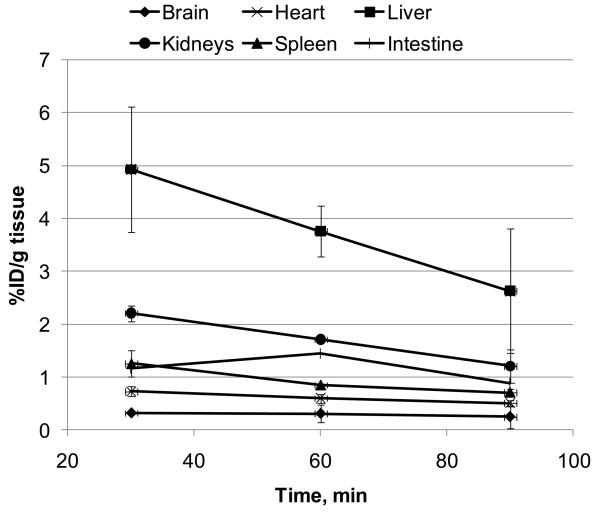
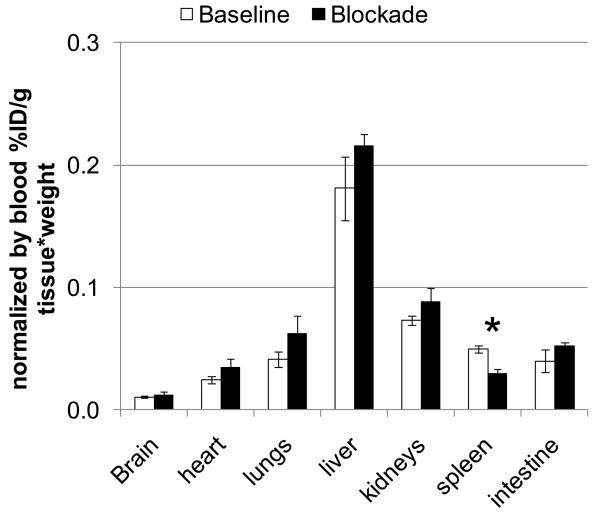
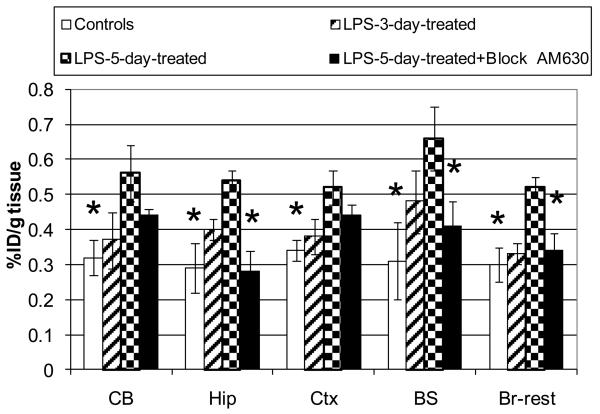
The initial in vivo regional distribution study of [11C]1 was performed in CD1 mice. The whole body time-activity curve demonstrated that uptake of [11C]1 in the brain (0.3 %ID/g tissue) is lower than in all other organs studied including spleen, heart, liver, kidney and intestine (1.3, 0.7, 4.9, 2.2 and 1.5 %ID/g tissue, respectively) (Fig. 1, 2). In the control mice, the regional distribution in the brain at 60 min (Fig. 3) was uniform (about 0.3 %ID/g tissue) in all brain regions studied (cerebellum, hippocampus, cortex, brainstem and rest of brain).
Figure 1.
Time-activity curves of [11C]1 radioactivity (%ID/g tissue, mean ± SD (n=3)) in the various regions of CD1 mice.
Figure 2.
Whole body distribution of [11C]1 radioactivity (. Mean ± SD, n=3) in CD1 mice, 60 min after injection in the baseline study (white bars) and after blockade with AM-630 (3 mg/kg) (black bars). There was significant blocking in the spleen and no blocking in all other regions. *P < 0.05 (ANOVA single – factor analysis).
Figure 3.
Comparison of the regional brain distribution of [11C]1 radioactivity (%ID/g tissue±SD, n=3) in control mice and LPS-treated mice. Abbreviators: CB = cerebellum, Hip = hippocampus, Ctx = cortex, BS = brainstem, Br-rest = rest of brain. Group 1: control CD1 mice (Legend = controls); Group 2: CD1 mice were treated with LPS three days before the radioligand study (Legend = LPS-3-day-treated); Group 3: CD1 mice were treated with LPS five days before the radioligand study (Legend = LPS-5-day-treated); Group 4: CD1 mice were treated with LPS five days before the radioligand study and AM630 was injected 30 min prior the radioligand (Legend = LPS-5-day-treated+Block AM630). Radioactivity accumulation in the brain regions of Group 3 is significantly greater than those of Group 1 (all brain regions) or 4 (Hip, BS, Br-rest): *P < 0.05 (ANOVA, single – factor analysis). The data suggests that radioligand [11C]1 specifically binds at cerebral CB2 receptors in the LPS neuroinflammation mouse model (Group 3).
A blocking dose of the selective CB2 antagonist AM630 significantly inhibited [11 C]1 binding in the spleen at 60 min after administration, whereas all other studied regions including brain did not show a significant difference in comparison with the baseline (Fig. 2). These results suggest that in vivo binding [11C]1 in the spleen is specific and it is mediated by the CB2 receptors, whereas the binding in all other regions including brain is mostly non-specific. This is in agreement with known distribution of the CB2 receptors.10, 14-16, 18
A comparison of the regional brain distribution of [11C]1 in the control CD1 (Group 1) and LPS-treated CD1 mice (Groups 2 and 3) demonstrated an increased uptake in all brain regions of the LPS-treated mice (Fig. 3). The mice that were treated with LPS three days before (Group 2) the radioligand study showed an insignificant increase, whereas the difference was significant in all brain regions of the mice that were treated with LPS five days before the study (Group 3) (Fig. 3). The regional uptake ratio of Group 3 to Group 1 was greatest in the brainstem (2.1) and hippocampus (1.9) and slightly lower in the cerebellum, cortex and the rest of the brain (1.8, 1.7 and 1.5, respectively).
In order to demonstrate that [11C]1 uptake in the LPS-treated mice was specific, we performed a blocking experiment in the LPS-5-day mice with the CB2 selective ligand AM630 (Group 4) (Fig. 3). This blocking study was done simultaneously with baseline experiments using the same batch of [11C]1. The blockade study (Group 4) showed a significant reduction of [11C]1 radioactivity in the brainstem, hippocampus and the rest of the brain versus that in Group 3. In the cortex and cerebellum there was insignificant blockade of [11C]1 radioactivity (P>0.05, ANOVA).
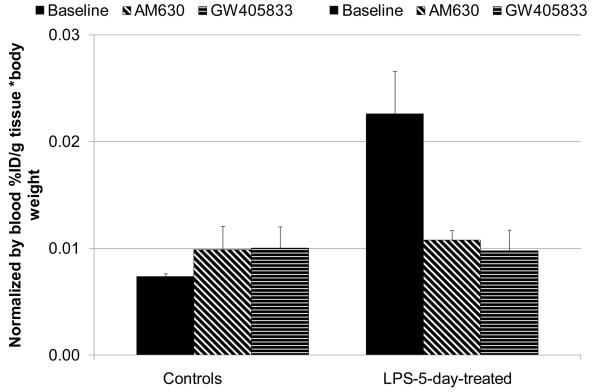
Because the LPS-treated mice may exhibit a change in blood flow when compared to control mice, we determined normalized whole brain uptake of [11C]1 radioactivity in the control and LPS-5-day mice (Fig. 4). The ratio of the whole brain normalized uptake in the LPS-treated versus control mice was 3.3. As expected, blocking experiments with AM630 and GW405833 in the control CD1 mice demonstrated little difference in the normalized uptake in the baseline and blockade studies suggesting that specific binding of [11C]1 in the normal brain is low. However, the blockade study in the LPS-5-day mice that received AM630 and GW405833 showed 78% and 84% reduction of the specific binding, correspondingly, if the control CD1 mice were used as a measure of non-specific binding. These results with the blood normalization (Fig. 4) agree with results without the blood normalization (Fig. 3) and suggest that the cerebral binding of [11C]1 in the mouse model of neuroinflammation is mediated by the CB2 receptor.
Figure 4.
Comparison of normalized whole brain uptake of [11C]1 radioactivity (. Mean ± SD, n=3) in baseline and blocking experiments with CB2 ligands AM630 and GW405833 in control CD1 mice and LPS-5-day-treated mice, 60 min after injection. The data suggest that CD1 mice manifest little cerebral specific binding of [11C]1, whereas the LPS-5-day-treated mice display significant specific CB2 binding in the whole brain. *P < 0.05, **P > 0.05 (ANOVA, single – factor analysis).
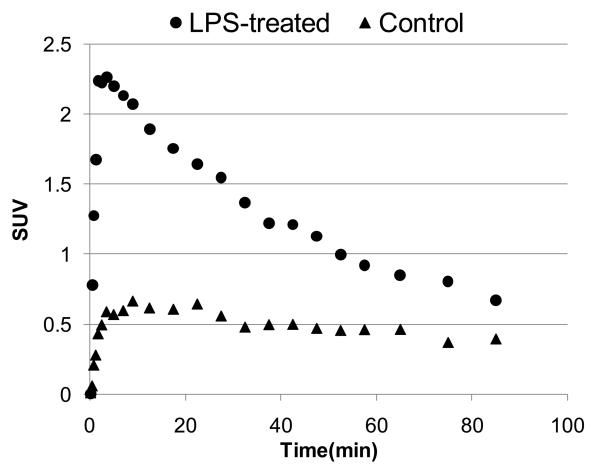
The dissection studies with LPS-treated mice that are shown above (Figs. 3,4) have been confirmed in the dynamic small animal PET experiment (Fig. 5). The time-uptake curves of [11C]1 radioactivity in whole brain of LPS-5-day-treated mouse demonstrated the peak (SUV = 2.3) concentration of radioactivity at 3 min post injection followed by washout. The cerebral uptake of [11C]1 in the control mouse was substantially lower (SUV = 0.5). These results suggest that [11C]1 can be used for PET imaging of neuroinflammation.
Figure 5.
Time - SUV (standardized uptake value) curves of [11C]1 in the whole brain of LPS-5-day-treated and control CD1 mice.
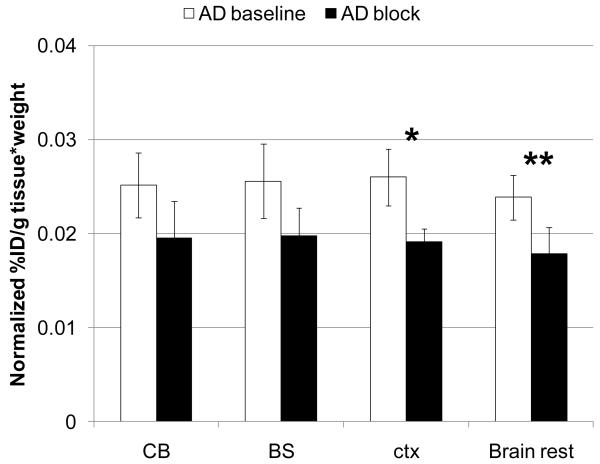
Brain regional distribution and blocking studies were also performed in the APPswe/PS1dE9 mouse model of Alzheimer's disease (Fig. 6). The study showed comparable regional distribution of [11C]1 in the cerebellum, brainstem, cortex and the rest of brain. The blockade with a CB2 ligand AM630 displayed an insignificant reduction of radioactivity uptake in the cerebellum and brainstem and significant reduction in the cortex and rest of brain. The uptake differences between baseline and blockade in the cerebellum, brainstem, cortex and rest of brain were 29%, 29%, 36% and 33%, respectively. The reduction of the CB2 specific binding is consistent with distribution of the Aβ amyloid plaques in this model of Alzheimer's disease.34, 35 APPswe/PS1dE9 mice have significant Aβ amyloid deposition in the cortex, hippocampus, amygdala, and other structures of forebrain whereas the striatum and brain stem are relatively spared of Aβ aggregates.36
Figure 6.
Comparison of normalized whole brain uptake (60 min time point) of [11C]1 radioactivity ) in AD mice in baseline and blocking experiments with CB2 ligand AM630 (2 mg/kg, s.c.). *P = 0.007, **P = 0.04(ANOVA, single – factor analysis). Abbreviators: CB = cerebellum, BS = brainstem, ctx = cortex, Brain rest = the rest of brain. The data suggest that AD mice manifest significant specific binding of [11C]1 in the cortex and rest of brain.
The difference between control and AD mouse can be potentially increased if a CB2 radioligand with improved imaging properties is developed. [11C]1 is a lipophilic compound with relatively high non-specific binding. Future CB2 PET radioligand development research should aim for compounds with greater binding affinity and lower lipophilicity.
Materials and Methods
Chemistry
All chemicals were purchased from Sigma-Aldrich (Milwaukee, WI) and used as received. Column flash chromatography was carried out using E. Merck silica gel 60F (230–400 mesh). Analytical thin-layer chromatography (TLC) was performed on plastic sheets coated with silica gel 60 F254 (0.25 mm thickness, Macherey-Nagel). 1H-NMR (nuclear magnetic resonance) spectra were recorded with a Varian-400 NMR spectrometer at nominal resonance frequencies of 400 MHz in [2H]chloroform (CDCl3) (referenced to internal tetramethylsilane (TMS) at δH 0 ppm). The chemical shifts (δ) were expressed in parts per million (ppm). Coupling constant (J) values were given in Hertz.
[3-(2-hydroxyethyl)-4,5-dimethyl-3H-thiazol-(2Z)-ylidene]amide hydrobromide (5) (Scheme 1)
A mixture of 4,5-dimethylthiazol-2-ylamine 3 (2.0 g, 15.6 mmol) and 2-bromoethanol 4 (2.92 g, 23.2 mmol) was heated at 85 °C for 16 h. The mixture was cooled to ambient temperature and then triturated with propan-2-ol. The solid was collected by filtration and dried under vacuum to provide compound 3 as a white solid (2.45 g, 62%). 1H NMR (400 MHz, DMSO-d6/TMS) δ 9.33 (s, 1H, NH), 5.15 (br s, 1H, OH), 4.04 (t, J=4.8 Hz, 2H, HOCH2), 3.63-3.66 (m, 2H, HOCH2CH2N), 2.19 (s, 6H, 2CH3 on thiazole ring); HRMS (TOF-ESI) Calcd for C7H13N2OS (MH+): 173.0748. Found: 173.0743.
[2,2,3,3-tetramethylcyclopropanecarboxylic acid[3-(2-hydroxyethyl)-4,5-dimethyl-3H-thiazol(2Z)-ylidene]amide (2)
Small portions of 2, 2, 3, 3-tetramethylcyclopropanecarboxylic acid 6 (0.176 g, 1.24 mmol) were added to a solution containing 5 (313 mg, 1.24 mmol) and triethylamine (0.51 mL, 3.66 mmol) in dichloromethane (6 mL). Then small portions of BOP (0.73 g, 1.66 mmol) were added. The mixture was stirred at room temperature for 20 h. The reaction mixture was then hydrolyzed with 5 mL of cold water, the organic phase washed with 2% HCl, 5% sodium carbonate and brine, and dried over sodium sulfate. The solvent was removed and the crude product was purified by flash chromatography using ethylacetate (EtOAc) / hexanes (1:1) to yield product 2 as a white solid (276 mg, 75%). 1H NMR (400 MHz, CDCl3/TMS) δ 5.87 (s, 1H, OH), 4.27 (m, 2H, HOCH2), 3.96 (m, 2H, HOCH2CH2N), 2.17 (s, 3H, CH3 on thiazole ring), 2.16 (s, 3H, CH3 on thiazole ring), 1.46 (s, 1H, CH), 1.32 (s, 6H, 2CH3 on cyclopropane), 1.20 (s, 6H, 2CH3 on cyclopropane); HRMS (TOF-ESI) Calcd for C15H25N2O2S (MH+): 297.1637. Found: 297.1631.
[2,2,3,3-tetramethylcyclopropanecarboxylic acid [3-(2-methyloxyethyl)-4,5-dimethyl-3H-thiazol-(2Z)-ylidene]amide (A-836339, 1)
Sodium hydride (8 mg, 60%, 0.162 mmol) was added to a solution of 2 (24 mg, 0.081 mmol) in anhydrous dimethylformamide (1.5 mL) at 0 °C. The mixture was stirred for 15 min at 0 °C. Methyl iodide (100 mg, 0.70 mmol) was added. The reaction mixture was allowed to warm to room temperature and stirred for 6 h. The mixture was then poured into cold water (10 mL) and extracted with ethyl acetate (3 × 20 mL). The organic layers were combined, washed with brine, dried over sodium sulfate, filtered and concentrated in a vacuum. The residue was purified via flash chromatography on silica gel (EtOAc /hexanes 2:1) to yield 1 (20 mg, 78%). 1H NMR (400 MHz, CDCl3/TMS) δ 4.24 (t, J=5.2 Hz and 5.6 Hz, 2H), 3.69 (t, J=5.2 Hz and 5.6 Hz, 2H), 3.31 (s, 3H), 2.20 (s, 3H), 2.15 (s, 3H), 1.53 (s, 1H), 1.34 (s, 3H), 1.21 (s, 3H). The NMR spectrum of 1 matches the spectrum that was described previously.30
Radiochemistry
The high performance liquid chromatography (HPLC) system consisted of Waters model 600 pumps, Rheodyne model 7126 injectors, an in-line Waters model 441 UV detector (254 nm) and a Bioscan FC-3200 NaI detector connected to a FC-1000 base unit. Gas chromatography (GC) was performed with a Varian 3800 GC fitted with a 4810 Auto-Sampler and using a split/splitless injector and a FID detector. The GC column is a Phenomenex ZB-WAX 30 meter column, 0.25mm ID, 0.25um film. All HPLC and GC chromatograms were recorded and analyzed with Varian Galaxy Chromatography Data System software. The analytical and semi-preparative HPLC were performed using Phenomenex Luna C-18 columns (analytical 4.6 × 250 mm, 5 μm and semi-preparative 10 × 250 mm, 10 μm).
A dose calibrator (Capintec 15R) was used for all radioactivity measurements. [11C]Methyl iodide was prepared using a Methyl Iodide Microlab module (General Electric) and a PETtrace biomedical cyclotron (General Electric). [11C]Methyl triflate was prepared by reaction of [11C]methyl iodide with silver triflate.
[11C]A-836339 ([11C]1) (Scheme 2)
The precursor 2 (~1 mg, 4.4 μmol) was dissolved in anhydrous dimethylformamide (200 μL) and 2 M KOH (5 μL) was added. The vial was sealed and the solution was shaken for 5 min. The [11C]methyl triflate, carried by a stream of helium, was trapped in the precursor solution. The reaction mixture was heated at 80 °C for 3 min. The crude reaction mixture was diluted with 0.05 M HCl (200 μL) and applied onto a semi-preparative HPLC column (Phenomenex Luna C-18, 10 μm column 10 × 250 mm). The column was eluted with methanol/0.1 M ammonium formate buffer (78:22 v/v) at a flow rate of 12 mL/min. The product peak, having a retention time of 6-7 min (tRprecursor = 3.5-4.5 min), was collected in a flask containing 50 mL water. The water solution was transferred through a Waters C18 Sep-Pak Plus and the Sep-Pak was rinsed with 10 mL water. The product was eluted with 1 mL ethanol through a 0.2 μm sterile filter unit (Millex FG, Millipore) into a sterile vial and diluted with 10 mL of 0.9% saline through the Sep-Pak and filter. The final product [11C]A-836339 ([11C]1) was then analyzed by analytical HPLC (78:22 v/v methanol/0.1 M ammonium formate, 3 mL/min, tRproduct = 6 min, tRprecursor = 3 min) to determine the radiochemical and chemical purities and the specific radioactivity. Residual organic solvents in the final product were determined by GC.
In vivo experiments
Baseline Dissection Studies in Mice
CD-1 mice (all males, 23-28 g) from the Charles River Laboratories (Wilmington, MA) or LPS-treated CD1 mice or AD mice (see below) were used in the animal experiments. The animals were sacrificed by cervical dislocation at various times following injection of [11C]1 (5 - 7 mBq, specific radioactivity ~150 GBq/μmol, in 0.2 mL saline) into a lateral tail vein.
The body organs and brains were rapidly removed and dissected on ice. The organs and brain regions of interest were weighed and their radioactivity content was determined in a γ-counter with a counting error below 3%. Aliquots of the injectate were used as standards and their radioactivity content was counted along with the tissue samples. The percent of injected dose per gram of tissue (%ID/g tissue) or percent of injected dose per gram of tissue per body weight that was normalized by blood were calculated. All animal protocols were approved by the Animal Care and Use Committee of the Johns Hopkins University.
Blocking Dissection Studies in Mice
In vivo CB2 receptor blocking studies were carried out by subcutaneous (s.c.) administration of 3 mg/kg of AM630, a CB2 selective antagonist/inverse agonist, or 2 mg/kg of GW405833, a CB2 selective partial agonist (the blocking drugs were obtained from Tocris Bioscience), followed by i.v. injection of [11C]1 (5 - 7 mBq, specific radioactivity ~150 GBq/μmol) 30 min thereafter. The drugs were dissolved in dimethylsulfoxide (DMSO) and administered in a volume of 0.1 mL. Control animals were injected with 0.1 mL of the vehicle. Organs and brain tissues were harvested in 60 min after administration of [11C]1 and their radioactivity content was determined.
Small Animal PET
The small animal PET scan has been performed with eXplore VISTA dual-ring small animal PET scanner (GE Healthcare). A control CD1 mouse (Charles River) and LPS-5-day-treated CD1 mouse (see below) were anesthetized with isoflurane (0.5%–1%; approximately 1 L/min). The radiotracer [11C]1 (7.4 MBq or 0.2 mCi of in 0.2 mL of saline; specific radioactivity ~ 3000 mCi/μmol) was injected simultaneously in both animals via the tail vein. Following injection, the mice were imaged for 90 min using a 28 dynamic frame protocol (3×20s, 3×40s, 5×60s, 6×120s, 8×300s, 3×600s). PET images were reconstructed using a 2D OSEM algorithm after subtracting the scatter component from the sinogram images. Mean images were created and they were used for drawing region of interest (ROI) on whole brain. The ROIs were applied to the dynamic images to generate time - SUV curves.
LPS-treated mice
The neuroinflammation model in the LPS-treated mice has been described in the literature.33 In brief, male CD1 mice were injected intraperitoneally with a single dose (5 mg/kg in saline) of lipopolysaccharide (LPS, strain O111:B4) that was purchased from Calbiochem (San Diego, CA). Food and water were available ad libitum throughout the study, a 12-h day/night cycle was in effect and the LPS-treated mice were used for the radioligand studies in three or five days post the LPS treatment.
Mouse model of Alzheimer's disease
APPswe-PS1dE9 bigenic mice (line 85) were used as a mouse model of Alzheimer disease-related Aβ brain amyloidosis. These bigenic mice were created by co-injection of two transgenes allowing for a co-segregation of the transgenes as a single locus37 and backcrossed to C57Bl/6J background for >15 generations. The APPswe transgene encodes a mouse–human hybrid transgene containing the mouse sequence in the extra- and intracellular regions, and a human sequence within the Aβ domain with Swedish mutations K594N/M595L.38 The PS1dE9 transgene encodes the exon-9 deleted human PS1.39 Both transgenes are co-expressed under the control of the mouse prion promoter39 resulting in plaque deposition beginning at 5–6 months.34 Eighteen month old female APPswe-PS1dE9 mice and their non-transgenic sex-matched littermates were used in the study. At this age, mice have significant Aβ amyloid deposition in the cortex, hippocampus, and amygdala whereas the striatum is relatively spared.34, 35 Significant Aβ amyloid plaque burden results in neuroinflammation as demonstrated by an increased production of prostaglandins,40 an inflammatory response by glial cells41 and the release of an array of inflammatory mediators.42 The local inflammatory response to Aβ amyloid plaque has been observed in a number of mouse models of AD42 and similar to AD brain is mediated by activated microglia and reactive astrocytes that surround the senile plaques.1, 43
Conclusion
In summary, [11C]A-836339 ([11C]1), a high affinity CB2 radioligand for PET imaging, was synthesized via its des-methyl precursor at high specific radioactivity and radiochemical purity and in sufficient radiochemical yield for animal studies.
Whole body and the regional brain distribution of [11C]1 in mice demonstrated that (1) in the control CD1 mice [11C]1 binds specifically in the spleen, an organ with high CB2 receptor density, but, as expected, [11C]1 manifest little specific in vivo binding in the brain; (2) [11C]1 exhibits high specific CB2 cerebral uptake (78-84%) in the LPS-induced mouse model of neuroinflammation; and (3) in the mouse model of Alzheimer's disease [11C]1 displays significant specific CB2 binding (29-33%) in various brain regions that is consistent with distribution of the Aβ amyloid plaques in this model of Alzheimer's disease.
The results of cerebral small animal PET/[11C]1 study with LPS-treated (SUV = 2.3) and control (SUV = 0.5) mice suggest an applicability of CB2 radioligands for PET imaging of neuroinflammation.
These data establish a proof of principle that CB2 receptors binding in the neuroinflammation can be measured in vivo. The new radioligand [11C]1 is a potential candidate for PET imaging studies of CB2 receptors in neuroinflammation and related disorders. Further development of CB2 radioligands with improved imaging properties is warranted.
Supplementary Material
Acknowledgements
We thank Drs. Mikhail Pletnikov and Catherine A. Foss for fruitful discussions, Dr. Richard L. Wahl for fruitful discussions and support and Dr. Ursula Scheffel for help with animal experiments. The authors would like to thank Ms. Judy Buchanan for editorial assistance. This research was supported in part by the NIH grant MH079017 (AGH) and the Division of Nuclear Medicine, Johns Hopkins School of Medicine.
Footnotes
Publisher's Disclaimer: This is a PDF file of an unedited manuscript that has been accepted for publication. As a service to our customers we are providing this early version of the manuscript. The manuscript will undergo copyediting, typesetting, and review of the resulting proof before it is published in its final citable form. Please note that during the production process errors may be discovered which could affect the content, and all legal disclaimers that apply to the journal pertain.
REFERENCES AND NOTES
- 1.Wyss-Coray T. Nat. Med. 2006;12:1005. doi: 10.1038/nm1484. [DOI] [PubMed] [Google Scholar]
- 2.Chavarria A, Alcocer-Varela J. Autoimmun Rev. 2004;3:251. doi: 10.1016/j.autrev.2003.09.006. [DOI] [PubMed] [Google Scholar]
- 3.Nimmo AJ, Vink R. Recent Pat CNS Drug Discov. 2009;4:86. doi: 10.2174/157488909788452997. [DOI] [PubMed] [Google Scholar]
- 4.Streit WJ, Conde JR, Fendrick SE, Flanary BE, Mariani CL. Neurol. Res. 2005;27:685. doi: 10.1179/016164105X49463a. [DOI] [PubMed] [Google Scholar]
- 5.Ouchi Y. Rinsho Shinkeigaku. 2009;49:925. doi: 10.5692/clinicalneurol.49.925. [DOI] [PubMed] [Google Scholar]
- 6.Van Camp N, Boisgard R, Kuhnast B, Theze B, Viel T, Gregoire MC, Chauveau F, Boutin H, Katsifis A, Dolle F, Tavitian B. Eur. J. Nucl. Med. Mol. Imaging. 2010;37:962. doi: 10.1007/s00259-009-1353-0. [DOI] [PubMed] [Google Scholar]
- 7.Kannan S, Balakrishnan B, Muzik O, Romero R, Chugani D. J. Child Neurol. 2009;24:1190. doi: 10.1177/0883073809338063. [DOI] [PMC free article] [PubMed] [Google Scholar]
- 8.Chauveau F, Boutin H, Van Camp N, Dolle F, Tavitian B. Eur. J. Nucl. Med. Mol. Imaging. 2008;35:2304. doi: 10.1007/s00259-008-0908-9. [DOI] [PubMed] [Google Scholar]
- 9.Matsuda LA, Lolait SJ, Brownstein MJ, Young AC, Bonner TI. Nature. 1990;346:561. doi: 10.1038/346561a0. [DOI] [PubMed] [Google Scholar]
- 10.Munro S, Thomas KL, Abu-Shaar M. Nature. 1993;365:61. doi: 10.1038/365061a0. [DOI] [PubMed] [Google Scholar]
- 11.Hohmann AG, Herkenham M. Neuroscience. 1999;90:923. doi: 10.1016/s0306-4522(98)00524-7. [DOI] [PubMed] [Google Scholar]
- 12.Price TJ, Helesic G, Parghi D, Hargreaves KM, Flores CM. Neuroscience. 2003;120:155. doi: 10.1016/S0306-4522(03)00333-6. [DOI] [PMC free article] [PubMed] [Google Scholar]
- 13.Tokanovic S, Malone DT, Ventura S. Br. J. Pharmacol. 2007;150:227. doi: 10.1038/sj.bjp.0706952. [DOI] [PMC free article] [PubMed] [Google Scholar]
- 14.Schatz AR, Lee M, Condie RB, Pulaski JT, Kaminski NE. Toxicol. Appl. Pharmacol. 1997;142:278. doi: 10.1006/taap.1996.8034. [DOI] [PubMed] [Google Scholar]
- 15.Galiegue S, Mary S, Marchand J, Dussossoy D, Carriere D, Carayon P, Bouaboula M, Shire D, Le Fur G, Casellas P. Eur. J. Biochem. 1995;232:54. doi: 10.1111/j.1432-1033.1995.tb20780.x. [DOI] [PubMed] [Google Scholar]
- 16.Gong JP, Onaivi ES, Ishiguro H, Liu QR, Tagliaferro PA, Brusco A, Uhl GR. Brain Res. 2006;1071:10. doi: 10.1016/j.brainres.2005.11.035. [DOI] [PubMed] [Google Scholar]
- 17.Van Sickle MD, Duncan M, Kingsley PJ, Mouihate A, Urbani P, Mackie K, Stella N, Makriyannis A, Piomelli D, Davison JS, Marnett LJ, Di Marzo V, Pittman QJ, Patel KD, Sharkey KA. Science. 2005;310:329. doi: 10.1126/science.1115740. [DOI] [PubMed] [Google Scholar]
- 18.Ashton JC, Friberg D, Darlington CL, Smith PF. Neurosci. Lett. 2006;396:113. doi: 10.1016/j.neulet.2005.11.038. [DOI] [PubMed] [Google Scholar]
- 19.Pertwee RG. Br. J. Pharmacol. 2009;156:397. doi: 10.1111/j.1476-5381.2008.00048.x. [DOI] [PMC free article] [PubMed] [Google Scholar]
- 20.Pisanti S, Bifulco M. Pharmacol. Res. 2009;60:107. doi: 10.1016/j.phrs.2009.03.011. [DOI] [PubMed] [Google Scholar]
- 21.Ashton JC. Current Opinion in Investigational Drugs. 2007;8:373. [PubMed] [Google Scholar]
- 22.Benito C, Tolon RM, Pazos MR, Nunez E, Castillo AI, Romero J. Br. J. Pharmacol. 2008;153:277. doi: 10.1038/sj.bjp.0707505. [DOI] [PMC free article] [PubMed] [Google Scholar]
- 23.Horti AG, Van Laere K. Curr. Pharm. Des. 2008;14:3363. doi: 10.2174/138161208786549380. [DOI] [PubMed] [Google Scholar]
- 24.Evens N, Bosier B, Lavey BJ, Kozlowski JA, Vermaelen P, Baudemprez L, Busson R, Lambert DM, Van Laere K, Verbruggen AM, Bormans GM. Nucl. Med. Biol. 2008;35:793. doi: 10.1016/j.nucmedbio.2008.07.004. [DOI] [PubMed] [Google Scholar]
- 25.Evens N, Muccioli GG, Houbrechts N, Lambert DM, Verbruggen AM, Van Laere K, Bormans GM. Nucl. Med. Biol. 2009;36:455. doi: 10.1016/j.nucmedbio.2009.01.009. [DOI] [PubMed] [Google Scholar]
- 26.Gao M, Wang M, Miller KD, Hutchins GD, Zheng QH. Bioorg. Med. Chem. doi: 10.1016/j.bmc.2010.02.011. [DOI] [PubMed] [Google Scholar]
- 27.Fujinaga M, Kumata K, Yanamoto K, Kawamura K, Yamasaki T, Yui J, Hatori A, Ogawa M, Yoshida Y, Nengaki N, Maeda J, Zhang MR. Bioorg. Med. Chem. Lett. 2010;20:1565. doi: 10.1016/j.bmcl.2010.01.074. [DOI] [PubMed] [Google Scholar]
- 28.Evens N, Bormans GM. Current Topics in Medicinal Chemistry. 2010 doi: 10.2174/156802610793176819. in press. [DOI] [PubMed] [Google Scholar]
- 29.Evens N, Vandeputte C, Toelen J, Baekelandt V, Debyser Z, Verbuggen A, Van Laere K, Bormans G. Eur. J. Nucl. Med. Mol. Imaging. 2009;36:S222. [Google Scholar]
- 30.Yao BB, Hsieh G, Daza AV, Fan Y, Grayson GK, Garrison TR, El Kouhen O, Hooker BA, Pai M, Wensink EJ, Salyers AK, Chandran P, Zhu CZ, Zhong C, Ryther K, Gallagher ME, Chin CL, Tovcimak AE, Hradil VP, Fox GB, Dart MJ, Honore P, Meyer MD. J. Pharmacol. Exp. Ther. 2009;328:141. doi: 10.1124/jpet.108.145011. [DOI] [PubMed] [Google Scholar]
- 31.Dart MJ, Carroll WA, Florjancic AS, Frost JM, Gallagher ME, Li T, Nelson DW, Patel MV, Peddi S, Perez-Medrano A, Ryther KB, Tietje KR, Kolasa T. 2007:227. WO 2007140385 A2 20071206. [Google Scholar]
- 32.Jesus ML, Hostalot C, Garibi JM, Salles J, Meana JJ, Callado LF. Neurochem. Int. 2010 doi: 10.1016/j.neuint.2010.03.007. in press, doi:10.1016/j.neuint.2010.03.007. [DOI] [PubMed] [Google Scholar]
- 33.Qin L, Wu X, Block ML, Liu Y, Breese GR, Hong JS, Knapp DJ, Crews FT. Glia. 2007;55:453. doi: 10.1002/glia.20467. [DOI] [PMC free article] [PubMed] [Google Scholar]
- 34.Jankowsky JL, Fadale DJ, Anderson J, Xu GM, Gonzales V, Jenkins NA, Copeland NG, Lee MK, Younkin LH, Wagner SL, Younkin SG, Borchelt DR. Hum. Mol. Genet. 2004;13:159. doi: 10.1093/hmg/ddh019. [DOI] [PubMed] [Google Scholar]
- 35.Savonenko A, Xu GM, Melnikova T, Morton JL, Gonzales V, Wong MP, Price DL, Tang F, Markowska AL, Borchelt DR. Neurobiol. Dis. 2005;18:602. doi: 10.1016/j.nbd.2004.10.022. [DOI] [PubMed] [Google Scholar]
- 36.Liu Y, Yoo MJ, Savonenko A, Stirling W, Price DL, Borchelt DR, Mamounas L, Lyons WE, Blue ME, Lee MK. J. Neurosci. 2008;28:13805. doi: 10.1523/JNEUROSCI.4218-08.2008. [DOI] [PMC free article] [PubMed] [Google Scholar]
- 37.Jankowsky JL, Slunt HH, Ratovitski T, Jenkins NA, Copeland NG, Borchelt DR. Biomol Eng. 2001;17:157. doi: 10.1016/s1389-0344(01)00067-3. [DOI] [PubMed] [Google Scholar]
- 38.Borchelt DR, Davis J, Fischer M, Lee MK, Slunt HH, Ratovitsky T, Regard J, Copeland NG, Jenkins NA, Sisodia SS, Price DL. Genet. Anal. 1996;13:159. doi: 10.1016/s1050-3862(96)00167-2. [DOI] [PubMed] [Google Scholar]
- 39.Borchelt DR, Ratovitski T, van Lare J, Lee MK, Gonzales V, Jenkins NA, Copeland NG, Price DL, Sisodia SS. Neuron. 1997;19:939. doi: 10.1016/s0896-6273(00)80974-5. [DOI] [PubMed] [Google Scholar]
- 40.Melnikova T, Savonenko A, Wang Q, Liang X, Hand T, Wu L, Kaufmann WE, Vehmas A, Andreasson KI. Neuroscience. 2006;141:1149. doi: 10.1016/j.neuroscience.2006.05.001. [DOI] [PubMed] [Google Scholar]
- 41.Zelcer N, Khanlou N, Clare R, Jiang Q, Reed-Geaghan EG, Landreth GE, Vinters HV, Tontonoz P. Proc. Natl. Acad. Sci. U. S. A. 2007;104:10601. doi: 10.1073/pnas.0701096104. [DOI] [PMC free article] [PubMed] [Google Scholar]
- 42.Morgan D, Gordon MN, Tan J, Wilcock D, Rojiani AM. J. Neuropathol. Exp. Neurol. 2005;64:743. doi: 10.1097/01.jnen.0000178444.33972.e0. [DOI] [PubMed] [Google Scholar]
- 43.Akiyama H, Barger S, Barnum S, Bradt B, Bauer J, Cole GM, Cooper NR, Eikelenboom P, Emmerling M, Fiebich BL, Finch CE, Frautschy S, Griffin WS, Hampel H, Hull M, Landreth G, Lue L, Mrak R, Mackenzie IR, McGeer PL, O'Banion MK, Pachter J, Pasinetti G, Plata-Salaman C, Rogers J, Rydel R, Shen Y, Streit W, Strohmeyer R, Tooyoma I, Van Muiswinkel FL, Veerhuis R, Walker D, Webster S, Wegrzyniak B, Wenk G, Wyss-Coray T. Neurobiol. Aging. 2000;21:383. doi: 10.1016/s0197-4580(00)00124-x. [DOI] [PMC free article] [PubMed] [Google Scholar]
Associated Data
This section collects any data citations, data availability statements, or supplementary materials included in this article.


