Abstract
The treatment of osteoporotic patients with teriparatide is associated with a significant increase in bone formation and gain of bone mass. The purpose of this post hoc analysis was to determine if the cross-sectional area (CSA) of the spinal canal and the vertebral body is affected by teriparatide treatment. Narrowing of the spinal canal might represent a safety problem, while widening of the vertebral CSA might improve mechanical stability. High-resolution computed tomography (HRCT) scans of vertebra T12 were obtained at baseline and after 6, 12, and 24 months of teriparatide treatment (20 μg/day) from 44 postmenopausal women with established osteoporosis participating in the prospective, randomized EUROFORS study. The CSA of the spinal canal did not decrease but increased marginally by 0.9% (2.6 mm2) over 24 months (P < 0.001), with a range from −0.5% (−2 mm2) to 3.1% (+8 mm2). Even when analyzing the spinal CSA on a slice-by-slice basis, no clinically relevant narrowing of the spinal canal was observed. For vertebral bodies, the CSA increased by 0.7% (5.7 mm2) over 24 months (P < 0.001), with a range from −0.4% (–3 mm2) to 1.6% (+14 mm2). Our data do not provide evidence for safety concerns regarding spinal canal narrowing. On the other hand, the increases observed for vertebral CSA apparently also only minimally contribute to the mechanical strengthening of the vertebral body under teriparatide treatment.
Keywords: Osteoporosis, Teriparatide, Spinal canal, Parathyroid hormone, Image processing
Introduction
Several studies show that the treatment of osteoporotic patients with teriparatide results in substantial gain of bone mineral density (BMD) in the vertebral bodies [1, 2]. BMD can be measured by quantitative computed tomography (QCT) or dual X-ray absorptiometry (DXA). The increases in BMD, bone fraction, and microstructural variables [3] point to an increase in trabecular and cortical bone thickness. It is not clear if and how much the overall size and shape of a vertebra changes under teriparatide treatment. Rehman et al. [4] reported an increase in the vertebral body cross-sectional area (CSAvb) by analyzing QCT data of postmenopausal women with glucocorticoid-induced osteoporosis treated with hPTH(1–34). However, estimation of only the overall size in one slice of the vertebra (mid-vertebral area) and the lower resolution of QCT images may not be sufficient for more detailed conclusions concerning different regions of the vertebra, like the entire vertebral body or the spinal canal.
Apposition of bone on the cortical surface caused by teriparatide-stimulated remodeling might lead to enhanced growth into the spinal canal in general or at local areas and to compression of the spinal cord. If there is a real increase in CSAvb, one might argue that there might also be the risk of bone apposition at the border of the spinal canal. In patients with a narrow spinal canal this might increase the risk for neural complication. To approach a repeatedly encountered clinical question, i.e., if treatment with teriparatide might bear a risk of spinal canal stenosis, we studied changes in CSA for both vertebral bodies and the spinal canals (CSAsc), using the more sensitive imaging method high-resolution computed tomography (HRCT). This analysis was conducted in postmenopausal women with established osteoporosis who participated in the prospective, randomized European Study of Forsteo (EUROFORS) [5, 6].
Materials and Methods
CSAsc and CSAvb of thoracic vertebra T12 were measured with HRCT at baseline and after different time intervals during therapy. An average CSAsc was used to determine the general change per patient. Local variations were analyzed by comparison of individual CT slices.
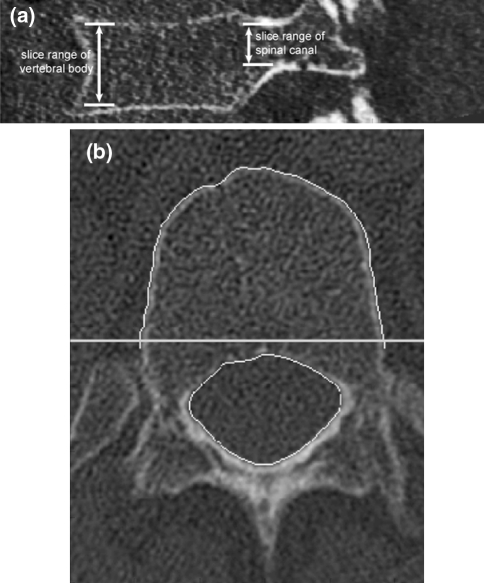
EUROFORS was a pan-European, multicenter, controlled, prospective, randomized open-label clinical trial of postmenopausal women with severe osteoporosis of 2 years’ duration. A subgroup of participants was subjected to HRCT scanning of vertebra T12 at baseline and after 6, 12, and 24 months. The patients differed in their osteoporosis medication history prior to study start; the majority had received extensive pretreatment with antiresorptive medication, which had to be discontinued at study start. Details have been described elsewhere [3]. For quality-assurance (QA) purposes the Mindways QA calibration phantom (Mindways, Austin, TX) was measured on each scanner. Analysis of its central bone-equivalent region permitted cross-calibration of BMD and area data across centers and tracking of stability over time (e.g., impact of equipment change). For the present analysis, only patients treated with teriparatide (20 μg/day) over the complete duration of 2 years were included. An additional prerequisite was a valid baseline scan and at least two valid follow-up scans, including a valid scan at 24 months. For both spinal canal and vertebral body analyses, 44 patients were available. The HRCT examinations of T12 were obtained at 120 kV and 360 mAs using CT scanners from Siemens (Erlangen, Germany) and GE (Milwaukee, WI) (located at seven different centers). The reconstructed slice thickness ranged from 300 to 500 μm, and the size of the in-plane resolution was 156 × 156 μm² or 188 × 188 μm². The entire volume was covered by approximately 30–50 slices for the spinal canals and 40–70 slices for the vertebral bodies (Fig. 1a).
Fig. 1.
Overview of a vertebra. a Coronal view of a vertebral body with ranges of evaluable slices for CSA analysis. b Segmented CSA of the spinal canal and the vertebral body. The posterior border of the vertebral body is defined by an artificial boundary line
As a first step of the analysis, all baseline images of the vertebrae were aligned in the same orientation. The spinal canal was aligned parallel to the z-axis and the symmetry axis of the vertebra, parallel to the x-axis. Next, all follow-up images were registered to their corresponding baseline images. This allowed exact slice-by-slice comparisons. For this purpose an automatic 3D rigid registration method from the ITK Insight Segmentation and Registration Toolkit [7] was used.
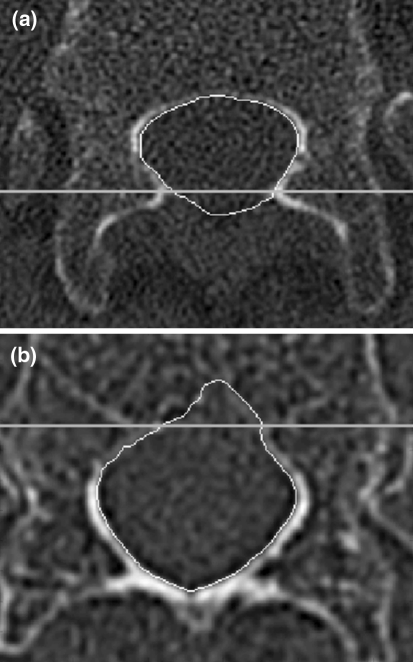
For segmentation of the spinal canal and the vertebral body an active contour or snake model [8, 9] was used. In order to define an initial contour, several preprocessing steps were necessary. The overall shape of the vertebra was found via binarization (by thresholding) of the 3D image and a 3D labeling algorithm. The labeling algorithm was used to find the largest connected component, which was the vertebra. From each 2D slice of the labeled binary image initial contours for the snake algorithm were obtained. The snake algorithm operated on the gradient image derived from the original image. The snake contour is attracted by the local gradient, in this case the gray value gradient between the spinal canal and bone or the gradient between the outer area and the vertebral body. After several steps of calculation, the snake moved to the maximum gradient. Some restrictions had to be defined to achieve a higher accuracy. As shown in Fig. 1b, for vertebral body segmentation a posterior straight border had to be defined since the true posterior border is ill-defined in the region of the spinous processes. For the spinal canal segmentation boundaries were also necessary on those image slices where no closed spinal canal area existed: a posterior border typically in the caudal part of the vertebra (Fig. 2a) and an anterior border where the snake algorithm failed because of holes and porosity in the inner cortical wall, often in the cranial part of the vertebral body (Fig. 2b). Typically, 50 and 30% of the slices of a patient required setting an anterior border or a posterior border, respectively. All parameters, e.g., borderlines, snake elasticity, and threshold, were kept exactly the same for all slices of a given patient. All calculations on the images were performed by the same operator (R. S.).
Fig. 2.
Artificial boundaries for the spinal canal. a Lower boundary, b upper boundary. For a given patient, these lines were positioned consistently across all time points
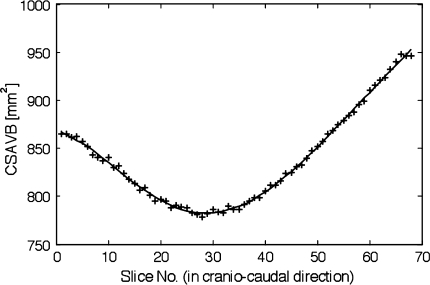
To obtain a measure of the accuracy of the technique, the variability of the measurement process was estimated by fitting a cubic spline through the CSA function plotted against the superposed slices for several scans (Fig. 3). The node points were chosen in such a way that the spline function was sufficiently smooth.
Fig. 3.
Representative example of the CSA of a vertebral body along adjacent slices. The fitted spline function was used to estimate the root mean square error, in this case 2.5 mm²
As a measure of reproducibility of the area measurements, we calculated the long-term precision error for the participants of the study. This parameter was derived from the standard error of the estimate of a linear fit of the longitudinal data of a given patient. It thus represents a worst-case estimate because any nonlinear change will also contribute to the precision error. The long-term precision error of the groups was then derived as a root mean square average of the results of the study participants’ reference [10].
All statistical analyses were performed with JMP 7.0 and 8.0 (SAS Institute, Cary, NC). Exploratory one-sample, two-sided t-tests were conducted to assess the treatment effect.
Results
Of the 44 women (mean age ± SD 68.0 ± 6.7 years) included for this analysis, 37 were pretreated with some form of antiresorptive medication prior to study start. One patient had to be excluded from the spinal canal analysis because of substantial imaging artifacts in the baseline image. Another patient could not be used for area measurements of the vertebral body due to an invalid reconstructed field of view (FOV). Two follow-up scans at 6 and 12 months had to be discarded for CSAvb measurements. The segmentation algorithm failed completely in a few single slices for CSAsc and CSAvb measurements, and thus, these slices could not be included in the final analysis. These failures were clearly recognizable and sorted out manually and automatically (e.g., large deviations of >30% to adjacent slices or corresponding temporal slices). All automatically discarded slices were checked by inspection. For 18 patients, the posterior border had to be set to restrict the variability of the snake algorithm (Fig. 2b).
For the accuracy error of the area measurements, the estimated variability was 3 mm² (1%) for CSAsc and 4 mm² (0.5%) for CSAvb. Assuming a round area, this would correspond to errors in the radius of 0.05 and 0.04 mm, respectively, which is about one-third of the pixel length given here. The long-term precision error amounted to 4.4 mm2 (0.53%) for the area measurement of the vertebral body and 1.2 mm2 (0.41%) for the area measurement of the spinal canal.
For analysis on a patient-by-patient basis, an average area (mm²) was determined for the baseline visit and the follow-up visits for each patient. For each of the follow-up visits the absolute and percentage changes compared to baseline were determined and are listed in Table 1. As early as 12 months after initiation of teriparatide treatment, small but steadily growing increases in CSA were observed for the vertebral bodies and spinal canals (Table 1). There were two patients with baseline CSAs that were considerably larger than those of the other patients (3–3.5 SD above the baseline mean of all other patients), but they showed similar patterns of change over time compared to the other patients (1.2% increase and 0.5% decrease in CSAsc, respectively).
Table 1.
Absolute baseline values, mean differences, and relative increases of the CSA for the 43 patients available for analysis
| CSA | Value at baseline (mm2) | Mean difference (mm²) after | Mean increase (%) after | ||||
|---|---|---|---|---|---|---|---|
| 6 months | 12 months | 24 months | 6 months | 12 months | 24 months | ||
| sc (patient) | 291.4 ± 46.0 | 0.1 ± 1.2* | 1.0 ± 1.5 | 2.6 ± 2.6 | 0.02 ± 0.40* | 0.35 ± 0.49 | 0.91 ± 0.88 |
| vb (patient) | 822.6 ± 154.3 | 1.5 ± 2.5 | 2.9 ± 3.0 | 5.7 ± 4.2 | 0.18 ± 0.30 | 0.35 ± 0.35 | 0.69 ± 0.48 |
All values are given as mean ± SD for the spinal canal (sc) and the vertebral body (vb) areas. All area changes were highly significant (P < 0.0001) except for CSAsc after 6 months
* Not significant compared to baseline
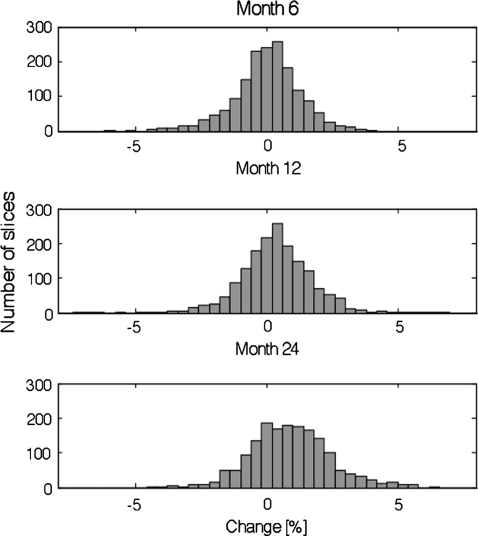
In order to investigate the changes in CSAsc in more detail, we also tried to match individual CT slices and determined the corresponding changes in CSA since baseline. Figure 4 presents histograms of percent changes between baseline and follow-up visits analyzed on a slice-by-slice basis. In total, 1,666 slices for CSAsc and 2,280 slices for CSAvb were evaluated. For a closer inspection of a potential local narrowing of the spinal canal, images corresponding to extreme results of the slice-by-slice analysis were examined. These images, as represented by the extreme values in the left tails of the histogram distributions in Fig. 4, showed an inaccurate segmentation typical for a noise signal rather than a visible apposition of bone. Further, these extreme values were not found in a few specific vertebrae only but were widely spread across many different vertebrae. For example, the four most extreme values with reductions in spinal area of a single slice between −7 and −5% occurred in vertebrae of three different patients with corresponding mean CSA changes of 0.5, 0.5, and 0.2%. Outliers moved back to the normal range at the next time point.
Fig. 4.
Percent changes in CSA of the spinal canal, evaluated on a slice-by-slice basis (1,666 slices from 43 patients) and displayed as histograms
To test whether the increases in CSA would be due to systematic shifts in the magnification of the CT images over time, we compared the CSA of the rigid bone phantom positioned under the patient in reconstructions with a lower resolution. While there was variability across scanners, this could not explain the increases observed for CSAvb and CSAsc. Increases in these two CSAs correlated only weakly, with Pearson R² = 0.28. About 40% of all patients were examined in one center where the scanner was replaced by a new one of the same brand after the 12-month visit. The increase in CSAvb and CSAsc from this center’s 24-month visit was larger than the increase obtained from the remaining centers. Evaluation of the central region of the calibration phantom showed that the new scanner seemed to overestimate the central area by approximately 0.3% compared to the old one. In an analysis restricted to data from all other remaining centers, CSA results of all visits still did not decrease but increased steadily from their baseline result, with significant changes (P < 0.05) observed after month 12. At 24 months the increases measured here were 0.50% for CSAsc and 0.48% for CSAvb compared to 1.51% for CSAsc and 0.93% for CSAvb for the center with the scanner change, leaving the overall effect in the range of +0.5 to +1.5%.
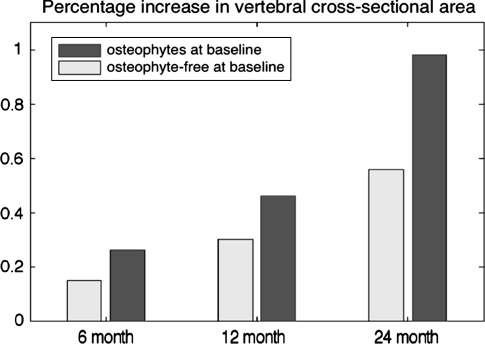
We also tested whether the increase in CSAvb was associated with the baseline status of degenerative changes at the vertebral bodies, specifically the presence of osteophytes on the outer border of the vertebral body. As shown in Fig. 5, patients who already had degenerative changes at baseline (n = 13) showed a significantly larger increase in CSAvb than patients without such degenerative changes at baseline (n = 30) based on t-tests. After 24 months, the increase in CSAvb amounted to 0.98% for the group with degenerative changes at baseline, which was larger (P < 0.01) than the 0.56% increase observed for the group without degenerative changes at baseline.
Fig. 5.
Difference in increases in CSA of the vertebral bodies between group of patients without (n = 30) and with (n = 13) degenerative changes on the outer border of the vertebral bodies at the baseline visit. There was no significant difference between the groups at months 6 and 12. Significant changes were observed at 24 months (P < 0.01)
Discussion and Conclusion
The results presented here demonstrate that 2 years of teriparatide treatment were associated with very small changes of CSA of both the T12 vertebral body as well as the spinal canal. For none of the patients could a tendency be detected that the treatment might cause a narrowing which could result in stenosis of the spinal canal. On the contrary, a small but clinically irrelevant enlargement of the spinal canal was measured after 12 and 24 months, similar to the increase in CSAvb. The average increase was <1% for both areas (<3 and 6 mm2 for CSAsc and CSAvb, respectively). These results are consistent with observations in the manufacturer’s spontaneous adverse event database [11], where after approximately 1 million patient years of exposure to teriparatide, the onset or worsening of symptoms of spinal stenosis has been reported rarely, with most cases also reporting preexisting spine disease. These reports, together with the findings of the present study, seem to suggest that narrowing or stenosis of the spinal canal is a very rare event that is not affected by teriparatide treatment. One should bear in mind that the measured changes are in the range of the estimated accuracy error of the technique of 3 mm² or 1%. A uniform apposition of bone of only one pixel would account for 3–4% of change. Thus, the extreme values of single-slice changes in CSAsc of −7 to –5% for only a handful of slices are all within the likelihood of a measurement error. This assumption is further supported by the observation that these extreme values were spread across several patients and that they moved back to the normal range at the next time point.
An averaging effect of the contour-finding procedure and the evaluation over several slices decreased the variability of results. This enabled us to detect very small changes in the patient-by-patient analysis, where CSAsc changes ranged between −0.5 and 3.1% (−2 and +8 mm2) and CSAvb changes ranged between −0.4 and 1.6% (−3 and +14 mm2).
Still, some questions remain. The fact that a small increase in CSAsc was observed is surprising and documents that teriparatide treatment does not induce bone apposition on all cortical surfaces. Possibly, vertical mechanical stresses might lead to a stretching effect on the vertebrae due to compression of the material. Alternatively, due to its concave shape, the outer border of the spinal canal might also be mechanically considered like an endocortical surface with corresponding resorption in the remodeling process. However, these explanations at this time are rather speculative and demand more detailed investigations. We also considered potential technical reasons for these changes. For example, increases in BMD may affect edge detection. The changes between BMD, vertebral area, and spinal canal area were positively correlated within a given patient. Therefore, one might speculate that the observed increase in vertebral area may in part have been caused by edge-detection effects caused by the increase in BMD during treatment. However, unlike the vertebral body, which is bone tissue surrounded by soft tissue, the spinal canal is a space that is surrounded by bone and, thus, such edge-detection effects would have led to a decrease in the area of the spinal canal. Thus, the consequence would be opposite to what was observed for the spinal canal. BMD changes can thus be disregarded as a potential cause for artificial increases in area of the spinal canal.
The separate analysis of vertebrae with and without degenerative changes on the outer border suggests that the degenerative processes influence the results. Therefore, the true teriparatide-associated increase of the CSAvb would be even smaller than the sub-1% range reported here. Degenerative changes are quite common in this age group, and it would be expected that those patients with higher levels of degenerative changes at baseline would also be more prone to show progression over time. The effects were very small, amounting to only 8 mm2 or 1% of the CSAvb at baseline. Since teriparatide is given for 2 years or less, this should have little relevance clinically. In fact, since there was no untreated control group, we cannot exclude the possibility that there is no teriparatide-induced periosteal apposition at all. On the other hand, this analysis documents that QCT is a sensitive tool to study the temporal development of small degenerative changes at the vertebral body.
To our knowledge, this is the first study on CSAsc measurement to monitor treatment effects. For the CSAvb under treatment with hPTH(1–34) earlier results were presented by Rehman et al. [4]. They observed an increase in vertebral size of 5%, a finding which cannot be confirmed by our results.
Tatarek [12] used the anterior–posterior and the transverse distance of the spinal canal in individual skeletons for determining the variations associated with sex and ancestry and to define cervical narrowing. The assignment of these distances on HRCT images instead of CSA would involve a much higher variability and dependence on the operator (if performed manually).
One advantage of the automatic image-processing methods applied here is the 3D rigid registration of the images. It prevents any impact of the vertebrae’s individual orientations on the measurement variables and allows exact analysis on a slice-by-slice basis. Although the success of the registration could not be quantified, visual inspection of the different images showed perfect matching in most cases. Failed registration could be easily identified and corrected.
Nevertheless, there are shortcomings in this study which provide room for improvements. In the area of image processing the introduction of artificial borderlines for the segmentation was required. They were used for spinal canal segmentation because for two images the resulting difference in CSA measured with a fixed but known line is more reliable than the outcome measured with an ill-defined curve (influenced by noise, lack of distinct local gradient). For the vertebral body, the delineation of the pedicles and the difficulties in segmentation of the inner porous wall necessitated the use of a straight boundary. The influence of this part of the boundary was negligible since for a given patient it was applied consistently across all time points.
Another problem regards the CT scanners. In one center the CT scanner had to be exchanged during the course of the study. Such equipment change might have had an impact on the geometrical changes observed during the study. However, separate analyses carried out for this center and all remaining centers documented the limited effect of this equipment change. Statistical analysis restricted to the remaining centers still yielded the same qualitative results, leaving the overall effect in the range of +0.5 to +1.5%. One might also point out that there was no control group in this study. However, for the following reasons we believe that this is not a critical deficiency for the main outcome, the lack of narrowing of the spinal canal area. First of all, there is no physical reason for changes in the geometry and voxel sizes on CT scanners. In addition, this was controlled by monitoring a solid calibration phantom positioned underneath the patients. No relevant change in magnification could be observed for the CSAs of the calibration rods of this phantom. Moreover, our results would not be likely to be different if they were compared to a control group for the following reason. If a control group would show no change in area or a decrease in area over time, the teriparatide results would hold up or even look more positive. If the control group showed a larger positive change in canal area, we would still be left with a spinal canal area in teriparatide-treated patients that did not decrease. Such a scenario could be explained only by natural age-related increases in spinal canal, which would in part be counteracted by teriparatide treatment. Even in this case the spinal canal area would not be compromised during a treatment that matched the clinically approved therapy scheme employed in the EUROFORS study. The lack of a control may affect some of the secondary findings of the study. Indeed, the small increases in area might be an artifact of the study group. However, as pointed out above, the magnitudes of the changes are so small that they do not carry much clinical relevance anyway.
A more fundamental limitation of our study was the restriction to an analysis of just one vertebra, T12. While we cannot exclude that different CSA changes could be observed for other vertebrae, we do not see a physiological reason for such differences. Moreover, our analysis was limited to the spinal canal, excluding the space between adjacent vertebrae.
In summary, we measured the CSA of the spinal canal and vertebral body T12 of 44 postmenopausal women over 24 months of teriparatide treatment. HRCT data were used for 3D assessment of changes in CSA with submillimeter accuracy. Treatment with teriparatide was associated with a very small, clinically irrelevant increase of CSAsc and CSAvb, the latter potentially partially caused by degenerative changes, in the range of 0.5–1.5%. There was no evidence for an increased risk of spinal canal narrowing associated with 2 years of daily teriparatide treatment.
Acknowledgements
This study was in part funded by a research grant by Lilly Germany.
Open Access
This article is distributed under the terms of the Creative Commons Attribution Noncommercial License which permits any noncommercial use, distribution, and reproduction in any medium, provided the original author(s) and source are credited.
Footnotes
C.-C. Glüer has consultant/advisory role to, and receives funding from Eli Lilly. H. Oertel receives remuneration from, and has stock ownership of Eli Lilly. All other authors have stated that they have no conflict of interest.
References
- 1.McClung MR, San Martin J, Miller PD, Civitelli R, Bandeira F, Omizo M, Donley DW, Dalsky GP, Eriksen EF. Opposite bone remodeling effects of teriparatide and alendronate in increasing bone mass. Arch Intern Med. 2005;165:1762–1768. doi: 10.1001/archinte.165.15.1762. [DOI] [PubMed] [Google Scholar]
- 2.Neer RM, Arnaud CD, Zanchetta JR, Prince R, Gaich GA, Reginster JY, Hodsman AB, Eriksen EF, Ish-Shalom S, Genant HK, Wang O, Mitlak BH. Effect of parathyroid hormone (1–34) on fractures and bone mineral density in postmenopausal women with osteoporosis. N Engl J Med. 2001;344:1434–1441. doi: 10.1056/NEJM200105103441904. [DOI] [PubMed] [Google Scholar]
- 3.Graeff C, Timm W, Nickelsen TN, Farrerons J, Marin F, Barker C, Glüer CC. Monitoring teriparatide-associated changes in vertebral microstructure by high-resolution CT in vivo: results from the EUROFORS study. J Bone Miner Res. 2007;22:1426–1433. doi: 10.1359/jbmr.070603. [DOI] [PubMed] [Google Scholar]
- 4.Rehman Q, Lang TF, Arnaud CD, Modin GW, Lane NE. Daily treatment with parathyroid hormone is associated with an increase in vertebral cross-sectional area in postmenopausal women with glucocorticoid-induced osteoporosis. Osteoporos Int. 2003;14:77–81. doi: 10.1007/s00198-002-1312-0. [DOI] [PubMed] [Google Scholar]
- 5.Obermayer-Pietsch BM, Marin F, McCloskey EV, Hadji P, Farrerons J, Boonen S, Audran M, Barker C, Anastasilakis AD, Fraser WD, Nickelsen T. Effects of two years of daily teriparatide treatment on bone mineral density in postmenopausal women with severe osteoporosis with and without prior antiresorptive treatment. J Bone Miner Res. 2008;23:1591–1600. doi: 10.1359/jbmr.080506. [DOI] [PubMed] [Google Scholar]
- 6.Eastell R, Nickelsen T, Marin F, Barker C, Hadji P, Farrerons J, Audran M, Boonen S, Brixen K, Gomes JM, Obermayer-Pietsch B, Avramidis A, Sigurdsson G, Glüer CC. Sequential treatment of severe postmenopausal osteoporosis after teriparatide: final results of the randomized, controlled European Study of Forsteo (EUROFORS) J Bone Miner Res. 2009;24:726–736. doi: 10.1359/jbmr.081215. [DOI] [PubMed] [Google Scholar]
- 7.ITK Insight Toolkit, http://www.itk.org
- 8.Chenyang X, Prince JL. Snake, shape and gradient vector flow. IEEE Trans Image Processing. 1998;7:359–369. doi: 10.1109/83.661186. [DOI] [PubMed] [Google Scholar]
- 9.Kass A, Witikin A, Terzopoulus D. Snakes: active contour models. Int J Computer Vision. 1988;1:321–332. doi: 10.1007/BF00133570. [DOI] [Google Scholar]
- 10.Glüer CC, Blake G, Lu Y, Blunt BA, Jergas M, Genant HK. Accurate assessment of precision errors: how to measure the reproducibility of bone densitometry techniques. Osteoporos Int. 1995;5:262–270. doi: 10.1007/BF01774016. [DOI] [PubMed] [Google Scholar]
- 11.Eli Lilly and Company Indianapolis Data on file
- 12.Tatarek NE. Variation in the human cervical neural canal. Spine J. 2005;5:623–631. doi: 10.1016/j.spinee.2005.07.009. [DOI] [PubMed] [Google Scholar]


