

Abstract
Pre-flight fuelling rates in free-living red knots Calidris canutus, a specialized long-distance migrating shorebird species, are positively correlated with latitude and negatively with temperature. The single published hypothesis to explain these relationships is the heat load hypothesis that states that in warm climates red knots may overheat during fuelling. To limit endogenous heat production (measurable as basal metabolic rate BMR), birds would minimize the growth of digestive organs at a time they need. This hypothesis makes the implicit assumption that BMR is mainly driven by digestive organ size variation during pre-flight fuelling. To test the validity of this assumption, we fed captive knots with trout pellet food, a diet previously shown to quickly lead to atrophied digestive organs, during a fuelling episode. Birds were exposed to two thermal treatments (6 and 24°C) previously shown to generate different fuelling rates in knots. We made two predictions. First, easily digested trout pellet food rather than hard-shelled prey removes the heat contribution of the gut and would therefore eliminate an ambient temperature effect on fuelling rate. Second, if digestive organs were the main contributors to variations in BMR but did not change in size during fuelling, we would expect no or little change in BMR in birds fed ad libitum with trout pellets. We show that cold-acclimated birds maintained higher body mass and food intake (8 and 51%) than warm-acclimated birds. Air temperature had no effect on fuelling rate, timing of fuelling, timing of peak body mass or BMR. During fuelling, average body mass increased by 32% while average BMR increased by 15% at peak of mass and 26% by the end of the experiment. Our results show that the small digestive organs characteristic of a trout pellet diet did not prevent BMR from increasing during premigratory fuelling. Our results are not consistent with the heat load hypothesis as currently formulated.
Keywords: Basal metabolic rate, Digestive constraint, Cold acclimation, Fat deposition rate, Heat load
Introduction
Long-distance migration in Arctic-breeding shorebirds is a complex seasonal activity where at several consecutive time points specific environmental conditions may have long-term fitness consequences. For example, early arrival on the breeding ground is advantageous to secure the best breeding territories and high quality mates (Drent et al. 2003; Smith and Moore 2005), but birds must also arrive in good body condition and with sufficient nutrient stores to improve survival in case of poor spring weather (Drent and Daan 1980; Møller 1994; Marra et al. 1998; Morrison et al. 2007). Critical decisions must therefore be taken throughout migration, including the time at which to depart from the wintering grounds, the amount of fuel to carry, where and when to stop for refuelling and when to arrive on the breeding grounds (Piersma 1987; Hedenström and Alerstam 1997; Schaub et al. 2008). Ecological circumstances may delimit the options for migrants, slowing down the pace of migration, and have negative fitness consequences (Jacobs and Wingfield 2000; Ramenofsky and Wingfield 2007).
In red knots (Calidris canutus), pre-departure fuelling rates during northward migration are correlated with absolute latitude (distance to the equator), with a slower rate of daily body mass gain in the tropics than in temperate zones (Piersma et al. 2005; Van Gils et al. 2005a; Piersma 2007). This striking latitudinal effect could be explained by two non-exclusive hypotheses involving both endogenous and exogenous factors. The first hypothesis suggests that fuelling rate is simply a function of food availability (Kvist and Lindström 2000; Schaub and Jenni 2001) and quality (Van Gils et al. 2003; Piersma et al. 2005; Van Gils et al. 2005a). As a consequence, birds have to adjust fuelling rate to take advantage of a short, latitude-dependent, time window of high prey density on the wintering and staging areas (Zwarts et al. 1992; Van Gils et al. 2005a). The second, so called “heat load” hypothesis, suggests that fuelling red knots in warm climates may be forced to constrain fuelling rate to avoid overheating problems due to the interaction between high ambient temperatures and the allowable size of the digestive machinery (Battley et al. 2003).
Red knots are mollusc specialists, and because they consume these hard-shelled prey whole, energy intake is physically limited by the size of internal shell processing organs (Piersma 2002a; Van Gils et al. 2003, 2006), and metabolically limited by the energy assimilation rate of the gut (Lindström 1991; Kvist and Lindström 2003). Therefore, to increase fuel storage rates, red knots enlarge digestive organs such as stomach and intestine to process larger amounts of shell fragments (Piersma et al. 1999; Battley and Piersma 2005; Van Gils et al. 2006). Larger internal organs lead to higher endogenous heat production (Piersma et al. 2003), which is reflected in an elevated basal metabolic rate (BMR; the minimum metabolic rate of a normothermic, resting and post-absorptive endotherm; Kersten and Piersma 1987; Daan et al. 1990; McKechnie 2008). Adding to that the heat generated by digestion, an increase in radiative heat gain due to a dark summer plumage and a decreased capacity for heat evacuation due to a higher body mass to volume ratio (Piersma 2002a), the “heat load” hypothesis states that knots in warm climates reduce food intake rate and fuel up on a longer time period with sub-maximal digestive organ size in order to decrease BMR and total heat load (Kersten et al. 1998; Battley et al. 2005). A major assumption of this hypothesis is that BMR variations during fuelling are mainly explained by digestive organ changes and that reducing only digestion-related heat production is enough to avoid overheating. However, migratory fuelling in red knots is also associated with hypertrophy of pectoral muscles and other internal organs such as liver, heart and kidneys (Piersma et al. 1999). These also contribute to heat production as they have been repeatedly shown to influence BMR variations (Daan et al. 1990; Piersma et al. 1996; Weber and Piersma 1996; Vézina et al. 2007; McKechnie 2008). It is therefore unclear whether a reduction in size of digestive organs would be sufficient to significantly lower BMR in fuelling birds facing high ambient temperatures.
Interestingly, knots and other shorebirds maintain interpretable annual body mass and composition cycles in captivity (Weber and Piersma 1996; Piersma 2002b, Vézina et al. 2007, Reneerkens et al. 2007, Piersma et al. 2008), and captive fuelling rate has been reported to vary with temperature under experimental conditions in red knots (Vézina et al. 2007). Indeed, Vézina et al. (2007) observed that knots maintained at 26°C attained their peak body mass 8 days later than birds kept at 5°C and that peak mass in warm-acclimated birds was only 84% of that recorded for their cold-acclimated counterparts. Although measured at relatively moderate temperatures, this pattern goes in the same direction as the latitudinal effect on fuelling rate recorded in natural conditions. This temperature effect on fuelling rate was observed in birds feeding on mudsnails (Hydrobia ulvae), a mollusc requiring considerable work to crush (Piersma et al. 1993; Van Gils et al. 2005b).
Captive knots have been maintained for up to 14 years on a diet of trout food (T. Piersma unpubl. obs.). This high quality, highly digestible diet imposes no digestive constraint and has been repeatedly shown to result in atrophied digestive organs within a few days (e.g. Piersma et al. 1993; Dietz et al. 1999b; Dekinga et al. 2001; Van Gils et al. 2003, Vézina et al. 2010). Therefore, the trout food diet provides the opportunity to experimentally manipulate the size of digestive organs in this species. Here, we examine the effects of two temperature regimes (6 and 24°C) on BMR variations and fuelling rate in captive red knots maintained on a trout food diet. With regard to assumptions underlying the heat load hypothesis we are making two sets of predictions. First, removing the digestive constraint should allow the birds to fuel up at normal rates with atrophied digestive organs (Dietz et al. 1999b; Dekinga et al. 2001), and because this experimental approach eliminates the extra heat produced by enlarged digestive organs, we predict no temperature effect on fuelling rate. Second, the heat load hypothesis implies that BMR variations in fuelling red knots are mainly driven by size variations of digestive organs. Consequently, if the hypothesis is valid, we predict no or little changes in BMR during fuelling in red knots facing no digestive constraints. Alternatively, if BMR variations during fuelling are also driven by size changes in non-digestive organs, we predict an increase in BMR during that period despite the lack of digestive constraint.
Materials and methods
Birds and housing
Twenty-eight adult red knots (subspecies islandica) were captured in the Dutch Wadden Sea on the island of Simonszand (53°31′N; 06°23′E) in September 2006 where they were measured and ringed. They were transferred to outdoor aviaries at the Royal Netherlands Institute for Sea Research (NIOZ) before being moved indoor and kept in four similar cages at room temperature from mid-January until the beginning of our experiment. Cages (4.5 m × 1.5 m × 2.3 m; L × W × H) were equipped with artificial mudflat for the birds to probe and bathe and the remaining floor surfaces were continuously flushed with salt water to avoid health problems. We randomly formed our experimental groups on 31 March and followed them over a 4-month period, from 1 April to 23 July to cover the build-up and the subsequent spontaneous breakdown of stores (Piersma et al. 1995; Vézina et al. 2007). Each group comprised seven individuals of comparable structural size (ANOVA testing for group effect on principal component 1 generated from measurements of wing, bill, total head, tarsus, tarsus plus toe; F 1,26 = 0.76; p = 0.4; Rising and Somers 1989; Senar and Pascual 1997). Birds had ad libitum access to trout pellet food (Trouvit, Mozzecane, Italy, 46% protein, 12% fat, 2% fibres) and fresh water throughout the experiment and were exposed to natural photoperiod for the northern Netherlands with artificial “sunrise” and “sunset” of 20 min.
Thermal treatments
Birds were maintained in four experimental groups (each in a separate cage) and samples for each of the two temperature treatments were formed of two groups per temperature. Just as in the study by Vézina et al. (2007), birds were exposed to a “cold” treatment set at 4°C (average temperature measured in the cage 6.48 ± 0.01°C) or “warm” treatment set at 25°C (average measured temperature 24.26 ± 0.01°C). The cold treatment was therefore 7.1°C lower than natural temperature in the Wadden sea at this time of year (13.57 ± 0.02°C, average air temperature calculated from 1997 to 2007; Royal Netherlands Meteorological Institute) and representative of winter temperature for the region while the warm treatment was 10.7°C higher than the natural outdoor temperature. Such temperature differences are sufficient to generate a metabolic acclimation response in knots (Vézina et al. 2006).
Experimental sequence
We divided the experiment in three time periods representing three distinct physiological stages based on recorded body mass variations (Fig. 1a). The experiment started a month before the beginning of foreseen fuelling to allow birds the time to acclimate to the thermal treatment and reach a stable body mass. Natural average variation in body mass of non-fattening captive red knots maintained under these cold and warm treatments is 3.1 g (from Table 2 in Vézina et al. 2006). We therefore used this value to identify the end of the acclimation time by considering stable masses that varied daily by less than that amount. This time period is therefore called the “acclimated” stage (Fig. 1a) during which all birds had their BMR measured for a first time (see below). Then, birds went through fuelling in what we call the “mass gain” period. Here again, we used the 3.1 g threshold to determine the onset of individual mass gain. We also measured BMR during this period and aimed at recording it at a time as close as possible to the individual peak of body mass (82% of birds were measured within 10 days of their individual highest recorded body mass). Because of logistical constraints, the third experimental period, called the body “mass loss” period was terminated on 23 July when the group average body mass was not yet stable. However, when we measured their BMR for the last time, 78% of the birds had already resumed a stable body mass (data not shown) or a body mass equivalent to their premigratory value (all others were measured at least 13 days after body mass peak).
Fig. 1.
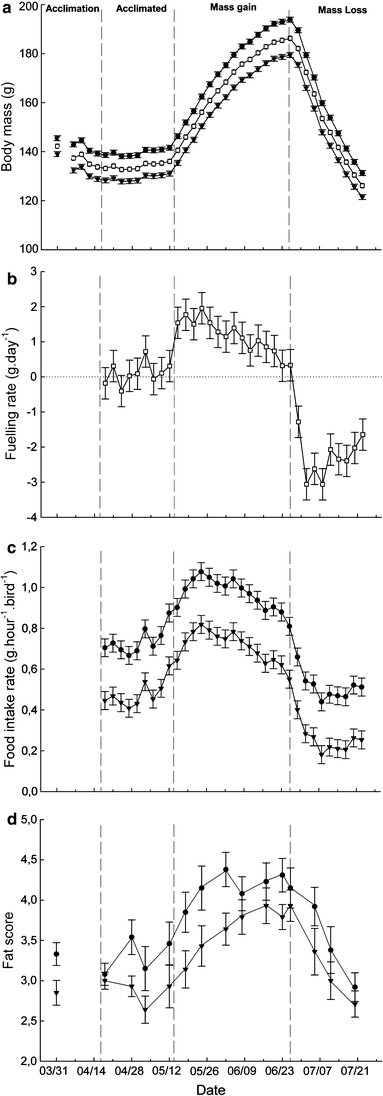
Effect of time on body mass (a), fuelling rate (b), food intake rate (c) and fat score (d). Treatment effect on body mass was marginally non significant (p = 0.08), we therefore show both treatment groups and report the average pooled values that is referred to in the text. Fuelling rate was not affected by thermal treatment (p = 0.9) while food intake rate differed significantly between cold and warm acclimated individuals (p < 0.01). Data on fat score are shown for both treatments as they were separately analyzed non-parametrically. Except for fat score where actual values are reported, data are least square means controlling for the effect of group replicates and individual in a repeated measures ANOVA. See text for details. Cold: black circle; Warm: black triangle; mean: open square
Each day, starting a week after group formation, an amount of food weighed to the nearest 0.1 g was provided to each group of birds at precisely 10:00 h until the next morning where the remaining food was weighed again at 10:00 h to calculate group food intake over 24 h. Daily food intake was then converted to bird−1 h−1 values to obtain individual food intake rate. Birds were weighed to the nearest 0.1 g every 3rd day throughout the experiment and thus we calculated and present a 3-day average food intake rate matching the body mass measurement. Some birds had their BMR measured at the night preceding a weighing day. For those, we used initial BMR mass (see below) in the body mass analyses. Fuelling rate was calculated as the difference between two successive body mass measurements divided by the numbers of days between them. We recorded fat scores according to Busse (2000) for each individual on a weekly basis during a routine health check where birds were inspected and also scored for moult of wing and body feathers. Body feather moult in knots affect heat loss and thermoregulatory requirements (Vézina et al. 2009) and our birds changed their plumage from the winter to summer phenotypes during part of the experiment (data not shown). However, all body moulting activity took place during the acclimation and acclimated stages and was terminated by the time the birds began accumulating body mass. Given our findings regarding BMR (see below), we do not consider moult as a confounding factor in this study.
Respirometry
We measured BMR by open circuit respirometry using the same instruments and according to Vézina et al. (2006, 2007). We simultaneously measured one bird per thermal treatment for each day of BMR recording. Birds were isolated in a holding box at 10:00 h with access to fresh water but no food. At 16:00 h, they were placed in a 6.8 L PVC metabolic chamber to begin recording BMR. During measurements birds were maintained at 25°C (within the thermoneutral zone, Wiersma and Piersma 1994) and received a constant flow of fresh air at 50 L h−1 until 10:00 h the next morning. At this time, they were taken out of the chambers and released in their cage. Birds were weighed (0.1 g) before and after BMR measurements and the average mass is used in the calculations. Instruments were calibrated daily using nitrogen and analysed span gas. Using a 1-min sampling interval, BMR values were calculated with Warthog Systems LABANALYST X (Riverside, CA) and represents the lowest averaged 10 min of O2 consumption per night.
Statistical analyses
One bird did not fuel up during the experiment and was excluded from all analyses. Red knots acclimate to cold by body mass adjustments and cold acclimation has been shown to induce an elevated BMR in this species (Vézina et al. 2006). We therefore first investigated the effect of thermal treatments, independently of the fattening events, by conducting a set of analyses limited to the acclimated period. Then, we analyzed data for the whole experiment. We used repeated-measures ANOVAs in a general linear mixed model approach to analyse thermal treatment effects on body mass, food intake rate, fuelling rate and whole animal BMR. When analysing BMR, we also controlled for body mass by adding bird mass as a covariate in the model (Packard and Boardman 1999). Except for food intake where the variable “bird id” was excluded (because measured at the group level), all analyses included independent variables date (or period for BMR), treatment, group (nested in treatment), bird id (nested in group nested in treatment) as well as the interaction term treatment × date. The interaction term was removed when non-significant. For simplicity, and because we have no biological interest in these specific effects, we do not report statistical results for “bird id” and group. We used post hoc contrast analyses to examine temporal changes in body mass, food intake rate and fuelling rate. Post hoc differences in BMR were analysed with a Tukey test. Timing of body mass gain and mass peak were compared using an ANOVA testing the effect of treatment and group (nested in treatment) on date of the particular event. Data were tested for normality using a one sample Kolmogorov–Smirnov test. Body mass data were log-transformed before analysis and were converted back to values in gram for graphical purposes. Fat score data were analysed non-parametrically using Mann–Whitney and Kruskal–Wallis tests for treatment and time effects, respectively. Statistical analyses were performed with SPSS v.16 and JMP v.8.0. Data are presented as mean ± s.e.m.
Results
Effects of thermal treatments during the acclimated period
There was no significant difference in body mass at group formation between birds in cold (145.5 ± 1.0 g) or warm (139.0 ± 1.0 g) treatments (F 1,2 = 3.2; p = 0.2). The acclimated state, marked by stability in body mass, was attained 18 days after we formed our experimental groups in both temperature treatments (F 1,2 = 0.1; p = 0.8). Repeated-measures ANOVA revealed a clear effect of thermal treatment on body mass (F 1,2 = 179.8; p < 0.01) in acclimated birds, with individuals from the cold treatment being on average 9.9% heavier than individuals kept in the warm treatment (140.9 ± 1.0 g for cold and 128.2 ± 1.0 g for warm; Fig. 1a). The interaction term treatment × time was not significant (F 8,200 = 0.7; p = 0.7) and we found no significant effect of time (F 8,208 = 1.5; p = 0.2) on body mass.
Thermal treatment affected food intake rate (F 1,2 = 27.1; p < 0.05) with birds acclimated to cold eating on average 54% more food than individuals from the warm treatment (0.74 ± 0.01 g bird−1 h−1 for cold and 0.48 ± 0.01 g bird−1 h−1for warm; Fig. 1c). Interestingly, although birds maintained a stable body mass during the acclimated period (Fig. 1a), average food intake rate changed through time (F 8,24 = 8.1; p < 0.0001). Food intake rate started to increase in both group at least 12 days before they began accumulating mass (Fig. 1c, contrast analysis between the first and the last day of acclimated stages: F 1,24 = 32.6; p < 0.0001, with 0.56 ± 0.02 g bird−1 h−1 the first day and 0.75 ± 0.02 g bird−1 h−1 at the end of acclimated stage). The interaction term treatment × time was not significant (F 8,16 = 0.7; p = 0.7).
Fat scores differed slightly between cold and warm acclimated birds at group formation (Mann–Whitney Z = −2.1; p < 0.05) with fat scores of 3.3 ± 0.1 and 2.8 ± 0.2 for cold- and warm-acclimated birds, respectively. During the acclimated period, birds from the cold treatment exhibited significantly larger fat stores than warm acclimated individuals (Mann–Whitney Z = −2.6; p < 0.01; cold: 3.1 ± 0.1; warm: 2.7 ± 0.1).
Thermal treatment did not affect BMR during the acclimated stage (F 1,2 = 2.3; p = 0.3) and adding body mass as a covariate (F 1,21 = 5.0; p < 0.05) did not change this result (F 1,2 = 0.6; p = 0.5).
Overall analysis
We could not detect significant differences between groups in dates marking the beginning of the acclimated period (April 18 for both, F 1,2 = 0.1; p = 0.8) or the onset of mass gain (F 1,2 = 0.39; p = 0.6) and peak of body mass (F 1,2 = 0.01; p = 0.9, Fig. 1a). Repeated-measures ANOVA revealed a highly significant effect of time (F 37,962 = 34.6; p < 0.0001) on body mass variations (Fig. 1a). Despite cold-acclimated birds being on average 7.9% heavier than warm-acclimated individuals throughout the experiment, the analysis showed a marginally non-significant effect of thermal treatment (F 1,2 = 10.4; p = 0.08; Fig. 1a shows both groups separately as well as mean values). The interaction term treatment × time was also not significant (F 37,925 = 0.3; p = 1.0). Average body mass increased by 32.4% in 42 days from the beginning of the mass gain period (140.6 ± 1.0 g) to peak of body mass (186.2 ± 1.0 g, contrast test: F 1,962 = 85.1; p < 0.0001). By the end of the experiment, body mass had declined back to an average value 7.3% lower than that preceding the period of mass gain (126.1 ± 1.0 g, contrast test: F 1,962 = 6.2; p < 0.05).
As for body mass, repeated-measures ANOVA showed no significant effect of treatment or treatment × time interaction (F 1,2 = 0.04; p = 0.9 and F 36,900 = 0.7; p = 0.9, respectively), but a clear effect of time on the fuelling rate (F 36,936 = 10.6; p < 0.0001; Fig. 1b). Indeed, post hoc contrast analysis revealed a rapid change in fuelling rate with birds increasing their average daily body mass gain by fivefold during the 3-day transition between the end of the acclimated period (0.31 ± 0.45 g day−1) and the beginning of mass gain (1.54 ± 0.45 g day−1, contrast test: F 1,936 = 3.8; p = 0.05; Fig. 1b). Fuelling rate declined as birds were approaching peak body mass, from an average of 1.54 ± 0.45 g day−1 at the onset of mass gain to 0.33 ± 0.45 g day−1 at peak of body mass (contrast test: F 1,936 = 3.7; p = 0.06; Fig. 1b). The period of mass loss was characterized by a rapid decline in fuelling rate, from 0.33 ± 0.45 to −3.06 ± 0.45 g day−1 6 days later (contrast test: F 1,936 = 28.8; p < 0.0001; Fig. 1b). Then, although birds were still loosing mass (Fig. 1a), body mass loss slowed down to −1.64 ± 0.45 g day−1 by the end of the experiment (contrast test: F 1,936 = 5.0; p < 0.05; Fig. 1b).
Food intake rate somewhat mirrored changes in body mass (Fig. 1c). Repeated-measures ANOVA revealed significant treatment (F 1,2 = 106.1; p < 0.01) and time (F 35,105 = 21.1; p < 0.0001) effects but no significant interaction treatment × time (F 35,70 = 0.6; p = 0.9). On average, cold acclimated birds consumed 51% more food at all time than birds maintained in the warm treatment (0.77 ± 0.01 g bird−1 h−1 for the cold treatment and 0.51 ± 0.01 g bird−1 h−1 for the warm treatment). Food intake rate increased during mass gain but already started to decline 20 days before the birds attained peak mass (Fig. 1a, c). Not surprisingly, food intake rate plummeted during the period of mass loss (Fig. 1c). However, although average body mass was still falling in both groups, food intake rate stabilized within 12 days to levels below those recorded during the acclimated period (Fig. 1c, comparing the average of the last 12 days of the mass loss period with the average of the 12 first days of the acclimated period, a decrease of 30 and 45% in cold and warm treatments, respectively; F 1,27 = 109.8; p < 0.0001).
Fat scores changed through time within both groups (Kruskall–Wallis cold: X²3 = 48.5; p < 0.0001; n = 196, warm: X²3 = 46.8; p < 0.0001; n = 207) and culminated during the period of mass gain (maximum average scores 4.2 ± 0.1 in cold and 3.7 ± 0.1 in warm; Fig. 1d). However, we found no significant effect of thermal treatment at peak of body mass (Mann–Whitney: Z = −0.8; p = 0.4, cold: 4.5 ± 0.2; warm: 4.4 ± 0.2) and on the last day of the experiment (Mann–Whitney: Z = −0.9; p = 0.4, cold: 2.9 ± 0.2; warm: 2.7 ± 0.2).
As for the overall pattern, average body mass measured at BMR changed throughout the experiment (Fig 2a; F 2,51 = 237.7; p < 0.0001), but was not affected by thermal treatment (F 1,2 = 9.1; p = 0.09) or by the interaction term treatment × time (F 2,49 = 1.1; p = 0.3). Mass at BMR culminated at 188.8 ± 2.3 g during the peak of body mass and was significantly different from mass at BMR during the acclimated period (126.0 ± 2.4 g, Tukey post hoc test: p < 0.001) and at the end of the experiment (129.0 ± 2.3 g, Tukey post hoc test: p < 0.001). Post hoc Tukey test revealed that the latter two did not differ significantly (p = 0.4).
Fig. 2.
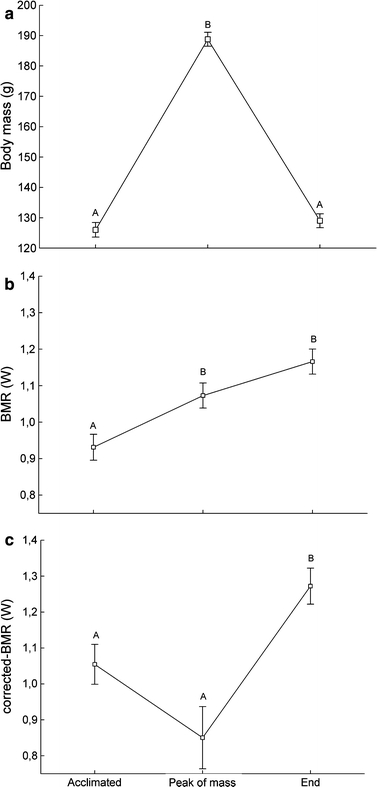
Effect of time on body mass (a), whole (b) and mass-corrected basal metabolic rate (c). Different letters show significant difference between time periods. Body mass effect in c is controlled by adding mass as a covariate in the model. Data are least square means controlling for the effect of group replicates and individual in a repeated measures ANOVA (a, b) and ANCOVA (c)
Basal metabolic rate varied independently of thermal treatment (F 1,2 = 1.6; p = 0.3) and was not affected by the interaction term treatment × time (F 2,49 = 2.1; p = 0.1). However, BMR changed between physiological stages (Fig. 2b; F 2,51 = 11.4; p < 0.0001) with a significant 15% increase from 0.93 ± 0.04 W in the acclimated state to 1.07 ± 0.03 W at peak of body mass (tukey post hoc test: p < 0.01). Interestingly, although there was no significant difference between BMR at peak of mass and at the end of the experiment (Tukey post hoc test: p = 0.06), BMR kept rising during the period of mass loss to an average value of 1.17 ± 0.03 W (25.8% higher than the acclimated stage). Controlling for the confounding effect of body mass (F 1,50 = 7.7; p < 0.01) exposed a different variation pattern (Fig. 2c). Repeated measure ANCOVA revealed a clear effect of time on BMR (F 2,50 = 15.5; p < 0.0001) but no significant treatment effect (F 1,4 = 1.0; p = 0.4) or interaction treatment × time (F 2,48 = 1.5; p = 0.2). Post hoc analysis showed no difference in mass-corrected BMR between the acclimated stage (1.06 ± 0.06 W) and peak of body mass (0.85 ± 0.09 W, Fig. 2c) (Tukey post hoc test: p = 0.13) and a significant increase in BMR by the end of the experiment (1.27 ± 0.05 W) (Tukey post hoc test: p < 0.01).
Discussion
The acclimated period: effects of thermal treatments on physiological acclimation
Our thermal treatments clearly generated physiological acclimation in response to temperature. Treatment effects on food intake and fat score suggest a consistent influence of thermostatic cost on daily energy expenditure (a 54% higher daily energy intake) and storage strategies (12% larger fat stores) in cold-acclimated birds relative to those kept in a warm environment. As observed by Vézina et al. (2006), our birds responded to thermal treatments by modulating body mass, with cold-acclimated birds being on average 9.9% heavier than birds kept in warm conditions. Because pectoral muscle mass tracks body mass in shorebirds (Dietz et al. 1999b, 2007; Lindström et al. 2000), heavier cold-acclimated knots have larger pectoral muscles, which confer better cold endurance (Vézina et al. 2006, 2007). Our findings are therefore consistent with phenotypic changes associated with cold acclimation for the species (Vézina et al. 2006, 2007).
In contrast with previous studies (Gelineo 1964; Vézina et al. 2006; Williams and Tieleman 2000), we did not find a higher BMR in cold-acclimated birds. BMR reflects the total amount of energy used by metabolically active tissue in a resting animal and co-varies with the size of several internal organs (Daan et al. 1990; Piersma et al. 1996; Weber and Piersma 1996). In a cold acclimation context, an increased BMR has been shown to reflect larger digestive organs required to support higher daily food consumption (Williams and Tieleman 2000; Tieleman et al. 2003; Cavieres and Sabat 2008). However, because trout food is highly digestible, knots feeding exclusively on trout pellets are not digestively constrained and typically exhibit atrophied digestive organs within a few days (Piersma et al. 1993; Dietz et al. 1999b; Dekinga et al. 2001; Van Gils et al. 2003, Vézina et al. 2010). Our experimental birds were maintained on a trout food diet for 7 months before group formation. It is therefore reasonable to assume that birds living in the cold could meet their energetic requirements without major changes in digestive organs. This would explain the lack of thermal treatment effect on BMR, an interpretation that is consistent with Swanson’s (2010) suggestion that an elevation of BMR in free-living cold-acclimatized birds is a by-product of the physiological adjustment to cold (i.e. change in digestive physiology). Although we do not have cold endurance data for this group, our findings suggest that a BMR increase is not required for cold acclimatization to take place in red knots.
The fuelling period: testing assumptions of the heat load hypothesis
As predicted, our captive birds followed interpretable seasonal cycles of migration-related body mass change (Piersma et al. 1995; Piersma and Ramenofsky 1998; Piersma et al. 2000; Piersma 2002b) that was independent of their thermal environment. Indeed, fuelling rate, as well as the timing of body mass gain and mass loss, were statistically indistinguishable between cold- and warm-acclimated birds. This finding contrasts with observations of Vézina et al. (2007) of a significant temperature effect, consistent with predictions of the heat load hypothesis, on premigratory mass gain in knots kept at temperatures similar to ours.
Vézina et al. (2007) fed their birds with Hydrobia snails and despite their hardness, a Hydrobia-diet had previously been shown to result in rather small gizzards in captive wintering knots when measured by ultrasonography (Vézina et al. 2006). It is difficult to obtain accurate ultrasound measurements of the smallest gizzards in red knots because they tend to disappear behind air sacks (A. Dekinga pers. comm.). However, dissection data on non-fuelling individuals (Vézina et al. unpublished data) collected for another study showed that cold-acclimated knots fed Hydrobia snails have indeed small gizzards (5.8 ± 0.3 g compared to 8–9 g in free-living wintering knots; Dekinga et al. 2001; Van Gils et al. 2005a), but gizzards that are nevertheless 33% larger than those of birds acclimated to warm conditions (4.4 ± 0.2 g). It appears that under non-migratory conditions, cold ambient temperature in knots fed Hydrobia snails may only requires changes in gizzard size that are under the detection limit of the ultrasonography technique (Dietz et al. 1999a). We suggest that a 33% difference in gizzard size between cold- and warm-acclimated birds at the onset of fuelling could explain the temperature effect on mass gain observed by Vézina et al. (2007). Their cold-acclimated individuals probably had greater shell processing machinery to start with and were thus able to fuel up faster compared to birds in the warm treatment. In other words, a temperature-induced difference in digestive constraint is more likely to explain the pattern observed by Vézina et al. (2007) rather than overheating in warm-acclimated individuals as would be predicted by the heat load hypothesis.
We observed a BMR increase in association with a gain of body mass during fuelling. BMR reached levels 15 and 26% above the acclimated state at peak of body mass and by the end of the experiment, respectively. Given the lack of cold acclimation effect on BMR, this finding is consistent with a BMR mainly driven by non-digestive organ mass variation during fuelling (Weber and Piersma 1996). Further support comes from recent acclimation studies on red knots. Vézina et al. (2006) studied captive red knots fed with hard-shelled Hydrobia and measured BMRs of 1.03 and 0.82 W in birds acclimated to cold and warm ambient temperatures, respectively. In a further study on the same birds (Vézina et al. 2007), they investigated how BMR varied in relation to the migration-related change in body mass. All treatments confounded, the maximal increase in BMR recorded for birds maintained in a cold or warm environment was 0.3 W (see Fig. 4a in Vézina et al. 2007). Considering extreme range values of 0.1 and 0.3 W, and comparing data from both studies, we calculated that birds fed with a natural diet of mudsnails could reach a BMR at peak of body mass comprised between 0.83 W (+12%) and 0.85 W (+37%) for warm-acclimated individuals and between 1.04 W (+10%) and 1.06 W (+29%) for cold-acclimated birds. Although calculated for birds eating hard-shelled prey, these BMR increases are comparable to the ones reported here (15–26% increase in BMR from 0.93 W to 1.07 and 1.17 W) for birds fed with highly digestible trout pellets. Our birds experienced an increase in BMR despite the lack of digestive constraint, an evidence supporting the effect of non-digestive organ machinery on BMR variation.
Also consistent with our findings, Piersma et al. (1995) found individual increases in BMR ranging from 38 to 200% (average 101%) during fuelling in three outdoor-captive red knots that were fed trout food. Although the study is based on a small sample size, it shows that substantial increases in BMR and, thus overall heat production, are possible in fuelling knots while maintaining relatively small digestive organs. Collectively, these results suggest that BMR variations during pre-flight fuelling are not mainly driven by digestive organ size variations as implied by the heat load hypothesis, but rather by the development and use of several internal organs such as heart, liver and kidneys that are not directly involved in digestion (Piersma et al. 1999).
Our data therefore seem to reject the hypothesis that red knots moderate the hypertrophy of digestive organs to avoid overheating during fuelling. However, we can not rule-out the existence of a potential overheating problem in tropical environments. First, during daytime shorebirds cannot easily escape the heat load imposed by direct solar radiation (Wiersma and Piersma 1994; Battley et al. 2003), a variable we could not manipulate in our system. Second, as all lean tissues contribute to BMR and internal heat production, if these birds evolved strategies to reduce the contribution of BMR to total heat load, it would be more profitable for them to restrain the gain of total lean mass rather than only some metabolically active internal organs. This is consistent with the general observation of low body mass and BMR in tropically wintering knots (Kersten et al. 1998; Piersma et al. 1991).
Dilution effect of body fat on BMR
An interesting and perhaps counterintuitive finding was the pattern of change in BMR throughout the sequence of body mass gain and loss (Fig. 2b, c). Whole BMR increased with body mass but remained high during mass loss while mass-corrected BMR was at its lowest at peak of body mass.
The gain of body mass during premigratory fattening is made in large proportion of fat but also contains a significant amount of lean tissue (Lindström and Piersma 1993; Atkinson et al. 2007). Therefore, since fat tissues have low energy consumption (Scott and Evans 1992), BMR is more likely to change with variations in lean mass than total body mass. In the present case, we interpret variations in whole BMR as reflecting changes in total lean mass and variations in mass-corrected BMR as a visible dilution effect of fat stores on the statistical correction for body mass. When generating least-square means, the ANCOVA analysis adjusts individual body mass to the group average value so all birds from all treatments are comparable in terms of body mass (Packard and Boardman 1999). However, the body of fuelling knots contains proportionally more fat as they accumulate nutritional stores for long flights (Dietz et al. 2007; Atkinson et al. 2007), with more than 80% of daily mass gain made of fat after a body mass threshold of 133 g is reached (Atkinson et al. 2007). Thus, for a body mass statistically fixed to the whole experiment average value, birds at peak of mass gain (average body mass at BMR measurement: 188.8 ± 2.3 g) contains proportionally less lean tissue than during the acclimated (average mass at BMR measurement: 126.0 ± 2.4 g) or mass loss (average mass at BMR measurement: 129.0 ± 2.3 g) stages. This, in turn, results in a low mass-independent BMR at peak of body mass as shown in Fig. 2c. Clearly, our birds increased the amount of lean tissue during mass gain (Fig. 2b) and the period of mass loss was mainly the result of fat consumption, as supported by the stability in BMR (Fig. 2b) and the decrease in fat score (Fig. 1d) between peak of body mass and the period of mass loss. As the proportion of lean tissue increased during mass loss, mass-corrected BMR increased with it (Fig. 2c). The higher proportion of body lean tissue at the end of the experiment is further supported by comparable average body masses between the first and last BMR measurement (126.0 and 129.0 g, respectively), but BMR values 26% higher at the end of the experiment. That birds consumed fat during mass loss is consistent with the rapid decline in food intake stabilizing 33 and 49% lower than that required to maintain stable body mass during the acclimated period in cold- and warm-acclimated birds, respectively (Fig. 1c). We suspect that lean tissues would have later fell down to premigratory levels if we had continued the experiment.
Acknowledgments
We are grateful to members of the shorebird group and the Department of Marine Ecology for helpful suggestions and comments during the course of the experiment. We especially thank Maarten Brugge and Anne Dekinga for help with birds and technical support as well as Debbie Buehler for time and advice. Bird handling and experimental protocols were carried out under a permit from the animal experiment committee of the Royal Netherlands Academy of Sciences (KNAW DEC; protocol NIOZ.07.01). This research was supported by a NIOZ operating grant to T.P. and a post-doctoral VENI grant from the Netherlands Organization for Scientific Research (NWO) to F.V.
Open Access
This article is distributed under the terms of the Creative Commons Attribution Noncommercial License which permits any noncommercial use, distribution, and reproduction in any medium, provided the original author(s) and source are credited.
References
- Atkinson PW, Baker AJ, Bennett KA, Clark NA, Clark JA, Cole KB, Dekinga A, Dey A, Gillings S, Gonzalez PM, Kalasz K, Minton CDT, Newton J, Niles LJ, Piersma T, Robinson RA, Sitters HP. Rates of mass gain and energy deposition in red knot on their final spring staging site is both time- and condition-dependent. J Appl Ecol. 2007;44:885–895. doi: 10.1111/j.1365-2664.2007.01308.x. [DOI] [Google Scholar]
- Battley PF, Piersma T. Adaptive interplay between feeding ecology and features of the digestive tract in birds. In: Starck JM, Wang T, editors. Physiological and ecological adaptations to feeding in vertebrates. Enfield: Science Publications; 2005. pp. 201–228. [Google Scholar]
- Battley PF, Rogers DI, Piersma T, Koolhaas A. Behavioural evidence for heat-load problems in great knots in tropical Australia fuelling for long-distance flight. Emu. 2003;103:97–103. doi: 10.1071/MU02017. [DOI] [Google Scholar]
- Battley PF, Rogers DI, van Gils JA, Piersma T, Hassell CJ, Boyle A, Hong-Yan Y. How do red knots Calidris canutus leave Northwest Australia in May and reach the breeding grounds in June? Predictions of stopover times, fuelling rates and prey quality in the Yellow Sea. J Avian Biol. 2005;36:494–500. doi: 10.1111/j.0908-8857.2005.03730.x. [DOI] [Google Scholar]
- Busse P (2000) Bird station manual. SE european bird migration network. University of Gdańsk
- Cavieres G, Sabat P. Geographic variation in the response to thermal acclimation in rufous-collared sparrows: are physiological flexibility and environmental heterogeneity correlated? Funct Ecol. 2008;22:509–515. doi: 10.1111/j.1365-2435.2008.01382.x. [DOI] [Google Scholar]
- Daan S, Masman D, Groenewold A. Avian basal metabolic rates—their association with body-composition and energy-expenditure in nature. Am J Physiol. 1990;259:R333–R340. doi: 10.1152/ajpregu.1990.259.2.R333. [DOI] [PubMed] [Google Scholar]
- Dekinga A, Dietz MW, Koolhaas A, Piersma T. Time course and reversibility of changes in the gizzards of red knots alternately eating hard and soft food. J Exp Biol. 2001;204:2167–2173. doi: 10.1242/jeb.204.12.2167. [DOI] [PubMed] [Google Scholar]
- Dietz MW, Dekinga A, Piersma T, Verhulst S. Estimating organ size in small migrating shorebirds with ultrasonography: an intercalibration exercise. Physiol Biochem Zool. 1999;72:28–37. doi: 10.1086/316648. [DOI] [PubMed] [Google Scholar]
- Dietz MW, Piersma T, Dekinga A. Body-building without power training: endogenously regulated pectoral muscle hypertrophy in confined shorebirds. J Exp Biol. 1999;202:2831–2837. doi: 10.1242/jeb.202.20.2831. [DOI] [PubMed] [Google Scholar]
- Dietz MW, Piersma T, Hedenström A, Brugge M. Intraspecific variation in avian pectoral muscle mass: constraints on maintaining manoeuvrability with increasing body mass. Funct Ecol. 2007;21:317–326. doi: 10.1111/j.1365-2435.2006.01234.x. [DOI] [Google Scholar]
- Drent R, Daan S. The prudent parent: energetic adjustments in avian breeding. Ardea. 1980;68:225–252. [Google Scholar]
- Drent R, Both C, Green M, Madsen J, Piersma T. Pay-offs and penalties of competing migratory schedules. Oikos. 2003;103:274–292. doi: 10.1034/j.1600-0706.2003.12274.x. [DOI] [Google Scholar]
- Gelineo S. Organ systems in adaptation: the temperature regulating system. In: Dill DB, editor. Handbook of physiology, section 4, Adaptation to the environment. Washington, DC: American physiological society; 1964. pp. 259–282. [Google Scholar]
- Hedenström A, Alerstam T. Optimum fuel loads in migratory birds: distinguishing between time and energy minimization. J Theor Biol. 1997;189:227–234. doi: 10.1006/jtbi.1997.0505. [DOI] [PubMed] [Google Scholar]
- Jacobs JD, Wingfield JC. Endocrine control of life-cycle stages: a constraint on response to the environment? Condor. 2000;102:35–51. doi: 10.1650/0010-5422(2000)102[0035:ECOLCS]2.0.CO;2. [DOI] [Google Scholar]
- Kersten M, Piersma T. High levels of energy expenditure in shorebirds; metabolic adaptations to an energetically expensive way of life. Ardea. 1987;75:175–187. [Google Scholar]
- Kersten M, Bruinzeel LW, Wiersma P, Piersma T. Reduced basal metabolic rate of migratory waders wintering in coastal Africa. Ardea. 1998;86:71–80. [Google Scholar]
- Kvist A, Lindström A. Maximum daily energy intake: it takes time to lift the metabolic ceiling. Physiol Biochem Zool. 2000;73:30–36. doi: 10.1086/316719. [DOI] [PubMed] [Google Scholar]
- Kvist A, Lindström A. Gluttony in migratory waders—unprecedented energy assimilation rates in vertebrates. Oikos. 2003;103:397–402. doi: 10.1034/j.1600-0706.2003.12259.x. [DOI] [Google Scholar]
- Lindström Å. Maximum fat deposition rates in migrating birds. Ornis Scand. 1991;22:12–19. doi: 10.2307/3676616. [DOI] [Google Scholar]
- Lindström Å, Piersma T. Mass changes in migrating birds: the evidence for fat and protein storage re-examined. Ibis. 1993;135:70–78. doi: 10.1111/j.1474-919X.1993.tb02811.x. [DOI] [Google Scholar]
- Lindström Å, Kvist A, Piersma T, Dekinga A, Dietz MW. Avian pectoral muscle size rapidly tracks body mass changes during flight, fasting and fuelling. J Exp Biol. 2000;203:913–919. doi: 10.1242/jeb.203.5.913. [DOI] [PubMed] [Google Scholar]
- Marra PP, Hobson KA, Holmes RT. Linking winter and summer events in a migratory bird by using stable-carbon isotopes. Science. 1998;282:1884–1886. doi: 10.1126/science.282.5395.1884. [DOI] [PubMed] [Google Scholar]
- McKechnie AE. Phenotypic flexibility in basal metabolic rate and the changing view of avian physiological diversity: a review. J Comp Physiol B Biochem Syst Environ Physiol. 2008;178:235–247. doi: 10.1007/s00360-007-0218-8. [DOI] [PubMed] [Google Scholar]
- Møller AP. Phenotype-dependent arrival time and its consequences in a migratory bird. Behav Ecol Sociobiol. 1994;35:115–122. doi: 10.1007/BF00171501. [DOI] [Google Scholar]
- Morrison RIG, Davidson NC, Wilson JR. Survival of the fattest: body stores on migration and survival in red knots Calidris canutus islandica. J Avian Biol. 2007;38:479–487. [Google Scholar]
- Packard GC, Boardman TJ. The use of percentages and size-specific indices to normalize physiological data for variation in body size: wasted time, wasted effort? Comp Biochem Physiol A Mol Integr Physiol. 1999;122:37–44. doi: 10.1016/S1095-6433(98)10170-8. [DOI] [Google Scholar]
- Piersma T. Hop, skip or jump? Constraints on migration of arctic waders by feeding, fattening, and flight speed. Limosa. 1987;60:185–194. [Google Scholar]
- Piersma T. Energetic bottlenecks and other design constraints in avian annual cycles. Integr Comp Biol. 2002;42:51–67. doi: 10.1093/icb/42.1.51. [DOI] [PubMed] [Google Scholar]
- Piersma T. When a year takes 18 months: evidence for a strong circannual clock in a shorebird. Naturwissenschaften. 2002;89:278–279. doi: 10.1007/s00114-002-0325-z. [DOI] [PubMed] [Google Scholar]
- Piersma T. Using the power of comparison to explain habitat use and migration strategies of shorebirds worldwide. J Ornithol. 2007;148(1):S45–S59. doi: 10.1007/s10336-007-0240-3. [DOI] [Google Scholar]
- Piersma T, Ramenofsky M. Long-term decreases of corticosterone in captive migrant shorebirds that maintain seasonal mass and moult cycles. J Avian Biol. 1998;29:97–104. doi: 10.2307/3677186. [DOI] [Google Scholar]
- Piersma T, Drent R, Wiersma P (1991) Temperate versus tropical wintering in the world’s northernmost breeder, the knot: metabolic scope and resource levels restrict subspecific options. Acta XX Congr Internat Ornithol, pp 761–772
- Piersma T, Koolhaas A, Dekinga A. Interactions between stomach structure and diet choice in shorebirds. Auk. 1993;110:552–564. [Google Scholar]
- Piersma T, Cadee N, Daan S. Seasonality in basal metabolic-rate and thermal conductance in a long-distance migrant shorebird, the knot (Calidris canutus) J Comp Physiol B Biochem Syst Environ Physiol. 1995;165:37–45. doi: 10.1007/BF00264684. [DOI] [Google Scholar]
- Piersma T, Bruinzeel L, Drent R, Kersten M, VanderMeer J, Wiersma P. Variability in basal metabolic rate of a long-distance migrant shorebird (red knot, Calidris canutus) reflects shifts in organ sizes. Physiol Zool. 1996;69:191–217. [Google Scholar]
- Piersma T, Gudmundsson GA, Lilliendahl K. Rapid changes in the size of different functional organ and muscle groups during refueling in a long-distance migrating shorebird. Physiol Biochem Zool. 1999;72:405–415. doi: 10.1086/316680. [DOI] [PubMed] [Google Scholar]
- Piersma T, Reneerkens J, Ramenofsky M. Baseline corticosterone peaks in shorebirds with maximal energy stores for migration: a general preparatory mechanism for rapid behavioral and metabolic transitions? Gen Comp Endocrinol. 2000;120:118–126. doi: 10.1006/gcen.2000.7543. [DOI] [PubMed] [Google Scholar]
- Piersma T, Dekinga A, van Gils JA, Achterkamp B, Visser GH. Cost-benefit analysis of mollusc eating in a shorebird—I. Foraging and processing costs estimated by the doubly labelled water method. J Exp Biol. 2003;206:3361–3368. doi: 10.1242/jeb.00545. [DOI] [PubMed] [Google Scholar]
- Piersma T, Rogers DI, González PM, Zwarts LJ, do Nascimento I, Minton CDT, Baker AJ. Fuel storage rates before northward flights in red knots worldwide. Facing the severest ecological constraints in tropical intertidal environments? In: Greenberg R, Marra PP, editors. Birds of Two Worlds: Ecology and Evolution of Migration. Baltimore: Johns Hopkins University Press; 2005. pp. 262–273. [Google Scholar]
- Piersma T, Brugge M, Spaans B, Battley PF. Endogenous circannual rhythmicity in body mass, molt, and plumage of great knots (Calidris tenuirostris) Auk. 2008;125:140–148. doi: 10.1525/auk.2008.125.1.140. [DOI] [Google Scholar]
- Ramenofsky M, Wingfield JC. Regulation of migration. Bioscience. 2007;57:135–143. doi: 10.1641/B570208. [DOI] [Google Scholar]
- Reneerkens J, Piersma T, Sinninghe Damste J. Expression of annual cycles in preen wax composition in red knots: constraints on the changing phenotype. J Exp Zool Part A. 2007;307A:127–139. doi: 10.1002/jez.a.347. [DOI] [PubMed] [Google Scholar]
- Rising JD, Somers KM. The measurement of overall body size in birds. Auk. 1989;106:666–674. [Google Scholar]
- Schaub M, Jenni L. Variation of fuelling rates among sites, days and individuals in migrating passerine birds. Funct Ecol. 2001;15:584–594. doi: 10.1046/j.0269-8463.2001.00568.x. [DOI] [Google Scholar]
- Schaub M, Jenni L, Bairlein F. Fuel stores, fuel accumulation, and the decision to depart from a migration stopover site. Behav Ecol. 2008;19:657–666. doi: 10.1093/beheco/arn023. [DOI] [Google Scholar]
- Scott I, Evans PR. The metabolic output of avian (Sturnus vulgaris, Calidris alpina) adipose tissue, liver and skeletal muscle: implications for BMR/body mass relationships. Comp Biochem Physiol A Mol Integr Physiol. 1992;103A:329–332. doi: 10.1016/0300-9629(92)90589-i. [DOI] [PubMed] [Google Scholar]
- Senar JC, Pascual J. Keel and tarsus length may provide a good predictor of avian body size. Ardea. 1997;85:269–274. [Google Scholar]
- Smith RJ, Moore FR. Arrival timing and seasonal reproductive performance in a long-distance migratory landbird. Behav Ecol Sociobiol. 2005;57:231–239. doi: 10.1007/s00265-004-0855-9. [DOI] [Google Scholar]
- Swanson DL (2010) Seasonal metabolic variation in birds: functional and mechanistic correlates. Curr Ornithol (in press)
- Tieleman BI, Williams JB, Buschur ME, Brown CR. Phenotypic variation of larks along an aridity gradient: are desert birds more flexible? Ecology. 2003;84:1800–1815. doi: 10.1890/0012-9658(2003)084[1800:PVOLAA]2.0.CO;2. [DOI] [Google Scholar]
- Van Gils JA, Piersma T, Dekinga A, Dietz MW. Cost-benefit analysis of mollusc-eating in a shorebird II. Optimizing gizzard size in the face of seasonal demands. J Exp Biol. 2003;206:3369–3380. doi: 10.1242/jeb.00546. [DOI] [PubMed] [Google Scholar]
- Van Gils JA, Battley PF, Piersma T, Drent R. Reinterpretation of gizzard sizes of red knots world-wide emphasises overriding importance of prey quality at migratory stopover sites. Proc R Soc B Biol Sci. 2005;272:2609–2618. doi: 10.1098/rspb.2005.3245. [DOI] [PMC free article] [PubMed] [Google Scholar]
- Van Gils JA, De Rooij SR, Van Belle J, Van der Meer J, Dekinga A, Piersma T, Drent R. Digestive bottleneck affects foraging decisions in red knots Calidris canutus. I. Prey choice. J Anim Ecol. 2005;74:105–119. doi: 10.1111/j.1365-2656.2004.00903.x. [DOI] [Google Scholar]
- Van Gils JA, Piersma T, Dekinga A, Battley PF. Modelling phenotypic flexibility: an optimality analysis of gizzard size in red knots Calidris canutus. Ardea. 2006;94:409–420. [Google Scholar]
- Vézina F, Jalvingh KM, Dekinga A, Piersma T. Acclimation to different thermal conditions in a northerly wintering shorebird is driven by body mass-related changes in organ size. J Exp Biol. 2006;209:3141–3154. doi: 10.1242/jeb.02338. [DOI] [PubMed] [Google Scholar]
- Vézina F, Jalvingh KM, Dekinga A, Piersma T. Thermogenic side effects to migratory predisposition in shorebirds. Am J Physiol Regul Integr Comp Physiol. 2007;292:R1287–R1297. doi: 10.1152/ajpregu.00683.2006. [DOI] [PubMed] [Google Scholar]
- Vézina F, Gustowska A, Jalvingh KM, Chastel O, Piersma T. Hormonal correlates and thermoregulatory consequences of molting on metabolic rate in a northerly wintering shorebird. Physiol Biochem Zool. 2009;82:129–142. doi: 10.1086/596512. [DOI] [PubMed] [Google Scholar]
- Vézina F, Dekinga A, Piersma T. Phenotypic compromise in the face of conflicting ecological demands, the case of the red knot Calidris canutus. J Avian Biol. 2010;41:88–93. doi: 10.1111/j.1600-048X.2009.04763.x. [DOI] [Google Scholar]
- Weber TP, Piersma T. Basal metabolic rate and the mass of tissues differing in metabolic scope: migration-related covariation between individual knots Calidris canutus. J Avian Biol. 1996;27:215–224. doi: 10.2307/3677225. [DOI] [Google Scholar]
- Wiersma P, Piersma T. Effects of microhabitat, flocking, climate and migratory goal on energy-expenditure in the annual cycle of red knots. Condor. 1994;96:257–279. doi: 10.2307/1369313. [DOI] [Google Scholar]
- Williams JB, Tieleman BI. Flexibility in basal metabolic rate and evaporative water loss among hoopoe larks exposed to different environmental temperatures. J Exp Biol. 2000;203:3153–3159. doi: 10.1242/jeb.203.20.3153. [DOI] [PubMed] [Google Scholar]
- Zwarts L, Blomert A-M, Wanink JH. Annual and seasonal-variation in the food-supply harvestable by knot Calidris canutus staging in the Wadden sea in late summer. Mar Ecol Prog Ser. 1992;83:129–139. doi: 10.3354/meps083129. [DOI] [Google Scholar]