

Summary
Objective
The hypothesis of this study is that changes in fluid dynamics in subchondral bone bear a functional relationship to bone remodeling and cartilage breakdown in osteoarthritis (OA). We have utilized dynamic contrast-enhanced magnetic resonance imaging (MRI) to extract kinetic parameters of bone perfusion at various stages in the development of OA in the Dunkin-Hartley guinea pig.
Design
of four different ages (6, 9, 12 and 15 months), representing various stages in the development of OA, were studied. All animals underwent dynamic contrast-enhanced (DCE) MRI and perfusion data were analyzed based on the Brix two compartment pharmacokinetic model. Regions of interest were studied at the medial and lateral tibial plateaus and compared to histological/histochemical scores of articular cartilage and subchondral bone plate thickness.
Results
A decrease in perfusion as well as outflow obstruction was observed in animals between 6 and 9 months of age, only in the medial tibial plateau subchondral bone. The eventual cartilage and bone lesions of OA occurred also in the medial tibia. Changes in perfusion occurred in the lateral tibia but not until OA lesions were established. Kinetic parameters of inflow were unchanged in both the medial and lateral plateaus.
Conclusions
Dynamic contrast-enhanced MRI can be used to extract kinetic information on bone perfusion in an animal model of OA. The signal enhancement in subchondral bone temporally precedes and spatially localizes at the same site of the eventual bone and cartilage lesions. Time-intensity curves suggest outflow obstruction as an underlying mechanism.
Keywords: Osteoarthritis, MRI, animal model, subchondral bone, outflow occlusion
Introduction
Despite decades of study, the relationships between subchondral bone pathology and cartilage breakdown in osteoarthritis (OA) are still unclear. Osteocytes are highly responsive to their physicochemical microenvironment and change their cytokine expression profiles in response to pressure, fluid flow, and hypoxia. Therefore, it is particularly topical to understand changes in the physical microenvironment of subchondral bone in OA that may result in altered osteocyte metabolism. This study explores temporal and spatial relationships among perfusion, bone remodeling, and cartilage degradation in OA using the Dunkin-Hartley guinea pig model of spontaneous OA of the knee. The Dunkin-Hartley guinea pig develops OA of the knee that bears histological and biochemical resemblance to human OA with lesions appearing predominantly on the medial side of the joint 1–3. Increased subchondral bone density and cartilage degradation occur in the medial tibial plateau at about 12 months of age and are well established by 15 months of age4.
We have utilized dynamic contrast-enhanced magnetic resonance imaging (MRI) with gadolinium diethylene triamine pentaacetic acid (Gd-DTPA) in the Dunkin-Hartley model to extract kinetic parameters of bone perfusion at several stages in the development of OA. Gd-DTPA-enhanced MRI has been used to measure perfusion in brain, heart, and several neoplasms. In the skeleton, it has been used to measure perfusion in bone tumors and to quantitate inflammatory synovitis5, 6. Gd-DTPA-enhanced MRI has been correlated with 99Tc-labeled nanocolloid scintigraphy uptake in early rheumatoid arthritis of the wrist7. Gd-DTPA enhanced MRI has been validated for bone perfusion in several studies of normal and abnormal bone.8–12 Our study, reported here is, to our knowledge, the first to use dynamic contrast-enhanced MRI with Gd-DTPA prospectively in an animal model of OA and to correlate observations on perfusion patterns with the histopathology of developing OA. This study describes temporal and spatial perfusion patterns in subchondral bone and compares them with developing cartilage and bone lesions of OA.
Methods
Animal Procedures
Dynamic contrast-enhanced MRI of the guinea pig knee joint in the anesthetized animal was performed according to our institutionally approved protocol. In order to study the spectrum of OA, we selected animals of 4 different ages (6, 9, 12, and 15 months) based on the documented timing of OA development 13, 14. For each time point, 6 animals were studied, all acquired from the Charles River Laboratories facility in Raleigh, NC. Birthdates, ages, and weights of all animals were recorded. Central jugular venous catheters were placed by Charles River Laboratories in order to ensure reliable venous access for Gd-DTPA perfusion studies. In preparation for MRI scanning, guinea pigs were anesthetized using 1–3% isoflurane for maintenance.
Following imaging, animals were sacrificed and knees obtained for histochemistry and quantitative measurements of joint morphology. Tibias were decalcified and embedded in paraffin, and 5 μm coronal sections were obtained through the OA lesion or through the middle third of the tibial plateau if no lesions were present. Bones were stained with Safranin-O/Fast Green. Cartilage lesions were scored according to the histological-histochemical method of Mankin 15. Scores range from 0 (denoting no arthritis) to 14 (denoting severe changes). We have used the Mankin score in a previous study of 26 18-month-old animals whose mean score was 11.7 ± 0.2. Intraobserver variability was 6.8%, and interobserver variability was 8.2% 4. The widths of the medial and lateral tibial plateaus were individually measured with a microscopic grid and the subchondral bone plate thickness was measured at the central third of each of the medial and lateral tibial plateaus using Scion/NIH image analysis. In our laboratories from animals of 4 to 12 months of age, an increase in thickness of 18% with increasing age and OA was observed. These measurements are in agreement with previous studies using a variety of assessment techniques, including quantitative histomorphometry, microcomputed tomography, and MRI [14,16,17]. Intraobserver variability was 6.2%, and interobserver variability was 8.8%.
Imaging Procedures
All studies were performed on a 3.0 Tesla GE MRI Scanner. Animals were placed in a custom-designed apparatus, a 7-turn, 3.2-cm-diameter inductively coupled solenoidal coil. Axial and coronal T1-weighted spin echo images were obtained with a 4 cm field of view (FOV), 256 × 256 matrix, 2 mm slice thickness, a 400 ms repetition time (TR), and a 14 ms echo time (TE). A fast spin-echo short T1 inversion-recovery (STIR) series was taken for visualization of bone marrow edema. The slice prescription matched that of the coronal T1-weighted series and used 6650/180/45 ms TR/TI/TE. The dynamic contrast enhanced perfusion sequence was a fast multi-plane spoiled gradient echo sequence (FMPSPGR) with 4–7 slices, a 256 × 128 matrix, a 20 degree flip angle and a 12.1/3.8 ms TR/TE. The time resolution varied from 6.5 to 9.6 seconds/image depending on whether 4 to 7 slices were acquired. These sampling times are consistent with suggested requirements that the Nyquist criterion be fulfilled for times related to the inverse of kpe/ve or 1/kep 18. In all perfusion studies, the central venous line was used to introduce the Gd-DTPA (Bayer Healthcare Pharmaceuticals Inc., Wayne, New Jersey). The contrast agent was injected at a concentration of 0.3 mmol/kg and diluted with normal saline to yield final injection volumes between 1–3 mls, depending upon the weight of the animal. The rate of infusion was 0.5–1 ml/sec, placing the total injection time within a single imaging frame. The perfusion sequence was run with 5 baseline scans prior to contrast injection to examine image quality and placement. Following online reconstruction, data was exported to a Dell 3.4 GHz Pentium 4 PC for analysis using in-house software written to display and analyze the data using IDL 6.0 (ITT Visual, Boulder, CO).
MRI Analysis Methods
Perfusion data was analyzed using previously published in-house software yielding parameters based on the Brix two-compartment pharmacokinetic model 5, 19, 20. The Brix model describes the kinetics of Gd-DTPA exchange between the plasma and interstitial space and is characterized by several rate and volume transfer constants (Figure 1). Regions of interest (ROIs) consisted of the entire medial and lateral tibial plateaus, selected on the T1-weighted series and then automatically overlaid on the perfusion images for analysis of identical voxels. Signal intensities within the ROI were averaged to generate a time intensity curve, which was then fitted to equation 21:
where S0 is the baseline signal intensity prior to contrast injection and S(t) is the signal intensity as a function of time beginning at 0 S and going to conclusion of the scan
Figure 1.
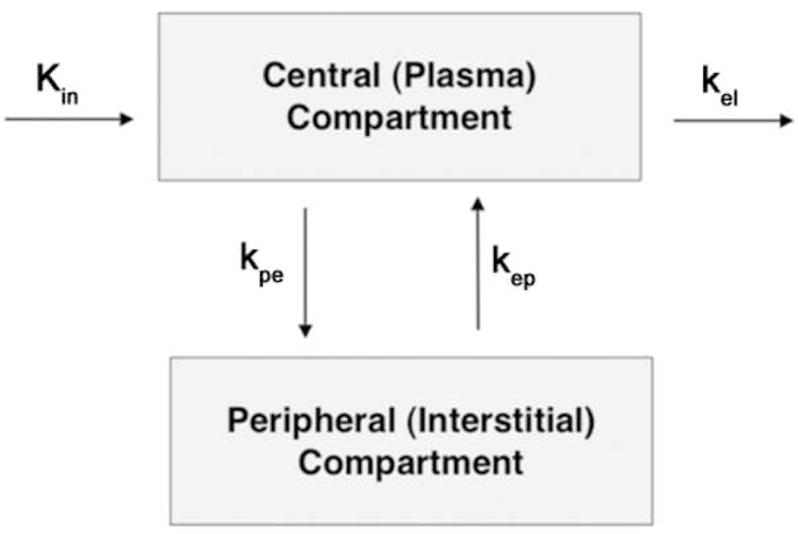
The Brix pharmacokinetic model, in which kel is the elimination rate constant and kep is the rate constant between the extracellular or interstitial compartment. Inflow is characterized by two parameters, the slope and the amplitude.
Three parameters were obtained from the compartmental fit of the time intensity curve within each voxel: amplitude (A), rate constant (kep), and elimination constant (kel). The terms slope and Akep characterize perfusion into the tibial plateau region. The amplitude of the fit, A, is a constant containing information about the relaxivity and dose of the contrast agent, the proton density of the tissue, the T1 relaxation time of the tissue prior to contrast and the extravascular extracellular space (ve). The rate constant between the plasma and tissue compartments, kep, represents a ratio of the permeability surface area product to the size of the extravascular extracellular space (ve). The product of Akep reflects an estimate of the permeability surface area of the vasculature and represents the perfusion into the region of interest. At short times after injection, the equation may be approximated by (1 + Akept) resulting in the initial slope of the uptake being proportional to Akep 21. The elimination or washout of contrast from the ROI is represented by the parameter kel and describes perfusion out of the region, or outflow obstruction. A negative value of kel indicates that the time intensity curve is still enhancing and has not reached a plateau by the end of the scan time (~ 5min). It does not imply a negative physiological clearance rate of the contrast from the system.
The model fits result in an accurate description of the time intensity curves as determined by the Pearson correlation coefficient and allow comparison of curves between different ages of animals. To estimate the reproducibility of the fitting procedure, random noise was added to a representative time intensity curve taken from the medial tibial plateau in a 6 month old animal at levels of 5%, 10%, 15% and 20% and the curve repeatedly fitted 100 times at each noise level. Variations in A and kel were less than 1% and that of kep was less than 3% over the complete range of noise levels in comparison with the initial fit parameters. The addition of random noise at a level of greater than 20% to the time intensity curve was not expected given consistency in acquisition parameters, hardware and placement of ROIs.
Statistical Methods
Results are expressed as mean +/− the standard error of the mean (SEM) and compared for significance with parametric and non-parametric tests as appropriate. Data sets were tested for normality. The Kruskal-Wallis test followed by a two-tailed non-parametric Bonferroni-type correction was used for multiple comparisons between 6 month and older animals. This test is a non-parametric equivalent of a one-way ANOVA analysis and was appropriate to the sample size. If significant, the Mann-Whitney U-test was then used for direct comparison between two specific groups. This non-parametric test was used for sample sizes of less than 20 that were not normally distributed. A two-tailed non-directional p-value was obtained from the test results indicating statistical significance only when p < 0.05.
Results
Morphology
Morphological changes in the Dunkin-Hartley guinea pig in our laboratory are similar to those reported by other investigators and are manifested by increasing histological-histochemical scores reflecting cartilage breakdown and increasing subchondral bone plate thickness reflecting bone remodeling. Bone remodeling occurs predominantly, and earliest, at the medial tibial plateau (Figure 2). Loss of Safranin-O staining and superficial fibrillations are observed in the medial tibia at 9 months of age, with the development of clefts to the subchondral bone by 12 months of age. Loss of articular cartilage in focal lesions can be seen at 15 months of age. Significant changes in histological-histochemical scores are observed between 9 and 12 months of age. The score at 9 months was 3.3 ± 0.33 compared to 8.0 ± 0.48 at 12 months (p<0.001). Significant increases in medial tibial subchondral bone plate thickness are also observed between 9 and 12 months of age. The thickness at 9 months was 205.0 ± 27.66 μm compared to 270.7 ± 7.32 μm at 12 months (p=0.003). Similar OA lesions are observed in other locations in the knee after 12 months of age.
Figure 2.
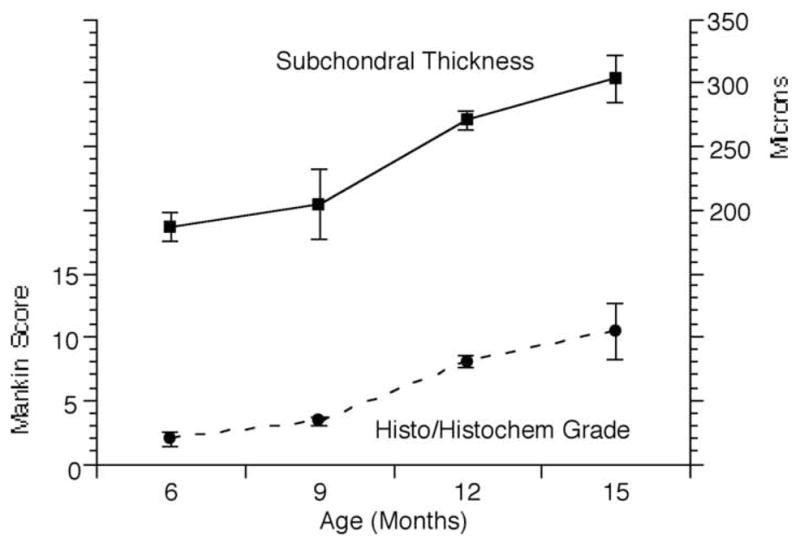
Morphologic changes in guinea pig tibias as a function of increasing age. Cartilage breakdown, reflected in the histological/histochemical score, occurred between 9 – 12 months of age (p < 0.001). The thickness of subchondral bone plate at the medial tibial plateau increased significantly between 9 and 12 months of age (p = 0.003).
Perfusion
Perfusion parameters are extracted from ROIs drawn at the medial and lateral tibial plateaus. Signal intensities from all voxels within the ROIs were averaged to generate a single time intensity curve characteristic of the region. Figure 3A is a representative time intensity curve at the medial tibial plateau in a 6-month-old animal before morphological changes of OA. The first pass of the Gd-DTPA bolus can be seen directly following the 5th baseline point. Signal enhancement is seen to peak at just under 2 minutes and to gradually decrease over time. This indicates moderate washout or elimination of the contrast agent from the tibial plateau. Figure 3B is a representative time intensity curve taken at the medial tibial plateau in a 15-month-old animal. The first pass of the Gd-DTPA bolus enters the tissue at a time similar to that in Figure 3A but continues to enhance without reaching a peak by the end of the 5-minute scan. This suggests an impaired washout or elimination of the contrast agent and suggests obstruction blocking outflow from the region. Figure 4 displays average time-intensity curves of the groups of animals of 6 and 15 months of age fitted to the Brix model showing the close fit of experimental data and predicted values from the model. There are no differences in the inflow parameters, Akep and slope. The outflow parameter, kel, is significantly different between the groups (p = 0.01).
Figure 3.
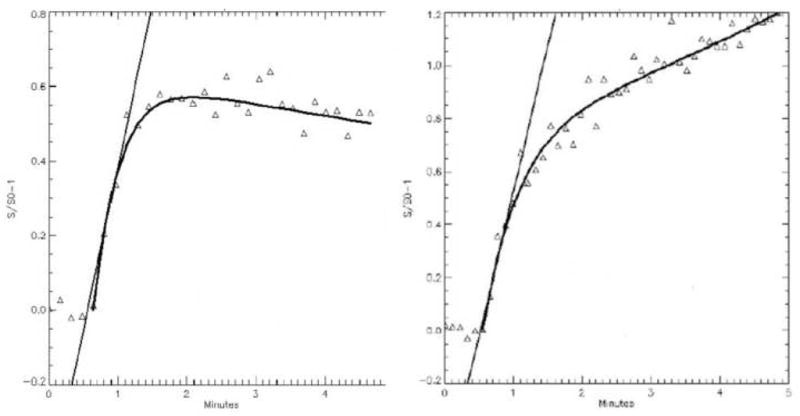
Time intensity curves from the medial tibial plateau. (A.) 6 months of age before morphologic changes of OA reveals normal perfusion with kel = 0.06. (B.) 15 months of age with established changes of OA reveals diminished perfusion with kel = −0.11.
Figure 4.
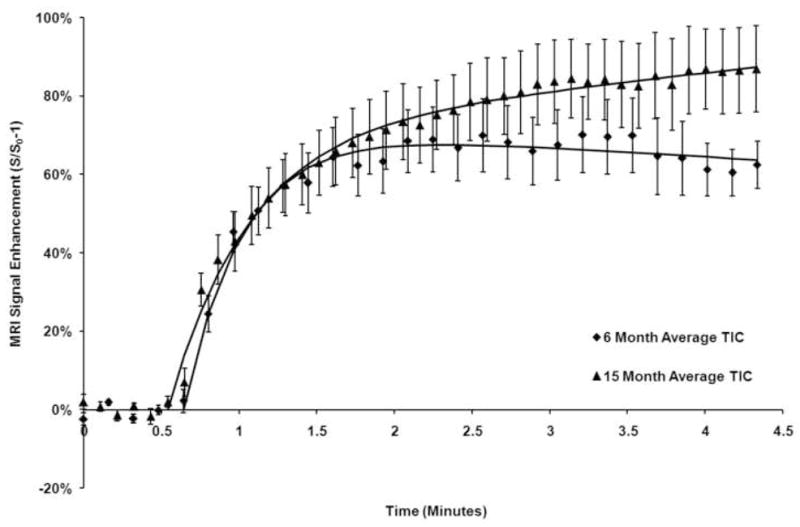
Time intensity curves of the medial tibia in guinea pigs of 6 and 15 months of age were averaged for all animals in the cohort and plotted with the standard error of the mean. Inflow of the contrast material is similar as characterized by similar slope values. At 15 months of age, the outflow phase is characterized by persistent signal enhancement indicating lack of clearance of the contrast agent suggesting venous outflow obstruction and reduced perfusion.
The perfusion data is summarized in Table 1. Inflow parameters (Akep and slope) were not significantly different in either the medial or lateral tibiae and perfusion into both the medial and lateral tibial plateaus remained constant regardless of the age of the animals. The outflow parameter, kel, in both the lateral and medial tibial plateaus declined with age but declined earlier (6–9 months) in the medial side. The kel of the medial tibial plateau decreased from 0.18 ± 0.03 at 6 months of age to 0.01 ± 0.02 at 9 months of age (p = 0.004). The kel in the lateral tibial plateau did not significantly change between 6 and 9 months of age (p = 0.2). When compared to morphological indices of osteoarthritis severity (Figure 2), it can be seen that outflow obstruction in the medial tibia at 6–9 months temporally precedes both cartilage degradation and bone remodeling. These observations illustrate the specificity of the changes in perfusion at 6–9 months in the medial tibia since they both temporally precede and spatially localize in the same medial tibia region as the eventual cartilage and bone lesions of OA. Perfusion declines further, and changes appear on the lateral side at 12 and 15 months, coinciding with the appearance of OA lesions.
Table 1.
Perfusion Parameters in the Tibial Plateaus
| Months of age | ||||
|---|---|---|---|---|
| 6 | 9 | 12 | 15 | |
| Medial Akep | 0.99 ± 0.16 min−1 | 1.89 ± 0.44 min−1 | 1.54 ±0.21 min−1 | 1.37 ± 0.35 min−1 |
| Medial Slope | 91.7 ±12.6 %/min | 135.3 ± 27.7 %/min | 110.1 ± 7.0 %/min | 96.2 ± 15.3 %/min |
| Medial kel | 0.18 ± 0.03 min−1 | 0.01 ± 0.02 min−1 | 0.04 ± 0.03 min−1 | −0.03 ± 0.03 min−1 |
| Lateral Akep | 1.27 ± 0.09 min−1 | 2.93 ± 0.57 min−1 | 1.84 ± 0.31 min−1 | 2.11 ± 0.54 min−1 |
| Lateral Slope | 113.5 ± 18.2 %/min | 152.1 ± 23.4 %/min | 122.7 ± 10.4 %/min | 132.4 ± 23.4 %/min |
| Lateral kel | 0.13 ± 0.04 min−1 | 0.05 ± 0.04 min−1 | 0.01 ± 0.01 min−1 | 0.01 ± 0.02 min−1 |
No significant changes were observed in the inflow parameters, Akep and slope, in either the medial or lateral tibial plateaus.
The outflow parameter, kel, declined significantly on the medial side at 6 v.9 months (P=0.004); 6 v.12 months (P=0.002); and 6 v.15 months (P<0.001). The kel on the lateral side was unchanged at 6 v.9 months (P=0.2) and declined at 6 v.12 months (P=0.006) and 6 v.15 months (P=0.006).
Discussion
A relationship between bone remodeling and cartilage degeneration in OA has been recognized for many years but the role of subchondral bone in the pathophysiology of OA remains elusive. Studies have focused on remodeling in the subchondral bone that is observable by plain x-ray, e.g., sclerosis, trabecular remodeling and osteophytes. However, the role of the osteocytes in subchondral bone remodeling, and the pathophysiological relationship of bone remodeling to cartilage degeneration in OA, continue to be incompletely understood 22–27. We have utilized the Dunkin-Hartley guinea pig model of spontaneous OA because longitudinal studies of bone remodeling in this model reveal changes in subchondral bone that resemble those in human OA. Three studies using different techniques, demonstrate bone remodeling coincident with early cartilage degeneration 14, 16, 17.
The hypothesis underlying this study is that dynamic contrast MRI can be used to detect changes in perfusion patterns in subchondral bone that bear a functional relationship to bone remodeling and cartilage degeneration. Signal enhancement in dynamic contrast-enhanced MRI is achieved with the use of paramagnetic contrast medium such as Gd-DTPA, which cause local magnetic field fluctuations and reduce the relaxation times, T1 and T2, of enhancing tissues. The change in signal enhancement over time (signal intensity-time curves) can be used to extract quantitative information concerning fluid kinetics using pharmacokinetic models. Several models, including that of Brix, have been reviewed recently 21. They are all based on several assumptions that have been validated in many clinical studies of tumors, rheumatoid synovitis, and myocardial and bone perfusion 5, 6, 8–12, 28–30. Signal enhancement can be linearly related to the concentration of the contrast medium in both blood and tissue, and blood flow can be estimated from the transit time of the contrast medium 5, 6, 21. Because signal enhancement is proportional to the perfusion of contrast medium and to blood flow, changes in tissue perfusion can be inferred from the time-intensity curves, especially the enhancement decay slope of the outflow phase characterized by kel. Prolonged signal enhancement in the outflow phase has been associated with venous outflow obstruction, stasis, and decreased perfusion 38. We have measured signal enhancement and decreased perfusion appearing earliest in medial tibial bone in guinea pigs between 6–9 months of age, temporally preceding and spatially co-localizing with the sites of eventual cartilage and bone lesions of OA.
Gd-MRI is a well established method of assessing perfusion 5–12. It has been correlated with technetium and with radioisotopes including 15O and 18F. Further, Gd enhanced MRI has been validated by comparison with radioactive microspheres 32.
Several pharmacokinetic models have been proposed to extract kinetic information on perfusion and have been reviewed in several papers by Tofts 21,33. All models involve physiological assumptions and we do conclude below that these need to be validated by direct measurements. The Brix model used by us, has been validated in clinical and preclinical studies 5, 19, 20. It is beyond the scope of this paper to validate the model further. Our interpretation of the Brix model is consistent with many other observations proposing a vascular component of OA 34–38. These studies focused on venous outflow obstruction as a key pathological observation. Our time intensity curves show clear and significant differences in the outflow phase of contrast administration independent of the model chosen to describe them.
Other causes of signal enhancement have been considered. The observation of signal enhancement by Gd in OA bone is plotted as time intensity curves as a function of animal age and the development of age-related OA. Inflow parameters (“slope” and “amplitude”) are unchanged indicating that the delivery of Gd to bone remains constant. The outflow parameter, kel, is significantly changed as evidenced by the difference in the slope of the outflow or washout phase on the time intensity curves. Table 1 presents data showing that inflow parameters are unchanged in animals of various ages and stages of OA so that an enhanced delivery of Gd does not seem to be occurring.
The intraosseous extravascular extracellular compartment is complex and is comprised of several tissues prominently fat, hematopoietic marrow, and bone. Gd does not have access to all of those compartments. The volume of the extravascular compartment to which Gd has access, “Ve”, can be estimated from the Tofts model. A single arterial input function was acquired from the popliteal artery and a fixed value of Vp was used for all animals. The relaxation time (T10) prior to contrast administration of the tibial plateau was fixed at 1.35 seconds which remains consistent with other measures. Using this model, the Ve does not change between six and nine months at either the medial or lateral tibial plateau. This is the time period in which we observe the major decrease in flow on the medial side so the Ve does not appear to be playing a predominant role in the observed changes in flow. The Ve does rise similarly in both the medial and lateral sides at 12 and 15 months, as do other indices of developing OA including subchondral bone thickness, histochemical scores of cartilage, and outflow obstruction in both the medial and lateral tibia. Thus at the time period of interest, we observed kel changes in the absence of changes in the extravascular extracellular space, supporting our interpretation that the kel changes reflect outflow obstruction, stasis, and decreased perfusion.
We have also examined changes in capillary permeability which might explain movement of Gd from the intravascular to the extravascular space. We have used the Tofts model to estimate the capillary permeability surface area (Ktrans). These data indicate that transvascular movement of Gd into the extravascular intraosseous compartment is not preferentially occurring in pathologic bone and that signal enhancement is independent of this mechanism.
Our studies demonstrate that dynamic contrast-enhanced MRI with Gd-DTPA can be used to extract kinetic information on bone perfusion in OA. We have characterized the signal enhancement in subchondral bone and have demonstrated that it temporally precedes and spatially localizes at the same site of eventual bone and cartilage lesions in the experimental model of spontaneous OA in the Dunkin-Hartley guinea pig. Since signal enhancement is proportional to the concentration of Gd, it may be possible to extract information on blood flow, intraosseous pressure, and pO2 that appears to be consistent with the values observed in human OA. The physiological implications of changes in perfusion may be related to alterations in the physicochemical environment in bone, particularly fluid flow, pressure and oxygen tension. Osteocytes respond to these changes in fluid dynamics in their microenvironment by altering their patterns of gene expression 39–42. The changes in perfusion we have observed may be part of a physicochemical signaling mechanism to osteocytes and may constitute a functional relationship to bone remodeling and cartilage breakdown in OA. However, the complexity of osseous circulatory physiology and tissue permeability requires that these estimations be subject to experimental validation.
Acknowledgments
Funding for the study was provided by NIH AR 02128 and OREF Resident Research Award 6-41285.
References
- 1.Bendele AM, White SL, Hulman JF. Osteoarthritis in guinea pigs: Histopathologic and scanning electron microscopic features. Laboratory Animal Science. 1989;39:115–121. [PubMed] [Google Scholar]
- 2.Jimenez PA, Glasson SS, Trubetskoy OV, Haimes HB. Spontaneous osteoarthritis in Dunkin Hartley guinea pigs: histologic, radiologic, and biochemical changes. Laboratory Animal Science. 1997;47(6):598–601. [PubMed] [Google Scholar]
- 3.Wei L, Svensson O, Hjerpe A. Correlation of morphologic and biochemical changes in the natural history of spontaneous osteoarthrosis in guinea pigs. Arthritis and Rheumatism. 1997;40(11):2075–2083. doi: 10.1002/art.1780401121. [DOI] [PubMed] [Google Scholar]
- 4.Ciombor DM, Aaron RK, Wang S, Simpson BJ. Modification of osteoarthritis by pulsed electromagnetic field - A morphological study. Osteoarthritis and Cartilage. 2003;11(6):455–462. doi: 10.1016/s1063-4584(03)00083-9. [DOI] [PubMed] [Google Scholar]
- 5.Hoffmann U, Brix G, Knopp MV, Hess T, Lorenz WJ. Pharmacokinetic mapping of the breast: a new method for dynamic MR mammography. Magn Reson Med. 1995;33(4):506–14. doi: 10.1002/mrm.1910330408. [DOI] [PubMed] [Google Scholar]
- 6.Workie DW, Dardzinski B, Graham T, Laor T, Bommer W, O’Brien K. Quantification of dynamic contrast-enhanced MR imaging of the knee in children with juvenile rheumatoid arthritis based on pharmacokinetic modeling. Magn Reson Imaging. 2004;22(9):1201–10. doi: 10.1016/j.mri.2004.09.006. [DOI] [PubMed] [Google Scholar]
- 7.Palosaari K, Vuotila J, Takalo R, Jartti A, Niemelä R, Haapea M, et al. Contrast-enhanced dynamic and static MRI correlates with quantitative 99Tcm-labelled nanocolloid scintigraphy. Study of early rheumatoid arthritis patients. Rheumatology (Oxford) 2004;43(11):1364–73. doi: 10.1093/rheumatology/keh302. [DOI] [PubMed] [Google Scholar]
- 8.Hawighorst H, Libicher M, Knopp M, Moehler T, Kauffmann GW, van Kaick G. Evaluation of angiogenesis and perfusion of bone marrow lesions: Role of semiquantitative and quantitative dynamic MRI. J Magn Reson Imaging. 1999;10:286–294. doi: 10.1002/(sici)1522-2586(199909)10:3<286::aid-jmri9>3.0.co;2-n. [DOI] [PubMed] [Google Scholar]
- 9.Moehler TM, Hawighorst H, Neben K, Egerer G, Hillengass J, Max R, et al. Bone marrow microcirculation analysis in multiple myeloma by contrast-enhanced dynamic magnetic resonance imaging. Int J Cancer. 2001;93:862–868. doi: 10.1002/ijc.1421. [DOI] [PubMed] [Google Scholar]
- 10.Baur A, Stäbler A, Bartl R, Lamerz R, Scheidler J, Reiser M. MRI gadolinium enhancement of bone marrow: Age-related changes in normals and in diffuse neoplastic infiltration. Skeletal Radiol. 1997;26:414–418. doi: 10.1007/s002560050257. [DOI] [PubMed] [Google Scholar]
- 11.Cova M, Yang YS, Tsukamoto H, Jones LC, McVeigh E, Neff BL, et al. Bone marrow perfusion evaluated with gadolinium-enhanced dynamic fast MR imaging in a dog model. Radiology. 1991;179:535–539. doi: 10.1148/radiology.179.2.2014306. [DOI] [PubMed] [Google Scholar]
- 12.Bluemke DA, Petri M, Zerhouni EA. Femoral head perfusion and composition: MR imaging and spectroscopic evaluation of patients with systemic lupus erythematosus and at risk for avascular necrosis. Radiology. 1995;197:433–438. doi: 10.1148/radiology.197.2.7480688. [DOI] [PubMed] [Google Scholar]
- 13.Bendele AM, Hulman JF. Spontaneous cartilage degeneration in guinea pigs. Arthritis and Rheumatism. 1988;31:561–565. doi: 10.1002/art.1780310416. [DOI] [PubMed] [Google Scholar]
- 14.Watson PJ, Hall LD, Malcolm A, Taylor JA. Degenerative joint disease in the guinea pig. Use of magnetic resonance imaging to monitor progression of bone pathology. Arthritis Rheum. 1996;39(8):1327–37. doi: 10.1002/art.1780390810. [DOI] [PubMed] [Google Scholar]
- 15.Mankin HJ, Dorfman H, Lippiello L, Zarins A. Biochemical and metabolic abnormalities in articular cartilage from osteoarthritic human hips. Journal of Bone and Joint Surgery. 1972;53(3):523–537. [PubMed] [Google Scholar]
- 16.Dedrick DK, Goulet R, Huston L, Goldstein SA, Bole GG. Early bone changes in experimental osteoarthritis using microscopic computed tomography. J Rheumatol Suppl. 1991;27:44–5. [PubMed] [Google Scholar]
- 17.Pastoureau P, Leduc S, Chomel A, DeCeuninck F. Quantitative assessment of articular cartilage and subchondral bone histology in the meniscectomized guinea pig model of osteoarthritis. Osteoarthritis Cartilage. 2003;11(6):412–23. doi: 10.1016/s1063-4584(03)00050-5. [DOI] [PubMed] [Google Scholar]
- 18.Lopata RGP, Backes W, van den Bosch P, van Riel N. On the Identifiability of Pharmacokinetic Parameters in Dynamic Contrast-Enhanced Imaging. Magn Reson Med. 2007;58:425–429. doi: 10.1002/mrm.21336. [DOI] [PubMed] [Google Scholar]
- 19.Brix G, Semmler W, Port R, Schad LR, Layer G, Lorenz WJ. Pharmacokinetic parameters in CNS Gd-DTPA enhanced MR imaging. J Comput Assist Tomogr. 1991;15(4):621–8. doi: 10.1097/00004728-199107000-00018. [DOI] [PubMed] [Google Scholar]
- 20.Dyke JP, Panicek DM, Healey JH, Meyers PA, Huvos AG, Schwartz LH, et al. Osteogenic and Ewing sarcomas: estimation of necrotic fraction during induction chemotherapy with dynamic contrast-enhanced MR imaging. Radiology. 2003;228(1):271–8. doi: 10.1148/radiol.2281011651. [DOI] [PubMed] [Google Scholar]
- 21.Tofts PS. Modeling tracer kinetics in dynamic Gd-DTPA MR imaging. J Magn Reson Imaging. 1997;7(1):91–101. doi: 10.1002/jmri.1880070113. [DOI] [PubMed] [Google Scholar]
- 22.Bailey AJ, Mansell JP. Do subchondral bone changes exacerbate or precede articular cartilage destruction in osteoarthritis of the elderly? Gerontology. 1997;43(5):296–304. doi: 10.1159/000213866. [DOI] [PubMed] [Google Scholar]
- 23.Radin EL, Paul IL, Rose RM. Role of mechanical factors in pathogenesis of primary osteoarthritis. Lancet. 1972;1(7749):519–22. doi: 10.1016/s0140-6736(72)90179-1. [DOI] [PubMed] [Google Scholar]
- 24.Radin EL, Rose RM. Role of subchondral bone in the initiation and progression of cartilage damage. Clin Orthop Relat Res. 1986;213:34–40. [PubMed] [Google Scholar]
- 25.Radin ER, Paul IL, Rose RM. Pathogenesis of primary osteoarthritis. Lancet. 1972;1(7765):1395–6. doi: 10.1016/s0140-6736(72)91130-0. [DOI] [PubMed] [Google Scholar]
- 26.Shimizu M, Tsuji H, Matsui H, Katoh Y, Sano A. Morphometric analysis of subchondral bone of the tibial condyle in osteoarthrosis. Clin Orthop Relat Res. 1993;293:229–39. [PubMed] [Google Scholar]
- 27.Yamada K, Healey R, Amiel D, Lotz M, Coutts R. Subchondral bone of the human knee joint in aging and osteoarthritis. Osteoarthritis Cartilage. 2002;10(5):360–9. doi: 10.1053/joca.2002.0525. [DOI] [PubMed] [Google Scholar]
- 28.Diesbourg LD, Prato FS, Wisenberg G, Drost DJ, Marshall TP, Carroll SE, et al. Quantification of myocardial blood flow and extracellular volumes using a bolus injection of Gd-DTPA: kinetic modeling in canine ischemic disease. Magn Reson Med. 1992;23(2):239–53. doi: 10.1002/mrm.1910230205. [DOI] [PubMed] [Google Scholar]
- 29.Fritz-Hansen T, Rostrup E, Søndergaard L, Ring P, Amtorp O, Larsson H. Capillary transfer constant of Gd-DTPA in the myocardium at rest and during vasodilation assessed by MRI. Magn Reson Med. 1998;40(6):922–9. doi: 10.1002/mrm.1910400619. [DOI] [PubMed] [Google Scholar]
- 30.Larsson HB, Fritz-Hansen T, Rostrup E, Søndergaard L, Ring P, Henriksen O. Myocardial perfusion modeling using MRI. Magn Reson Med. 1996;35(5):716–26. doi: 10.1002/mrm.1910350513. [DOI] [PubMed] [Google Scholar]
- 31.Schneider T, Drescher W, Becker C, Sangill R, Stødkilde-Jørgensen H, Heydthausen M, et al. Dynamic gadolinium-enhanced MRI evaluation of porcine femoral head ischemia and reperfusion. Skeletal Radiol. 2003;32:59–65. doi: 10.1007/s00256-002-0592-y. [DOI] [PubMed] [Google Scholar]
- 32.Tsukamoto H, Kang YS, Jones LC, Cova M, Herold CJ, McVeigh E, et al. Evaluation of Marrow Perfusion in the femoral head by dynamic magnetic resonance imaging. Invest Radiol. 1992;27(4):275–281. doi: 10.1097/00004424-199204000-00002. [DOI] [PMC free article] [PubMed] [Google Scholar]
- 33.Tofts P, Brix G, Buckley D, Evelhoch J, Henderson E, Knopp M, et al. Estimating kinetic parameters from dynamic contrast0enghanced T1-Weighted MRI of a diffusible tracer: Standardized quantities and symbols. J Magn Reson Imaging. 1999;10(3):223–32. doi: 10.1002/(sici)1522-2586(199909)10:3<223::aid-jmri2>3.0.co;2-s. [DOI] [PubMed] [Google Scholar]
- 34.Arnoldi CC. Vascular aspects of degenerative joint disorders. A synthesis. Acta Orthop Scand Suppl. 1994;261:1–82. [PubMed] [Google Scholar]
- 35.Arnoldi CC, Linderholm H, Mussbichler H. Venous engorgement and intraosseous hypertension in osteoarthritis of the hip. J Bone Joint Surg Br. 1972;54(3):409–21. [PubMed] [Google Scholar]
- 36.Kiaer T, Pedersen NW, Kristensen KD, Starklint H. Intra-osseous pressure and oxygen tension in avascular necrosis and osteoarthritis of the hip. Journal of Bone and Joint Surgery. 1990;72B:1023–1030. doi: 10.1302/0301-620X.72B6.2246284. [DOI] [PubMed] [Google Scholar]
- 37.Kiaer T, Gronlund J, Sorensen KH. Subchondral pO2, pCO2, pressure, pH, and lactate in human osteoarthritis of the hip. Clin Orthop Relat Res. 1988;229:149–55. [PubMed] [Google Scholar]
- 38.Pedersen NW, Kiaer T, Kristensen KD, Starklint H. Intraosseous pressure, oxygenation, and histology in arthrosis and osteonecrosis of the hip. Acta Orthop Scand. 1989;60(4):415–7. doi: 10.3109/17453678909149309. [DOI] [PubMed] [Google Scholar]
- 39.Dodd JS, Raleigh JA, Gross TS. Osteocyte hypoxia: a novel mechanotransduction pathway. Am J Physiol. 1999;277(3 Pt 1):C598–602. doi: 10.1152/ajpcell.1999.277.3.C598. [DOI] [PubMed] [Google Scholar]
- 40.McAllister TN, Frangos JA. Steady and transient fluid shear stress stimulate NO release in osteoblasts through distinct biochemical pathways. J Bone Miner Res. 1999;14(6):930–6. doi: 10.1359/jbmr.1999.14.6.930. [DOI] [PubMed] [Google Scholar]
- 41.Steinbrech DS, Mehrara BJ, Saadeh PB, Greenwald JA, Spector JA, Gittes GK. Hypoxia increases insulinlike growth factor gene expression in rat osteoblasts. Ann Plast Surg. 2000;44(5):529–34. doi: 10.1097/00000637-200044050-00012. discussion 534–5. [DOI] [PubMed] [Google Scholar]
- 42.Wadhwa S, Chaudhary S, Voznesensky M, Epstein M, Raisz L, Pilbeam C. Fluid flow induces COX-2 expression in MC3T3-E1 osteoblasts via a PKA signaling pathway. Biochem Biophys Res Commun. 2002;297(1):46–51. doi: 10.1016/s0006-291x(02)02124-1. [DOI] [PubMed] [Google Scholar]