Abstract
The pathophysiology of post-traumatic osteoarthritis (PTOA) after intra-articular fractures is poorly understood. Pursuit of a better understanding of this disease is complicated by inability to accurately monitor its onset, progression and severity. Common radiographic methods used to assess PTOA do not provide sufficient image quality for precise cartilage measurements. Double-contrast MDCT is an alternative method that may be useful, since it produces high-quality images in normal ankles. The purpose of this study was to assess this technique’s performance in assessing cartilage maintenance in ankles with an intra-articular fracture. Thirty-six tibial plafond fractures were followed over two years, with thirty-one MDCTs being obtained four months after injury, and twenty-two MDCTs after two years. Unfortunately, clinical results with this technique were unreliable due to pathology (presumed arthrofibrosis) and technical problems (pooling of contrast). The arthrofibrosis that developed in many patients inhibited proper joint access and contrast infiltration, although high-quality images were obtained in eleven patients. In this patient subset, in which focal regions of cartilage degeneration could be visualized, thickness could be measured with a high degree of fidelity. While thus useful in selected instances, double-contrast MDCT was too unreliable to be recommended to assess these particular types of injuries.
Keywords: post-traumatic osteoarthritis, cartilage, imaging, fracture
INTRODUCTION
The development of post-traumatic osteoarthritis (PTOA) after tibial plafond fractures traditionally has been monitored on radiographs. Kellgren and Lawrence classified arthritis radiographically by assessing joint space narrowing, osteophyte formation, subchondral sclerosis, and subchondral cyst formation.1 In post-traumatic joints, reliably locating the subchondral surface and measuring the joint space is often difficult, even for experienced traumatologists.2 Plain radiographs are an intrinsically limited representation of what is in fact a complex, three-dimensional (3D) cartilage layer. A much more robust measure of cartilage volume and thickness is needed for clinical research aimed at elucidating the mechanistic causes of PTOA, so that suitable methods to forestall its onset may be developed and assessed.
MRI is an excellent imaging modality to capture fine details of cartilage and other soft tissues. MRI has been shown to be more effective than radiographs and conventional CT scans for assessing the extent and severity of osteoarthritis of the knee.3 However, MR image quality is poor in the presence of most internal fixation hardware that is used to treat an articular fracture. Since fixation hardware is normally in place for many months in such cases, MRI’s utility for assessing changes in cartilage thickness following those injuries is limited.
Multi-detector CT (MDCT) scans provide excellent detail of bony contour, and lend themselves to better metal artifact suppression than does MRI. CT therefore is frequently used to assess articular fractures. A recent study in (normal) cadavers showed that in comparison with MRI, double-contrast MDCT scans more accurately measured the true thickness of articular cartilage of the ankle.4 Since conventional CT scans normally do not delineate articular cartilage, the protocol in that study involved injection of both contrast medium and air into cadaver ankles, to obtain suitable images from which to measure cartilage thickness. The MRI and MDCT image-based measurements were compared with direct caliper measurements of cartilage thickness in osteochondral plugs excised from the tibia and talus. The data showed the cartilage thickness measured on double-contrast MDCT images to be within 0.1 mm of direct physical measurements.4
Building on that work, a study was designed to investigate the utility of double-contrast MDCT scans to assess cartilage thickness changes in ankles of patients who had sustained a fracture of the tibial plafond. The purposes were: 1) to determine if double-contrast MDCT could provide image data of sufficient quality for assessing cartilage thickness changes in tibial plafond fractures with variable PTOA severity, 2) to assess and quantify cartilage thickness at 4 months and two years after injury, and 3) linking in with previously reported finite element contact stress data for this patient group,5 to investigate the spatial correlation between elevated contact stresses from imperfect reduction and subsequent changes in cartilage thickness.
METHODS
An Institutional Review Board approved this study, and informed consent was obtained from all patients. From 2003 to 2005, thirty-six patients with unilateral tibial plafond fractures consented at the time of their respective injuries to be in the study. There were twenty-three males and thirteen females, with ages that ranged from 20 to 64 years at time of injury. All fractures were type 43B or 43C by the AO/OTA classification, and were the result of one of two high-energy mechanisms, either a fall from a height or a motor vehicle collision. All fractures were treated in standardized fashion by an orthopaedic traumatologist at our institution (J.L.M.). The treatment included spanning articulated ankle external fixation at the time of injury, followed by percutaneous reduction and screw fixation of the articular surface, with the timing based on the fracture and sufficient resolution of the soft tissue injury. The articular reduction was judged using intra-operative fluoroscopy. The patients’ post-operative protocol was standardized: six to ten weeks of non-weight bearing, followed by progressive weight bearing as the fracture showed radiographic signs of stability and consolidation. The average time of external fixation was three months.
By protocol, all patients obtained a double-contrast MDCT scan at approximately four months after injury (soon after the initiation of weight bearing) and then again at a minimum of twenty-four months after injury (a predictable time for the development of PTOA in these fractures).6
Double-contrast arthrograms were performed by experienced radiologists, with the assistance of joint distraction using a purpose-developed ankle distractor7 and fluoroscopic guidance. First, about 0.7 ml of diatrizoate meglumine (Hypaque Meglumine 60%; Amersham Health, Princeton, NJ) was injected into the joint, followed by an injection of about 8 ml of room air. In order to help the contrast disperse throughout the joint, the radiologist then manipulated the ankle through its available range of motion. The patients were then transferred to a CT unit, where they were scanned in the transverse plane (i.e., with the x-ray beam perpendicular to the long axis of the tibia) with a sixteen–detector row CT scanner. Scanning parameters were 120 kVp, 75 mAs, 0.5-second gantry rotation, 3.5-mm table travel per rotation, 1-mm section thickness, and a 512 × 512 matrix with in-plane pixel dimensions of 0.3 × 0.3 mm. The images were reconstructed in 0.5-mm intervals. Boundaries of cartilage and other soft-tissue surfaces were made visible with the double injection of Hypaque contrast agent and air.
One of the authors, a senior orthopaedic resident (C.J.V.) who was blinded to other patient outcomes data, reviewed coronal plane reconstructions of the CT studies with DICOM image viewing software (OsiriX; www.osirix-viewer.com). Advancing slice-by-slice through each study, tibial subchondral bone and articular surface boundaries were manually traced using an interactive pen display (Cintiq 21UX; Wacom Co., Ltd) (Figure 1). In these images, cartilage appeared as a uniform gray material immediately adjacent to the brighter subchondral bone. The tibia and talus were separated by a pocket of air (darker intensity) or a thin layer of contrast (brighter intensity). Using Geomagic Studio (Geomagic Inc), these 2D tracings were stacked in 3D space enabling articular and subchondral surface reconstruction.
Figure 1.
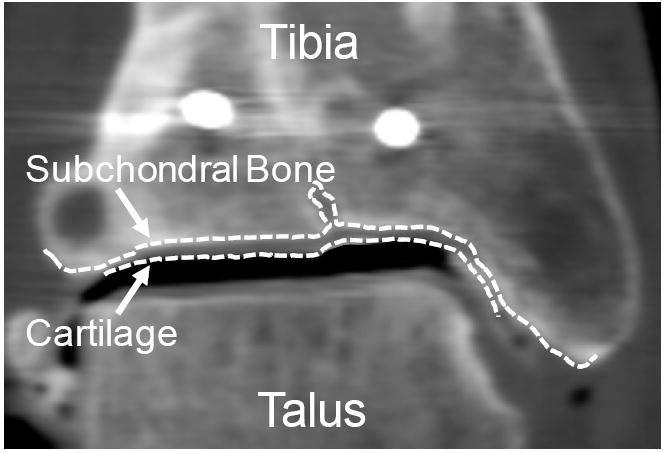
The subchondral bone and cartilage surfaces were traced slice-by-slice in a series of 2D coronal CT images. Bone and cartilage 3D surfaces were generated by stacking these 2D curves along the whole series.
Cartilage thickness was measured by spatially comparing the distance between the articular and subchondral 3D surfaces. This was performed by calculating the closest-point distances between these two surfaces over a grid with spatial resolution of 0.25×0.25mm. This provided continuous maps of cartilage thickness over the entire joint surface. Four-month and twenty-four month follow-up cartilage thickness data were mutually registered to one another in space, by aligning the fixation screws which had been implanted at the time of fracture reduction, again using the Geomagic Studio software.
An overall average cartilage thickness for each time point was compared between the two time points, both within and across patients. Within a given joint, a local point-by-point analysis of cartilage thickness was also performed. The reproducibility of the technique was assessed by a repeat analysis of the same MDCT scan by the same observer, after a nine month interval. With the bone and cartilage surfaces reconstructed, the joint was discretized into a grid of 2mm×2mm patches. The cartilage thickness for each patch was compared between the first and second analysis. The differences between processing sessions are illustrated in a Bland-Altman plot (Figure 3). The average thickness measurements differed by only 0.15mm, and only 12 of the 250 patches were outside 2 standard deviations from the mean. With an average voxel scale of 0.3mm, the discrepancy between the two analyses was deemed not significant. The average cartilage thickness loss for each ankle was compared to that patient’s Kellgren Lawrence (KL) rating, which had previously been obtained independently by the two clinical authors (J.L.M. and C.J.V.), with a unified rating then obtained by consensus. In eight cases at four months and in five cases at twenty-four months, cartilage thickness maps were spatially compared to contact stress exposures (a measure of the joint’s contact stress history over a specified time period) point-by-point over the joint surface, using previously obtained finite element data5. These finite element data, had been developed from immediate post-reduction CT scans of the injured ankles, and had been validated physically8.
Figure 3.
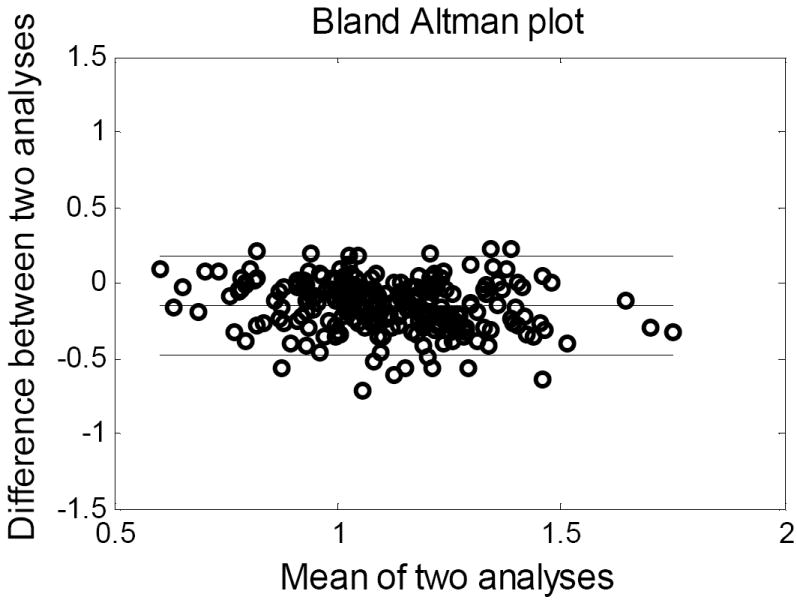
Thickness measurement repeatability was tested by reprocessing a CT study 6 months after the initial analysis. A Bland-Altman plot illustrates the results.
RESULTS
Thirty-one of the thirty-six enrolled patients underwent a double-contrast MDCT scan at four months after injury. The quality of data from these scans was inconsistent. In some instances, delineations between bone, cartilage and contrast were clearly visible. For these cases, it was possible to examine the cartilage, or lack thereof, with great precession (Figure 2A-E). However, other MDCT studies were technically and logistically problematic. Various factors including patient compliance, joint pathology, and MDCT limitations all contributed to its poor performance (Figure 2F).
Figure 2.
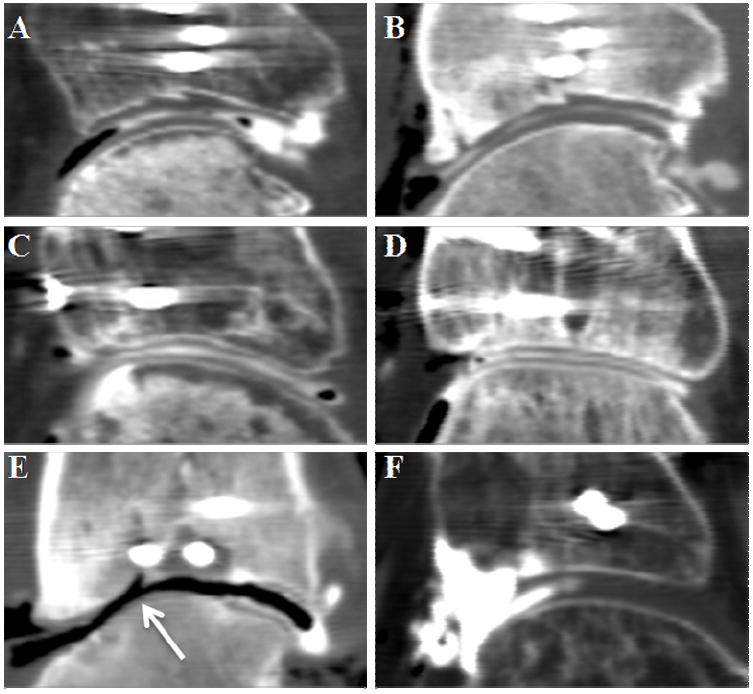
Sagittal views of representative double-contrast MDCTs are shown. In the top row, cartilage thinning is apparent between (A) early and (B) later scans, particularly in the central region. The middle row illustrates a case that preserved its cartilage between time points (C:4months, and D:24months). Image (E) illustrates a joint with severe thinning and exposed bone near a step-off (arrow). The CT slice in (F) is an example of a failed study. Note the pooling of contrast in the anterior region (left side of image).
Four patients dropped out of the study within the first four months for personal reasons. One patient was noted to have had previous ankle trauma, and was excluded from the study. Twenty-two of these thirty-one patients returned to undergo a second double-contrast MDCT scan at a minimum of twenty-four months. Reasons that a second scan could not be obtained included patient refusal, subsequent incarceration, and body habitus precluding CT scan acquisition. Of the twenty-two patients with double-contrast MDCT scans at both four and twenty-four months post-fracture, eleven had CT images that for one or both of the two time points were not interpretable for cartilage measurement. In six of these scans, there was a uniform grey tissue in the joint space seen on the CT images, suggestive of arthrofibrosis. Contrast was visible at some sites within the joint capsule, but did not disperse throughout the joint (Figure 2F). Two patients had scans that showed this appearance of arthrofibrosis at both four and twenty-four month time points; in four patients, the arthrofibrosis seen at 4 months appeared to have resolved by twenty-four months.
Of the remaining five patients with non-interpretable scans, two had substantial hardware artifact distorting the images. In another patient, scan images revealed large articular depressions, such that it was not clear that the tissue that was imaged represented articular cartilage. In the remaining two patients, contrast injection was unsuccessful.
Thus, there were a total of only 11 patients with MDCT scans at both four and twenty-four months follow-up in which cartilage thicknesses could be measured (Table 1). For these cases with clear tissue boundaries, a great amount of detailed information could be extracted for analysis. The cartilage degeneration could not only be qualitatively visualized, but could also be quantitatively studied with great resolution. In these successful scans, the distribution of cartilage thickness at four and twenty-four months was computed. To illustrate the utility of this MDCT analysis technique, the results from two representative cases are shown in Figure 4. These data demonstrate how degeneration can be quantified and compared in inter and intra-patient studies. Furthermore, these MDCT results could be compared to macro-level grading schemes such as the Kellgren-Lawrence. For these 11 cases, twenty-four month KL grades and average cartilage thicknesses were compared. Cases with KL grades ≥2 appeared to correlate with a notable decrease in average cartilage thickness, not surprisingly representing cartilage thinning over time (Table 1).
Table 1.
Patient characteristics are displayed for the 11 cases with successful MDCT scans
| Patient # | Sex | Age at Injury | AO/OTA Classification | Mechanism of Injury |
|---|---|---|---|---|
| 1 | M | 42 | C11 | fall (15 ft) |
| 2 | M | 34 | C23 | fall (18 ft) |
| 3 | F | 42 | B21 | motor vehicle accident (30mph) |
| 4 | M | 20 | B23 | all terrain vehicle |
| 5 | F | 36 | C32 | motor vehicle accident (20mph) |
| 6 | M | 41 | B13 | fall (20 ft) |
| 7 | M | 29 | B21 | all terrain vehicle |
| 8 | M | 25 | B12 | fall (16 ft) |
| 9 | F | 38 | C33 | motor vehicle accident (50mph) |
| 10 | F | 57 | C23 | fall (ice) |
| 11 | F | 55 | C21 | fall (4 ft) |
Figure 4.
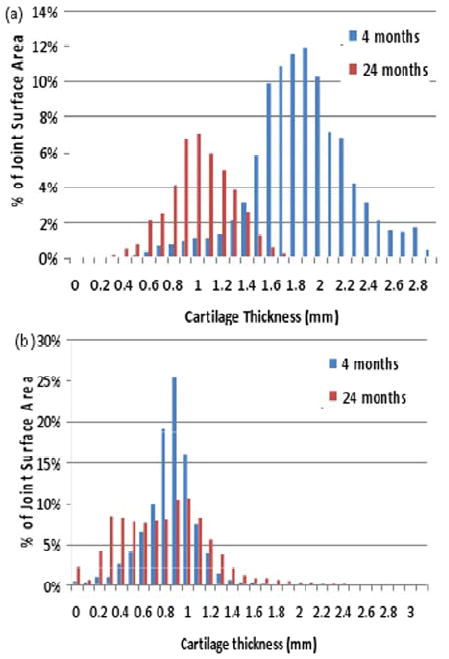
(a) This representative histogram of the observed cartilage thickness in an ankle joint demonstrates global loss of cartilage thickness from 4 to 24 months. Average cartilage thickness decreased in this particular case from 1.82mm to 0.97mm. This ankle was graded KL 3. (b) The histogram from a second case demonstrates the re-distribution in cartilage thickness from 4 to 24 months. Average cartilage loss in this case was only from 0.80mm to 0.74mm. Cartilage which was globally thin appeared to become more uniform over time. This case was also graded at KL=3.
Three-dimensional cartilage thickness maps were also generated for each patient. In order to study how cartilage responds to its local mechanical environment (e.g. its contact stress exposure), thickness maps were spatially registered and compared to finite element contact stress mappings (Figure 5). Correlations of these respective data showed a general association between sites of increased contact stress with sites of cartilage thinning (Figure 5a, arrow).
Figure 5.
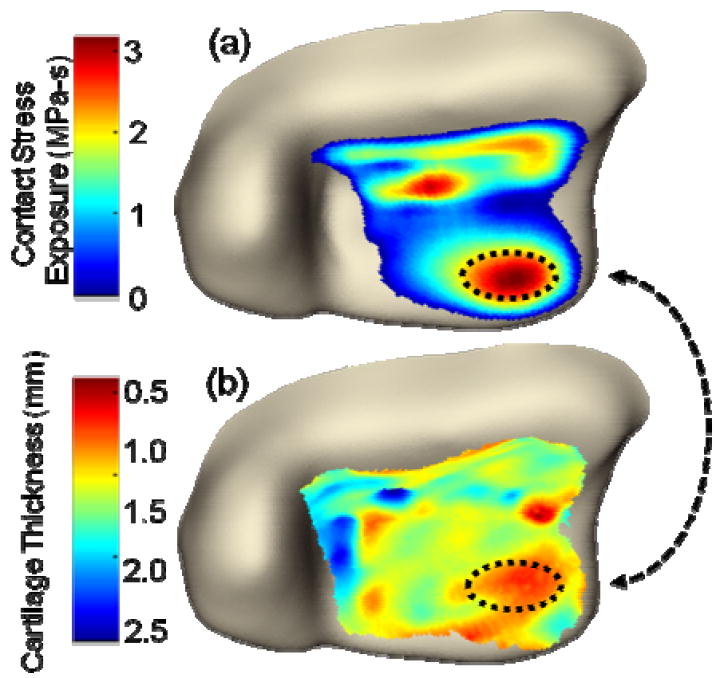
(A) This finite element plot depicts the habitual contact stress exposure (MPa-s) computed over the joint surface. (B) This contour plot shows the variation in cartilage thickness over the joint surface. Beginning from a situation of assumed uniform thickness (1.7mm), the cartilage showed thinning areas of substantially elevated contact stress.
DISCUSSION
Previous radiographic analyses of PTOA have been limited to standard radiographic imaging. The preservation of joint space on radiographs has been commonly used as a surrogate for cartilage thickness, quality, and function, because plain radiography is a cost-effective and widely available means of imaging a joint. However, PTOA assessments made using plain radiographs have significant limitations. Most notably, these analyses are not 3D, the surface of interest (i.e., the cartilage) is not directly visualized, and the methods exhibit questionable reliability. Investigators who have studied the ability of observers to measure steps and gaps in the subchondral line of fractured joints have found high variability in those measurements.2,9
In some circumstances, CT arthrography can provide high-quality 3D images that allow for highly sensitive and specific cartilage assessments.10, 11 In a purpose-conceived cadaver experiment, El-Khoury et al directly compared double-contrast MDCT arthrography to MRI, using 3D fat-suppressed spoiled gradient-echo in the steady state (generally accepted as the best sequence for cartilage imaging12). Their results showed that double-contrast MDCT arthrograms provided more precise and more accurate cartilage thickness measurements than did the MR images.4 Unfortunately, the present clinical results with this technique were much less favorable than El-Khoury et al’s experience in the idealized cadaver setting. We encountered notable difficulties. Image scatter and distortion were issues in two of eleven patients, that made meaningful interpretation of cartilage thickness unreliable. (The cadaver study had been performed in non-fractured ankles, so this issue never arose.)
Physically performing arthrography was difficult, even for experienced radiologists working under fluoroscopic guidance. Some patients declined a second study because of apprehension about needle insertion. The radiologists reported that introduction of needles into highly disordered joints was particularly difficult, citing suspected arthrofibrosis as a factor making joint distraction difficult or even impossible. Six patients underwent technically successful fluoroscopically-guided injections, but the contrast failed to adequately disperse throughout the joint. Contrast was clearly visible at some sites within the joint capsule, but it tended to pool anteriorly or within the lateral or medial gutters of the joint, rather than spreading between the articular surfaces (Figure 2).
Arthrofibrosis of the knee has been extensively reported in the literature,13 and is a known complication of trauma, surgical or otherwise. However, the literature on arthrofibrosis in the ankle is limited. To our knowledge, the only study in that area is that of Utsugi et al,14 who identified arthrofibrosis in both tibial plafond and rotational ankle fractures during arthroscopic examinations of 33 patients at an average time of twelve months after injury. They found some degree of arthrofibrosis in 73% of the cases, and confirmed their findings histologically. In six of our 22 cases, we felt that arthrofibrosis was a likely explanation for the poor image quality and the inability to outline cartilage surfaces with contrast. While observed both in our cases and in those of Utsugi et al, arthrofibrosis is an interesting and largely unreported problem after high-energy ankle fractures. Although this pathophysiology was substantially responsible for our suboptimal results with double-contrast MDCT, it arguably merits further study in its own right, since it may help forestall painful contact of cartilage-eburnated bony surfaces.
Of the 31 patients initially entered in the study, in only eleven was it possible to successfully assess the joint at two points in time with image quality suitable for quantitative analysis of the cartilage. In some of these cases, cartilage demonstrated global thinning from four months to two years, consistent with progression to PTOA. Other cases showed no difference in cartilage thickness over time, and a few even displayed modest increases in average thicknesses (Table 1). A likely explanation for this apparent thickening (a phenomenon at variance with progression toward PTOA) is that areas near incongruities may have developed thicker fibrotic tissues, indistinguishable from hyaline cartilage in the CT arthrogram image, which consequently biased the measurements.
While cartilage thickness changes over time were generally consistent with whole-joint KL grades, cases with successful double-contrast MDCT arthrograms enabled focal regions of cartilage degeneration to be visualized and their thickness measured, with a fidelity which would not have been possible with conventional radiograph analysis. When these 3D cartilage thickness maps were compared to corresponding finite element stress distributions, there was a general spatial association between elevated contact stress exposures over small and large regions, and focal areas with cartilage degeneration. At the four month time point over the spectrum of contact exposures, cartilage thickness was maintained. However, on the twenty-four month scans, cartilage thickness decreased when habitual contact stress exposures exceeded normal physiologic levels of approximately 2.7 MPa-s. Even though this finding is novel and interesting, however, no conclusive statements relating correlation of aberrant contact stresses to cartilage thinning can be made from the limited number of patients studied. To make substantial advances in understanding of the development of PTOA, a larger series of patients would need to be studied.
In summary, although high quality images were possible in some patients, double-contrast MDCT scans were too problematic for routinely studying cartilage degeneration in ankles of pilon fracture patients. The reasons are both the inherent joint pathology (especially arthrofibrosis) and technical difficulties (failed injection, metal artifact). While the various difficulties encountered during this study illustrate double-contrast MDCT’s serious shortcomings for quantifying ankle PTOA, this modality may nonetheless be useful in other circumstances. In studies with less conforming joints and/or with pathologies that do not inhibit contrast infiltration, double-contrast MDCT would likely yield high-resolution images similar to those reported by El Khoury et al. Clearly, however, researchers interested in using double-contrast MDCT should validate its practicality and efficacy in-vivo for the specific anatomy and pathology in question, prior to undertaking large-scale trials.
Acknowledgments
We would like to thank George El-Khoury MD and Patty Stolley RN for assistance in radiology and patient care. Funding and support of this project was received from; NIH (AR46601, AR48939 and AR55533), the Orthopaedic Trauma Association, and the AO Research Fund.
References
- 1.Kellgren JH, Lawrence JS. Radiological assessment of osteo-arthrosis. Ann Rheum Dis. 1957 Dec;16(4):494–502. doi: 10.1136/ard.16.4.494. [DOI] [PMC free article] [PubMed] [Google Scholar]
- 2.Martin J, Marsh JL, Nepola JV, Dirschl DR, Hurwitz S, DeCoster TA. Radiographic fracture assessments: which ones can we reliably make? J Orthop Trauma. 2000 Aug;14(6):379–385. doi: 10.1097/00005131-200008000-00001. [DOI] [PubMed] [Google Scholar]
- 3.Chan WP, Lang P, Stevens MP, et al. Osteoarthritis of the knee: comparison of radiography, CT, and MR imaging to assess extent and severity. AJR Am J Roentgenol. 1991 Oct;157(4):799–806. doi: 10.2214/ajr.157.4.1892040. [DOI] [PubMed] [Google Scholar]
- 4.El-Khoury GY, Alliman KJ, Lundberg HJ, Rudert MJ, Brown TD, Saltzman CL. Cartilage thickness in cadaveric ankles: measurement with double-contrast multi-detector row CT arthrography versus MR imaging. Radiology. 2004 Dec;233(3):768–773. doi: 10.1148/radiol.2333031921. [DOI] [PubMed] [Google Scholar]
- 5.Li W, Anderson DD, Goldsworthy JK, Marsh JL, Brown TD. Patient-specific finite element analysis of chronic contact stress exposure after intraarticular fracture of the tibial plafond. Journal of Orthopaedic Research. 2008;26(8):1039–1045. doi: 10.1002/jor.20642. [DOI] [PMC free article] [PubMed] [Google Scholar]
- 6.Marsh JL, Bonar S, Nepola JV, Decoster TA, Hurwitz SR. Use of an articulated external fixator for fractures of the tibial plafond. J Bone Joint Surg Am. 1995 Oct;77(10):1498–1509. doi: 10.2106/00004623-199510000-00004. [DOI] [PubMed] [Google Scholar]
- 7.Baer TE, Stolley MP, Thedens DR, Brown TD, Saltzman CL. Clinical tip: development of an ankle distraction device compatible with MRI and radiography. Foot Ankle Int. 2006 Jun;27(6):472–474. doi: 10.1177/107110070602700615. [DOI] [PMC free article] [PubMed] [Google Scholar]
- 8.Anderson DD, Goldsworthy JK, Li W, James Rudert M, Tochigi Y, Brown TD. Physical validation of a patient-specific contact finite element model of the ankle. J Biomech. 2007;40(8):1662–1669. doi: 10.1016/j.jbiomech.2007.01.024. [DOI] [PMC free article] [PubMed] [Google Scholar]
- 9.McCallister WV, Smith JM, Knight J, Trumble TE. A cadaver model to evaluate the accuracy and reproducibility of plain radiograph step and gap measurements for intra-articular fracture of the distal radius. J Hand Surg [Am] 2004 Sep;29(5):841–847. doi: 10.1016/j.jhsa.2004.04.019. [DOI] [PubMed] [Google Scholar]
- 10.De Filippo M, Bertellini A, Pogliacomi F, et al. Multidetector computed tomography arthrography of the knee: Diagnostic accuracy and indications. Eur J Radiol. 2008 Mar 6; doi: 10.1016/j.ejrad.2008.01.034. [DOI] [PubMed] [Google Scholar]
- 11.De Filippo M, Bertellini A, Sverzellati N, et al. Multidetector computed tomography arthrography of the shoulder: diagnostic accuracy and indications. Acta Radiol. 2008 Jun;49(5):540–549. doi: 10.1080/02841850801935559. [DOI] [PubMed] [Google Scholar]
- 12.Disler DG, McCauley TR, Wirth CR, Fuchs MD. Detection of knee hyaline cartilage defects using fat-suppressed three-dimensional spoiled gradient-echo MR imaging: comparison with standard MR imaging and correlation with arthroscopy. AJR Am J Roentgenol. 1995 Aug;165(2):377–382. doi: 10.2214/ajr.165.2.7618561. [DOI] [PubMed] [Google Scholar]
- 13.Shelbourne KD, Patel DV, Martini DJ. Classification and management of arthrofibrosis of the knee after anterior cruciate ligament reconstruction. Am J Sports Med. 1996 Nov-Dec;24(6):857–862. doi: 10.1177/036354659602400625. [DOI] [PubMed] [Google Scholar]
- 14.Utsugi K, Sakai H, Hiraoka H, Yashiki M, Mogi H. Intra-articular fibrous tissue formation following ankle fracture: the significance of arthroscopic debridement of fibrous tissue. Arthroscopy. 2007 Jan;23(1):89–93. doi: 10.1016/j.arthro.2006.07.055. [DOI] [PubMed] [Google Scholar]


