

Abstract
It is well-established that genetic factors account for large proportions of individual differences in multiple cognitive abilities. It is also well-established that individual differences in performance on many different cognitive ability measures are strongly correlated. Recent empirical investigations, however, have suggested two interesting qualifications to these well-established findings: Genetic variance in cognitive abilities is higher in richer home environments (gene-by-environment interaction), and common variance in different cognitive abilities is lower at higher levels of overall ability (nonlinear factor structure). Although they have been investigated independently, these two phenomena may interact, because richer environments are routinely associated with higher ability levels. Using simulation we demonstrate how un-modeled nonlinear factor structure can obscure interpretation of gene-by-environment interaction. We then reanalyze data from the National Collaborative Perinatal Project, previously used by Turkheimer et al. (2003; Psychol Science), with a two-step method to model both phenomena.
Keywords: Intelligence, Differentiation, Gene-by-environment interaction, Nonlinear factor analysis
Introduction
Over the course of the early twentieth century researchers made significant progress toward the scientific understanding of human cognitive abilities on two fronts. First, using siblings and other relatives, early behavior geneticists sought to decompose between-person variation in cognitive ability estimates into proportions attributable to genetic influences and proportions attributable to environmental influences. Pearson (1903) asked teachers to rate their students as either “Quick Intelligent,” “Intelligent,” “Slow Intelligent,” “Slow,” “Slow Dull,” “Very Dull,” or “Inaccurate-Erratic.” He found that siblings correlated on these ratings at approximately 0.5, the same value obtained for sibling correlations on physical characteristics (e.g., head size and height), which he reasoned were in large part genetic. This led him to the conclusion that, like physical characteristics, “mental” characteristics are largely inherited from one’s parents.
Second, early psychometricians sought to decompose between-person variation in performance on multiple cognitive tests into proportions attributable to common and unique influences. Spearman (1904) found positive correlations among school children’s scores on examinations of Classics, French, English, Mathematics, and Music, levels of performance on pitch discrimination, weight discrimination, and visual discrimination tasks, teacher ratings of cleverness, and peer ratings of common sense. He posited that these positive correlations resulted from a common influence, which he termed general intelligence (“g”). Variation that he could not attribute to g, he attributed to specific factors (“s”) and error of measurement.
Owing in large part to the development and refinement of behavior-genetic and psychometric theories, data, and methods over the past century, two major phenemona are now well-established. First, performance on many different sorts of cognitive tests can be attributed to a smaller number of different abilities (e.g., spatial visualization, speed of processing, and long term memory, to name a few), and these abilities are strongly related to one another, such that a single common factor can be presumed to influence them all (Carroll 1993). Second, approximately half of the variation in the single common factor (or a representative composite measure) can be attributed to genetic factors (Bouchard and McGue 2003).
Such behavior genetic and psychometric results can be simultaneously represented using a structural equation modeling framework. Figure 1 depicts a popular version of such a representation, which is based on data from monozygotic and dizygotic twins reared together. This model can be subcategorized into a psychometric portion at the subordinate level and a biometric portion at the superordinate level. The psychometric portion of the model relies on the relations among multiple variables to infer a common phenotypic trait, whereas the biometric portion of the model relies on differences in the degrees of similarity between relatives of varying degrees of genetic relatedness in order to decompose variation in the trait into genetic, shared environmental, and nonshared environmental components.
Fig. 1.
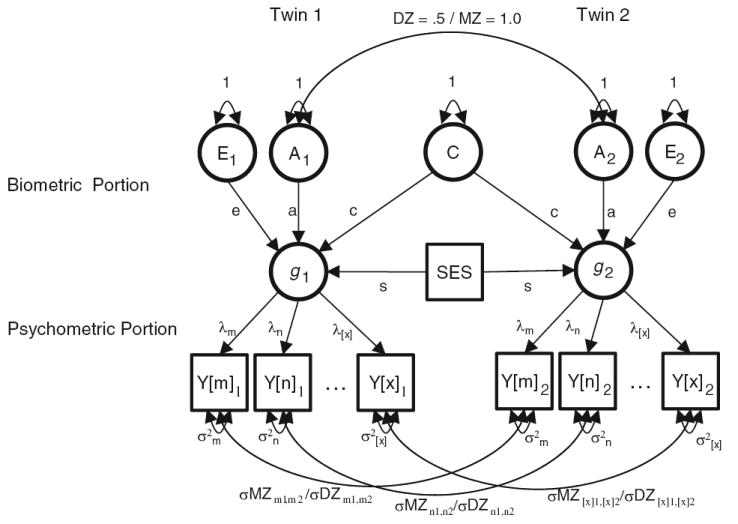
A latent variable model often used to examine multivariate cognitive ability data obtained from monozygotic (MZ) and dizygotic (DZ) twins reared together. Observed variables (e.g., the different cognitive tests, Y[m], Y[n],…,Y[x]) are represented as squares, latent variables (e.g., general cognitive ability, and its genetic and environmental influences) are represented as circles, variances and covariance relationships are represented as two-headed arrows, and regression relationships are represented as one-headed arrows. SES represents socioeconomic status, a family-level covariate
Although they occupy separate regions of the model, these psychometric and biometric levels of analysis are not independent. Rather, inference at the superordinate, biometric, level of analysis is dependent on the assumptions of the subordinate, psychometric, level. One well-known example of this dependency is when perfect measurement is incorrectly assumed, such that measurement error at the psychometric level is confounded with nonshared environement (“E”) at the biometric level. The focus of the current article is on a less well-recognized example of this dependency. We are specifically interested in the consequences for biometric analyses when a nonlinear factor structure holds but is not modeled.
Additive linear relations among variables is a central assumption of the standard structural equation modeling approach. This assumption requires that the relations between any two variables do not vary in magnitude according to the levels of those variables or any other variables. Recently, however, researchers have begun to construct and employ statistical methodologies that are capable of explicitly testing non-additive, nonlinear, structural equation models (e.g., Eaves and Erkanli 2003; Muthén and Asparouhov 2003; Neale 1998; Purcell 2002; Klein and Moosbrugger 2000).
These new nonlinear methodologies are increasingly being applied by behavior-genetic researchers to address questions of gene-by-environment interaction. Based on such methods, Turkheimer et al. (2003) and Harden et al. (2007) have reported results which suggest that the genetic and environmental contributions to children’s and adolescents’ general cognitive ability differ according to socioeconomic status (a gene-by-environment interaction), such that genetic influences are higher and environmental influences are lower at higher levels of socioeconomic status (SES).1 These results are consistent with theories (e.g., Bronfenbrenner and Ceci 1994; Turkheimer and Gottesman 1991) which suggest that genetic propensities can be more fully cultivated, expressed, and actuated in more enriched and supportive environments. Bronfenbrenner and Ceci (1994; p. 572) have suggested that such mechanisms may include “enduring forms of interaction in the immediate environment…found in parent–child and child–child activities, group or solitary play, reading, learning new skills, problem solving, performing complex tasks, and acquiring new knowledge and know-how.”
Nonlinear methodologies have also recently been applied for psychometric scrutiny of the conventional linear factor model. There are at least two reasons to expect the factor structure of cognitive abilities to depart from linearity. The first reason is that the tests themselves may be poorly constructed, such that they have ceiling or floor effects, or uneven distributions of item difficulties, which can lead to observed scores being better indications of true scores at different levels of performance. Therefore, nonlinear factor structure can be a methodological nuisance than needs to be controlled for. The second reason is that the abilities themselves may be differentially related to one another according to various person-characteristics. Based on an application of nonlinear factor analysis to carefully scaled data from the normative sample of the Woodcock Johnson III Tests of Cognitive Abilities, Tucker-Drob (2009; see Detterman and Daniel 1989 for an earlier approach) has recently reported results suggesting that a common factor accounts for a decreasing proportion of variation in cognitive abilities at higher overall ability levels. These results are consistent with what has been termed the ability differentiation hypothesis,2 which states that cognitive abilities are more strongly related to one another at lower ability levels, where “central [information processing mechanisms] are deficient [such that] they limit the efficiency of all other processes in the system” (Detterman and Daniel, 1989, p. 358). Anderson’s theory of minimal cognitive architecture (1992, 2001) holds that speed of processing is this central mechanism that, for slower individuals, limits the efficiency of independent, domain-specific, “processors.” However, other plausible central mechanisms include executive functioning and working memory (see, e.g., Ackerman et al. 2005; Salthouse et al. 2003; Tucker-Drob and Salthouse 2009, for reviews and examinations of how executive functioning and working memory might be central to cognition).
As we suggested earlier, these findings from behavior-genetic and psychometric analyses of nonlinearity may not be independent. For illustrative purposes, consider the most basic behavior-genetic model: a comparison of the test scores of monozygotic (MZ) twins reared apart. The higher the correlation between the twins’ scores, the higher the estimated heritability. Let us assume that the true heritability of general cognitive ability is constant across SES levels. Now, if abilities are less related to one another with increasing general ability level, and if ability levels increase with socioeconomic status, then composite test scores representative of general ability will be worse indicators of the true latent ability at higher ability levels and thus at higher SES levels (this is analogous to the internal consistency of the composite score being lower at higher ability levels). Consequently, the correlation between the test scores of the first and second members of MZ twin pairs would be lower at higher SES levels, leading to artifactually lower estimates of heritability at higher SES levels. This line of reasoning becomes more complex when the design includes both MZ and DZ twins reared together.
In the current article we report the results of two simulation experiments that illustrate how an unmodeled nonlinear factor structure of cognitive ability may influence the estimates of gene-by-environment interaction in models for monozygotic and dizygotic twins reared together.3 We predict that, under empirically plausible conditions, if abilities are indeed differentially related to one another according to general ability level, but this phenomenon is not modeled, heritability and environmentality will appear to differ according to levels of a variable that is correlated with general ability (e.g., SES). After presenting the simulation results, we present results from analyses of data on 7-year-old twins drawn from the National Collaborative Perinatal Project, a large sample study with a high proportion of impoverished and minority families (previously analyzed by Turkheimer et al. 2003).
Analysis of simulated data
The purpose of our two simulations was to demonstrate the impact of failure to model nonlinear relations among abilities on estimates from biometric models of gene-by-environment interaction. In our simulations we generated data according to models with nonlinear factor structure at the psychometric level, additive A, C, and E contributions at the biometric level (i.e., no gene-by-environment interaction; G × E), and a family-level covariate. We then analyzed the data by forming unit-weighted composite scores for the phenotype for each twin and fitting a biometric model with provisions for G × E (Purcell 2002).
All simulations were conducted in Mplus (Muthén and Muthén 1998–2007). The corresponding syntaxes are available on Eric Turkheimer’s professional website (http://people.virginia.edu/~ent3c/tuckerdrob/MPlus_Code.htm).
True models
The true models were specified to be nonlinear in the factor loadings and statistically additive (i.e., no G × E) in the ACE components.
Equivalent nonlinear cognitive ability factor structures were specified for each twin as follows:
| (1) |
where Y[x] is the observed score on each of three tests (x), each of which were indicators of a latent “g” factor. The subscript t corresponds to the twin designation (i.e., first or second member of the pair), and the subscript p corresponds to the twin pair. g represents the latent factor representing general cognitive ability, and u represents test-specific residual factors, each specified to be uncorrelated, with variances . The λ0 coefficients on g represents the linear components of the factor-variable relations, and the λ1 coefficients on g2 represent the quadratic components of the factor-variable relations.
The g factor was specified to be influenced by four statistically additive and independent components: a measured family-level covariate (SES), a latent genetic component (A), a latent family-level shared environmental component (C), and a latent individual-level nonshared environmental component as follows:
| (2) |
where all four components (SES, A, C, and E) were specified to have unit variances. The additive genetic factors were correlated at 1.0 for monozygotic twins and 0.50 for dizygotic twins.
Specified models
The specified models were fitted to unit-weighted composite scores (created by summing the scores on the three tests for each twin). These specified models allowed for potential G × E by allowing SES to modify the influences of A, C, and E on general cognitive ability. That is, the composite scores, yt,p, were specified to be influenced by SES, A, C, and E, and the interactions between SES and A, C, and E, as follows:
| (3) |
where the s, a0, c0, and e0 coefficients represent the main effects of SES, A, C, and E, respectively, and the a1, c1, and e1 coefficients represent the interactions of SES with A, C, and E, respectively. These interaction coefficients allow for the possibility that the heritability and environmentality of general cognitive ability differ according levels of socioeconomic status. Such interactions are not present in the true model.
Results
Two sets of simulations were conducted, one in which the true model contained negative λ1 coefficients (all λ1[x] = −0.2), such that g accounts for a decreasing proportion of variation in test scores at higher ability levels, and one in which the true model contained positive λ1 coefficients (all λ1[x] = 0.2), such that g accounts for an increasing proportion of variation in test scores at higher ability levels. For both simulations, the true models also contained the following parameter specifications: λ0[x] = 1, , s = 0.6, a = 0.7, c = 0.3, e = 0.5. This resulted in SES accounting for 30% of the variation in the phenotype, and A accounting for 59%, C accounting for 11%, and E accounting for 30% of the variation in the SES residualized phenotype. Fifty datasets were generated for each simulation. Each dataset contained complete data from 1,000 twin pairs (approximately 500 MZ and 500 DZ).
Figure 2 displays the proportion of variance in the tests accounted for by the g factor as a function of the score on the g factor for the true models in Simulation 1 (top) and Simulation 2 (bottom). It can be seen that in Simulation 1 the g factor accounts for a decreasing proportion of variation in the test scores at higher scores on the g factor. Alternatively, it can be seen that in Simulation 2 the g factor accounts for an increasing proportion of variation in the test scores at higher scores on the g factor.
Fig. 2.
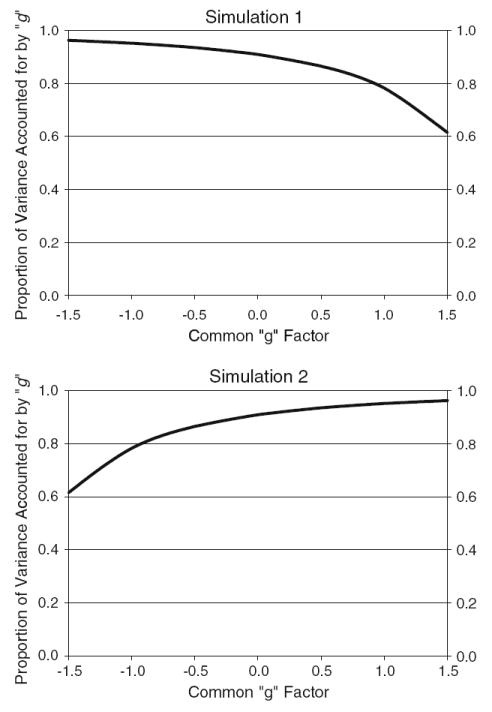
Nonlinear effects in the true model. The proportion of variance in the tests accounted for by the g factor is plotted as a function of the score on the g factor for Simulation 1 (top) and Simulation 2 (bottom)
Figure 3 displays the key results of the (mis)specified models. Plotted are the average proportions of variance in the SES-residualized composite test score accounted for by the A, C, and E components as functions of the SES score. It can be seen that, although not specified in the true models, SES moderation of the A, C, and E influences was inferred.4 In Simulation 1, these interactions were in the direction of lower heritability at higher levels of SES. In Simulation 2, these interactions were in the direction of higher heritability at higher levels of SES. Note that very similar trends were predicted by applying the equations analytically derived in Appendix 1 to similar sets of assumed true values of a2, c2, and e2, λ0, λ1, , and s. These results highlight the perils of failing to properly model the (nonlinear) factor structure of the phenotype at the psychometric level. In the next section we report results of G × E analyses of real data in which a nonlinear factor model is specified at the psychometric level.
Fig. 3.

Biometric results for the fitted model (solid line) and the true model (dashed line) from Simulation 1 (top) and Simulation 2 (bottom). The proportions of variance in the composite score accounted for by the genetic (a), shared environmental (c), and nonshared environmental (e) factors are plotted as functions of the SES level. SES on the x-axis is on a Z metric
Analysis of observed data
Participants
Here we report a reanalysis of data from the National Collaborative Perinatal Project, previously used by Turkheimer et al. (2003). Data were analyzed from 319 pairs of 7-year-old twins (114 monozygotic pairs, 205 dizygotic pairs) drawn from a parent sample of 59,397 children whose mothers were recruited from 12 urban hospitals across the United States during pregnancy and followed thereafter. One twin pair was removed as an outlier because one member of the pair was identified as brain damaged at birth. The dizygotic twins consisted of 81 same-sex pairs and 124 opposite-sex pairs. Previous examinations (Turkheimer et al. 2003) revealed no differences between same-sex and opposite sex pairs, and they were therefore combined for all analyses. Twins were 43% White, 54% Black, and 3% “Other.” Many of the twins came from impoverished families. The median years of education for mothers and fathers was 11 years and 12 years, respectively. Note, however, that there was substantial variation in familial socioeconomic status. To illustrate, parental education ranged from 1 year (practically no formal schooling) to 18 years (a Master’s degree).
Measures
As in Turkheimer et al. (2003), socioeconomic scores were computed from a linear combination of combined parental occupation, occupation status, and income, and placed on a 100-point scale.
Whereas the Turkheimer et al. (2003) analyses were based on composite IQ measures (PIQ, VIQ, & FSIQ), data were actually available for twelve separate cognitive tests, many from the Wechsler Intelligence Scale for Children, which are the basis of the analyses reported here. Here we are concerned with the single factor common to all twelve tests. Although contemporary representations of cognitive ability structure include multiple cognitive abilities, it is well-established that at the highest level of analysis, a single factor can be statistically extracted (Carroll 1993).5 We extract this “g” factor from the following twelve measures: Arithmetic, Auditory Memory for Digits, Auditory Vocal Association Test, Bender Gestalt, Digit Span, Harris Drawing Test, Information, Picture Arrangement, Reading, Spelling, Vocabulary, and Word Identification. Descriptive statistics for these tests are provided in Table 1.
Table 1.
Descriptive statistics of variables by zygosity
| Variable | Twin 1 |
Twin 2 |
Twin 1, Twin 2 Correlation | ||||||
|---|---|---|---|---|---|---|---|---|---|
| Min | Max | Mean | SD | Min | Max | Mean | SD | ||
| Monozygotic twins | |||||||||
| SES score | 6.00 | 96.00 | 45.25 | 24.45 | 6.00 | 96.00 | 45.25 | 24.45 | |
| Arithmetic | 4.00 | 32.00 | 18.54 | 4.30 | 3.00 | 31.00 | 18.30 | 4.94 | 0.78 |
| Auditory Memory for Digits | 30.00 | 75.00 | 48.28 | 8.11 | 20.00 | 70.00 | 47.67 | 8.85 | 0.55 |
| Auditory Vocal Association Test | 4.00 | 25.00 | 16.48 | 4.59 | 4.00 | 26.00 | 15.83 | 4.83 | 0.85 |
| Bender Gestalt | 12.00 | 30.00 | 22.57 | 4.05 | 11.00 | 30.00 | 22.43 | 4.22 | 0.65 |
| Digit Span | 0.00 | 12.00 | 6.35 | 2.03 | 0.00 | 11.00 | 6.23 | 2.22 | 0.59 |
| Harris Drawing Test | 7.00 | 33.00 | 19.56 | 6.26 | 5.00 | 37.00 | 19.02 | 6.30 | 0.64 |
| Information | 1.00 | 13.00 | 6.40 | 1.93 | 0.00 | 13.00 | 6.44 | 2.10 | 0.69 |
| Picture Arrangement | 1.00 | 5.48 | 2.87 | 1.10 | 1.41 | 5.00 | 2.87 | 1.06 | 0.61 |
| Reading | 6.00 | 71.00 | 31.84 | 11.05 | 0.00 | 69.00 | 30.84 | 11.74 | 0.90 |
| Spelling | 6.00 | 43.00 | 22.63 | 5.97 | 3.00 | 40.00 | 22.06 | 5.92 | 0.87 |
| Vocabulary | 0.00 | 35.00 | 15.75 | 6.45 | 6.00 | 32.00 | 15.46 | 5.55 | 0.79 |
| Word Identification | 35.00 | 76.00 | 58.25 | 10.41 | 40.00 | 80.00 | 57.22 | 10.52 | 0.83 |
| Dizygotic twins | |||||||||
| SES score | 3.00 | 96.00 | 43.89 | 22.40 | 3.00 | 96.00 | 43.89 | 22.40 | |
| Arithmetic | 3.00 | 35.00 | 19.14 | 4.38 | 5.00 | 31.00 | 19.13 | 3.95 | 0.52 |
| Auditory Memory for Digits | 30.00 | 80.00 | 50.82 | 9.86 | 30.00 | 80.00 | 52.66 | 11.18 | 0.32 |
| Auditory Vocal Association Test | 5.00 | 26.00 | 16.50 | 4.13 | 5.00 | 24.00 | 16.90 | 3.95 | 0.70 |
| Bender Gestalt | 12.00 | 31.00 | 22.93 | 4.04 | 11.00 | 31.00 | 22.82 | 3.88 | 0.49 |
| Digit Span | 0.00 | 10.00 | 6.42 | 2.05 | 0.00 | 11.00 | 6.50 | 2.05 | 0.43 |
| Harris Drawing Test | 7.00 | 35.00 | 19.01 | 5.93 | 4.00 | 34.00 | 19.50 | 5.55 | 0.45 |
| Information | 1.00 | 13.00 | 6.62 | 1.97 | 0.00 | 12.00 | 6.63 | 1.87 | 0.52 |
| Picture Arrangement | 0.00 | 5.57 | 2.99 | 1.11 | 0.00 | 5.29 | 2.88 | 1.08 | 0.51 |
| Reading | 8.00 | 81.00 | 32.00 | 11.72 | 3.00 | 63.00 | 31.82 | 11.35 | 0.69 |
| Spelling | 6.00 | 45.00 | 22.66 | 6.08 | 2.00 | 38.00 | 22.81 | 5.61 | 0.67 |
| Vocabulary | 2.00 | 37.00 | 15.88 | 5.45 | 6.00 | 30.00 | 16.05 | 4.79 | 0.63 |
| Word Identification | 38.00 | 95.00 | 59.34 | 8.87 | 39.00 | 80.00 | 58.97 | 9.94 | 0.63 |
Because only total score data were available for each test, we were unable to perform item level analyses to determine test reliability, check for ceiling and floor effects, or carry out item response theory scaling. Interval measurement therefore cannot be assumed, and we are therefore careful not to make strong substantive inferences with respect to the magnitude or direction of the (nonlinear) results at the psychometric level. Nevertheless, any nonlinear effects that may exist, even if artifacts of poor test properties, are important to account for, as our simulations demonstrate that, if these effects are not modeled, they can lead to spurious G × E findings, or even perhaps mask a true G × E effect.
Analytic procedure
In a first step, Mplus was used to fit a nonlinear factor model to data from one twin per pair with maximum likelihood estimation. This model was specified to control for the main effects of SES, and to have linear and quadratic influences of the common g factor as follows:
| (4) |
The λ0[x] and λ1[x] parameters were then retained and a full twin model was specified in WinBUGS using Gibbs sampling estimation. Our movement from the Mplus maximum likelihood estimation method to the WinBUGS Gibbs sampling estimation method was necessary because of the added complexity of simultaneously modeling nonlinear factor structure and gene-by-environment interaction. As interaction and nonlinear terms are added, a model specified using maxim likelihood estimation in Mplus becomes “increasingly more computationally demanding” (p. 61, Muthén and Muthén 1998–2007) to the point of intractability. Alternatively, using Gibbs sampling makes fitting such complex nonlinear and interactive models computationally feasible (Eaves and Erkanli 2003).
The full model included a psychometric portion that was equivalent to that specified by Eq. 4, except, rather than freely estimating λ1 and λ2, these parameters were fixed to those that had been retained from the Mplus output. Similar to Eq. 3, the biometric portion of the model included the main effects of A, C, and E, as well as interactions between SES and A, C, and E. However, rather than specifying SES to modify the regressions of g on the A, C, and E components, SES was specified to modify the log-transformed variances of A, C, and E. This portion of the model is written as
| (5) |
| (6) |
| (7) |
| (8) |
This specification was found to yield more stable parameter estimates in WinBugs. Both this specification and the Eq. 3 specification are nearly identical in substance.
Finally, the unique A, C, and E components were also estimated for each test. These components were not focused on, as previous work (Turkheimer et al. in press) suggested that the SES moderation occurs on the common rather than unique A, C, and E components.
Psychometric results
As mentioned previously, the psychometric model was fit to data from one randomly chosen twin per pair. The addition of quadratic loading components (λ1) to the psychometric model significantly improved fit beyond a simple linear model, χ2(12) = 76.40, P < 0.01. Consistent with earlier work (e.g., Detterman and Daniel 1989; Tucker-Drob 2009), the overall trend was one in which the proportion of variance accounted for by the g factor was lower at higher ability levels. This effect is displayed in Figure 4, where it can be seen that the proportion of variance accounted for by g differs by approximately 7% from 1.5 SD’s below the mean factor score to 1.5 SD’s above the mean factor score. Accounting for these nonlinear effects should ensure that they do not obscure the true moderator effects in the biometric portion of the model.
Fig. 4.
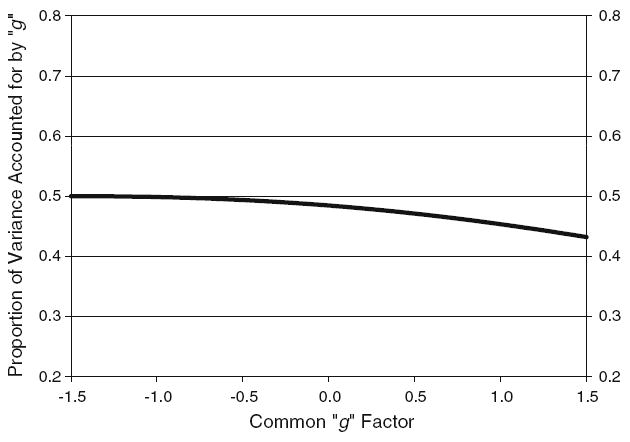
Psychometric results from analyses of observed data. The proportion of standardized variance in the tests accounted for by the common factor, g, is plotted as a function of the common factor score. The common factor on the x-axis is on a Z metric
Behavior-genetic results
The a1, c1, and e1 interaction parameters were all statistically significant, as the 95% credible intervals for these parameters did not surround zero. These interaction effects are plotted in Fig. 5, where it can be seen that genetic variance in g increases with increasing SES, whereas shared and non-shared environmental variance in g decreases with increasing SES. This pattern of results is consistent with previous research that did not account for the possible confounding of an unmodeled nonlinear factor structure (e.g., Harden et al. 2007; Turkheimer et al. 2003), and suggests that genetic factors are more influential in richer family environments.
Fig. 5.

Biometric results from analyses of observed data. The proportions of variance in common factor accounted for by the genetic (a), shared environmental (c), and nonshared environmental (e) factors, are plotted as functions of the SES level. SES on the x-axis is on a 100 point scale
Discussion
The assumption of statistical additivity has historically been one of computational convenience that has enabled for much progress in the scientific understanding of human cognitive abilities over the past century. With the main biometric and psychometric features of cognitive abilities now well-established at the population level (see e.g., Carroll 1993; Petrill 1997), and with continued computational, statistical, and theoretical advancements, scientific investigations of human cognitive abilities are proceeding in increasingly idiographic directions. Such directions include examinations of family-specific and person-specific modifiers of the genetic and environmental determinants of cognitive abilities, and of the positive relations among cognitive abilities. These directions do, however, also come with new methodological complications. Using simulation, we demonstrated that, if not modeled, nonlinear structure at the psychometric level can lead to spurious gene-by-environment interaction findings when no such phenomena actually exist (also see Appendix 1 for an analytical derivation).
In our analyses of observed data we found evidence for both nonlinear factor structure and gene-by-environment interaction. At the psychometric level, the general pattern was one of lower ability interrelations for higher ability individuals. After taking nonlinear factor structure into account, a pattern of higher heritability and lower environmentality of general cognitive ability with increasing socioeconomic status was found. This interaction was consistent with that indentified in previous analyses of this same dataset, in which the nonlinear factor structure was not accounted for (Turkheimer et al. 2003), and with that identified in a previous study with different data (Harden et al. 2007), which also did not have provisions for nonlinear factor structure. The interaction is consistent with theoretical perspectives (e.g., Bronfenbrenner and Ceci 1994) that genetic propensities are most fully actualized when environmental constraints are lifted and opportunities to foster the propensities are in place.
Qualifications and limitations
One limitation of our real data analysis is that only raw score, and not item-level, data were available for the individual tests. This prevented us from running more detailed analyses, such as testing for ceiling and floor effects. Therefore, while the results reported here are generally consistent with the hypotheses that abilities themselves are differentially related according to general ability level, we cannot rule out the possibility that the nonlinear factor structure observed in these data resulted from poor properties of the measurement instruments employed. It is of note, however, that the pattern was consistent with that reported by Tucker-Drob (2009), which made use of item-response theory scoring of performance by an age-heterogeneous nationally representative sample (of the United States population) on carefully constructed measurement instruments.
A second limitation is that only one type of nonlinear function was considered—the quadratic function. The quadratic function was chosen for a number of reasons. First, it is the nonlinear function that is most easily implemented in structural equation modeling software, for which nonlinear functions are only beginning to be incorporated. Second, polynomial functions are well-known for being able to closely approximate many different functions within a bounded range. Third, the quadratic function is composed of a linear component and a nonlinear component, which allows for explicit testing of whether a nonlinear factor structure is advantageous above and beyond a linear factor structure. Fourth, the quadratic function is directly analogous to a linear-by-linear interaction, and can in fact be recast as the interaction of a variable with itself. It is therefore likely that for the purpose of removing bias in a linear-by-linear interaction, a quadratic term should be sufficient. Nevertheless, future research should consider the use of other sorts of nonlinear functions.
Conclusion
Here we used simulation to demonstrate that the gene-by-environment interaction can spuriously arise, or become obscured, when a linear psychometric model is incorrectly assumed. In an analysis of observed data, we relaxed the assumption of a linear factor structure, and were still able to detect a gene-by-environment interaction in the direction of general cognitive ability being more heritable in richer family environments. These findings suggests that previous work supportive of gene-by-environment interaction in the heritability of general cognitive ability is not artifactual. Nonetheless, our simulation results suggest that it is important to be prudent in scrutinizing linear assumptions at psychometric as well as biometric levels of analysis in future research.
Acknowledgments
A previous version of this paper was presented at the 2008 meeting of the Behavior Genetics Association in Louisville Kentucky. Elliot Tucker-Drob was supported by grant T32AG020500 from the National Institute on Aging, Paige Harden was supported by grant F31DA023751 from the National Institute on Drug Abuse, and Eric Turkheimer was supported by grant R01HD056354 from the National Institute on Child Health and Human Development.
Appendix 1: Analytical derivation of the consequences of unmodeled nonlinearity
The following derivation makes use of the same notation used in the path diagram depicted in Figure 1.
Let the true proportions of variance in the true (perfectly measured) phenotype (g) accounted for by genes, shared environment, and nonshared environment (the A, C, and E components) be represented by a2, c2, and e2, respectively. In reality, however, the phenotype is measured with some error, such that it represents both the true phenotype and error of measurement. The amount of variance in the measured phenotype that represents the true phenotype is represented as λ2, and the amount that represents error of measurement is . The intraclass correlation for the measured phenotype in twins reared together is therefore
| (A1) |
where Z is 1 for monozygotic twins and 0.5 for dizygotic twins.
One can then apply the familiar equations for the predicted proportional contributions of genes, shared environment, and nonshared environment (represented by â2, ĉ2, and ê2 respectively):
| (A2a) |
| (A2b) |
| (A2c) |
thereby producing
| (A3a) |
| (A3b) |
| (A3c) |
The above equations demonstrate how the estimated proportional contributions of genes and shared environment are attenuated, and the estimated proportional contributions of nonshared environment are exaggerated when the communality of the measured phenotype is less than perfect. Of interest in the current project is how these estimates may be affected when, in reality, the communality differs according to the level of the true phenotype, but this phenomenon is not modeled, and the estimated contributions of the ACE components are instead allowed to be conditional on a variable that is correlated with the phenotype.
Suppose that, although not modeled, the nonlinear factor model
| (A4) |
holds such that λ (the function’s derivative, Y′) is a linear function of the score on the factor, g,
| (A5) |
Substituting Eq. A5 into Eqs. A3a–A3c demonstrates how the predicted contributions of the ACE components artifactually differ according to the true score on the phenotype (g), or as a corollary, any variable that is correlated with the phenotype (e.g., SES).
| (A6a) |
| (A6b) |
| (A6c) |
The following R code can be used to plot predicted values â2; ĉ2; and ê2 as functions of SES, under various assumed true values of a2, c2, and e2, linear λ0 and quadratic λ1 components of the factor loading, unique variance , and the SES-phenotype relation.
a2 = .59
c2 = .11
e2 = .30
10 = 1
11 = −.2
su2 = .1
ses = (−100:100)/50
g = .6*ses
1 = 10 + 2*11*g
a2hat = ((1ˆ2)*(a2))/((1ˆ2)* (a2 + c2 + e2) + (su2))
c2hat = ((1ˆ2)*(c2))/((1ˆ2)* (a2 + c2 + e2) + (su2))
e2hat = ((1ˆ2)*(e2) + (su2))/((1ˆ2)* (a2 + c2 + e2) + (su2))
plot(ses,1/(1 + su2),ylim = c(.2,1), type = “l”)
plot(ses,a2hat,type = “1”, ylim = c(.1,.8), col = ‘red’)
lines(ses,c2hat,type = “1”, col = ‘dark blue’)
lines(ses,e2hat,type = “1”, col = ‘orange’)
Footnotes
Although SES is generally considered an index of environmental quality, it may also partially reflect genetic factors as a result of the gene-environment correlation that occurs when children are reared by their biological parents. While this possibility may have substantive implications, it does not appear to affect the empirical finding that heritability is higher at higher levels of SES (Loehlin et al. 2009).
The related age differentiation–dedifferentiation hypothesis states that during childhood development, diverse learning processes result in the weakening of interrelations among abilities, and that during adulthood global sources of decline result in the strengthening of interrelations among abilities. While there is consistent support for the ability differentiation hypothesis, evidence for the age differentiation–dedifferentiation hypothesis is much more mixed (compare, e.g., Li et al. 2004, to Tucker-Drob 2009; Tucker-Drob and Salthouse 2008). Because the data analyzed for the current study are from participants of the same approximate age (7 years), the age differentiation–dedifferentiation hypothesis is not examined here.
In more straightforward contexts, methodologists (e.g., Lubinski and Humphrys 1990; MacCallum and Mar 1995; also see Bauer 2005, for a treatment of this issue in multiple group factor analysis) have demonstrated how unmodeled nonlinear (quadratic) effects can be confused for interactions. MacCallum and Mar (1995), for example, explain that, with increasing correlation between two predictors, the products of the two predictors (i.e., the interaction term) is increasingly correlated with the product of a single predictor with itself (i.e., the quadratic term). Therefore, if the true regression model is quadratic but an interaction model is specified, the interaction term is likely to come out as significant.
In Simulation 1, 96% of the a1, 60% of the c1, and 98% of the e1 parameters were significantly different from 0 at P < 0.05. In Simulation 2, 92% of the a1, 44% of the c1, and 100% of the e1 parameters were significantly different from 0 at P < 0.05.
Although the differential age trends of fluid and crystallized abilities (see, e.g., McArdle et al. 2002) undermines the validity of a single common factor, this issue is not directly relevant to the current study, because all participants were 7 years old.
References
- Ackerman PL, Beier ME, Boyle MO. Working memory and intelligence: the same or different constructs? Psychol Bull. 2005;131:30–60. doi: 10.1037/0033-2909.131.1.30. [DOI] [PubMed] [Google Scholar]
- Anderson M. Intelligence and development: a cognitive theory. Blackwell; Oxford, England: 1992. [Google Scholar]
- Anderson M. Annotation: conceptions of intelligence. J Child Clin Psychol Psychiatry. 2001;42:287–298. [PubMed] [Google Scholar]
- Bauer DJ. The role of nonlinear factor-to-indicator relationships in tests of measurement equivalence. Psychol Methods. 2005;10:305–316. doi: 10.1037/1082-989X.10.3.305. [DOI] [PubMed] [Google Scholar]
- Bouchard TJ, Jr, McGue M. Genetic and environmental influences on human psychological differences. J Neurobiol. 2003;54:4–45. doi: 10.1002/neu.10160. [DOI] [PubMed] [Google Scholar]
- Bronfenbrenner U, Ceci SJ. Nature-nurture reconceptualized in developmental perspective: a bioecological model. Psychol Rev. 1994;101:568–586. doi: 10.1037/0033-295x.101.4.568. [DOI] [PubMed] [Google Scholar]
- Carroll JB. Human cognitive abilities: a survey of factor-analytic Studies. Cambridge University Press; New York: 1993. [Google Scholar]
- Detterman DK, Daniel MH. Correlations of mental tests with each other and with cognitive variables are highest for low-IQ groups. Intelligence. 1989;13:349–359. [Google Scholar]
- Eaves L, Erkanli A. Markov Chain Monte Carlo approaches to analysis of genetic and environmental components of human developmental change and G × E interaction. Behav Genet. 2003;33:279–299. doi: 10.1023/a:1023446524917. [DOI] [PubMed] [Google Scholar]
- Harden KP, Turkheimer E, Loehlin JC. Genotype-by-environment interaction in adolescents’ cognitive aptitude. Behav Genet. 2007;37:273–283. doi: 10.1007/s10519-006-9113-4. [DOI] [PMC free article] [PubMed] [Google Scholar]
- Klein A, Moosbrugger H. Maximum likelihood estimation of latent interaction effects with the LMS method. Psychometrika. 2000;65:457–474. [Google Scholar]
- Li S-C, Lindenberger U, Hommel B, Aschersleben G, Prinz W, Baltes PB. Transformations in the couplings among intellectual abilities and constituent cognitive processes across the life span. Psychol Sci. 2004;15:155–163. doi: 10.1111/j.0956-7976.2004.01503003.x. [DOI] [PubMed] [Google Scholar]
- Loehlin JC, Harden KP, Turkheimer E. The effects of assumptions about parental assortative mating and genotype-income correlation on estimates of genotype-environment interaction in the National Merit Twin Study. Behav Genet. 2009;39:165–169. doi: 10.1007/s10519-008-9253-9. [DOI] [PMC free article] [PubMed] [Google Scholar]
- Lubinski D, Humphreys LG. Assessing spurious “moderator effects”: Illustrated substantively with the hypothesized (“synergistic”) relation between spatial and mathematical ability. Psychol Bull. 1990;107:385–393. doi: 10.1037/0033-2909.107.3.385. [DOI] [PubMed] [Google Scholar]
- MacCallum RC, Mar CM. Distinguishing between moderator and quadratic effects in multiple regression. Psychol Bull. 1995;118:405–421. [Google Scholar]
- McArdle JJ, Ferrer-Caja E, Hamagami F, Woodcock RW. Comparative longitudinal multilevel structural analyses of the growth and decline of multiple intellectual abilities over the lifespan. Dev Psychol. 2002;38:115–142. [PubMed] [Google Scholar]
- Muthén B, Asparouhov T. Modeling interactions between latent and observed continuous variables using maximum-likelihood estimation in Mplus Version 1. 2003 Retrieved October 2008 from http://www.statmodel.com/mplus/examples/webnote.html.
- Muthén LK, Muthén BO. Mplus user’s guide. 5. Muthén & Muthén; Los Angeles, CA: 1998–2007. [Google Scholar]
- Neale MC. Modeling interaction and nonlinear effects with Mx: a general approach. In: Marcoulides G, Schumacker R, editors. Interaction and non-linear effects in structural equation modeling. Erlbaum; Hillsdale, NJ: 1998. pp. 43–61. [Google Scholar]
- Pearson K. On the inheritance of the mental and moral characters in man, and its comparison with the inheritance of the physical characters. J Anthropol Inst Great Britain Ireland. 1903;33:179–237. [Google Scholar]
- Petrill SA. Molarity versus modularity of cognitive functioning? A behavioral genetic perspective. Curr Dir Psychol Sci. 1997;6:96–99. [Google Scholar]
- Purcell S. Variance components models for gene–environment interaction in twin analysis. Twin Res. 2002;5:554–571. doi: 10.1375/136905202762342026. [DOI] [PubMed] [Google Scholar]
- Salthouse TA, Atkinson TM, Berish DE. Executive functioning as a potential mediator of age-related cognitive decline in normal adults. J Exp Psychol Gen. 2003;132:566–594. doi: 10.1037/0096-3445.132.4.566. [DOI] [PubMed] [Google Scholar]
- Spearman C. “General intelligence” objectively determined and measured. Am J Psychol. 1904;15:201–293. [Google Scholar]
- Tucker-Drob EM. Differentiation of cognitive abilities across the lifespan. Dev Psychol. 2009;45:1097–1118. doi: 10.1037/a0015864. [DOI] [PMC free article] [PubMed] [Google Scholar]
- Tucker-Drob EM, Salthouse TA. Adult age trends in the relations among cognitive abilities. Psychol Aging. 2008;23:453–460. doi: 10.1037/0882-7974.23.2.453. [DOI] [PMC free article] [PubMed] [Google Scholar]
- Tucker-Drob EM, Salthouse TA. Confirmatory factor analysis and multidimensional scaling for construct validation of cognitive abilities. Int J Behav Dev. 2009;33:277–285. doi: 10.1177/0165025409104489. [DOI] [PMC free article] [PubMed] [Google Scholar]
- Turkheimer E, Gottesman II. Individual differences and the canalization of human behavior. Dev Psychol. 1991;27:18–22. [Google Scholar]
- Turkheimer E, Haley A, Waldron M, D’Onofrio BM, Gottesman II. Socioeconomic status modifies heritability of IQ in young children. Psychol Sci. 2003;14:623–628. doi: 10.1046/j.0956-7976.2003.psci_1475.x. [DOI] [PubMed] [Google Scholar]
- Turkheimer E, Harden KP, D’Onofrio BM, Gottesman II. The Scarr–Rowe interaction between measured socioeconomic status and the heritability of cognitive ability. In: McCartney K, Weinberg R, editors. Experience and development: a festschrift in honor of Sandra Scarr. Taylor and Francis; London: in press. [Google Scholar]