

Abstract
Background
It is not known how the relationship between weight change and mortality is influenced by initial body mass index (BMI) or the magnitude of weight change.
Methods
We use the nationally representative Health and Retirement Study (n = 13,104; follow-up 1992–2006) and Cox regression analysis to estimate relative mortality risks for two-year weight change by initial BMI among 50-to-70-year-old Americans.
Results
For persons with BMI less than 32, weigh loss was associated with increased mortality. For example, the estimated hazard ratio (HR) after decrease of BMI from 30 to 27–29 was 1.19(confidence interval [CI] = 1.06–1.28), while a decrease to a BMI of 25–27 produced an estimated hazard ratio of 1.61(1.31–1.98). Small weight gains were not associated with excess mortality at any initial BMI level. Large weight gains were associated with excess mortality only if initial BMI was above 35 (eg, an incrase of BMI from 35 to 38–40 was accompanied by an estimated HR of 1.33 [1.00 – 1.77]). The weight loss-mortality association was robust to adjustments for health status and to sensitivity analyses considering unobserved confounders.
Conclusions
Weight loss is associated with excess mortality among normal, overweight, and mildly obese middle- and older-aged adults. The excess risk increases for larger losses and lower initial BMI. These results suggest that the potential benefits of a lower BMI may be offset by the negative effects associated with weight loss. Weight gain may be associated with excess mortality only among obese people with an initial BMI over 35.
Prior studies show that weight loss is associated with an increase in mortality despite adjustments for baseline health status,1–9 and that weight gain may be associated with decreased1,5,7,9–14 or increased mortality.4,6,15 It is not well understood how the effect of weight change depends on initial BMI, or on the magnitude of the change.
We build on prior work by studying the link between two-year weight change and mortality among adults aged 50–70 years. In contrast to previous work,3–5,8,10–12,14 we simultaneously examine two important modifiers of the weight change-mortality relationship. First, we examine how initial BMI modifies the effect of weight change. Because extreme levels of BMI carry a high mortality risk,16–20 we hypothesize that losses from higher BMI levels and gains from lower BMI levels might be more beneficial (or less harmful) than losses from lower levels or gains from higher levels. Second, we examine the influence of the magnitude of weight change. We account for potential confounders such as health status, smoking, and physical activity, and we study the sensitivity of our results to unobserved confounders.
While some prior work has addressed the influence of initial weight status or the magnitude of weight change, most studies have considered only one modifier at a time.3–5,8,10–12,14 Studies that simultaneously examine the influence of both modifiers have considered longer term weight change measured over decades,7,9,13 or have been potentially limited in statistical power.1,2,6 We contribute to the literature on short-term weight change and mortality by simultaneously examining the influence of initial BMI and magnitude of weight change in a large, nationally representative sample of middle- and older-aged adults.
METHODS
Participants
This is a prospective cohort study. We use the Health and Retirement Study, a nationally representative panel survey of Americans aged 50 and over and their spouses.21 This study has five entry cohorts, and we include persons who were 50–70 years old when entering the study. Our respondents are from the initial cohort (born in 1931–1941 and entering the study in 1992), the Children of Depression cohort (born in 1924–1930 and entering in 1998), and the War Babies cohort (born in 1942–1947 and entering in 1998). We exclude the Early Baby Boomers cohort because there is no follow-up after the weight change measurement. The Assets and Health Dynamics Among the Oldest Old cohort is excluded because the questionnaire is not fully consistent with those of other cohorts and the primary respondents were over age 70 when entering the study.
The total number of subjects is 14,823 before further exclusions (11,774 from the initial Health and Retirement Study cohort, 2259 from the War Babies cohort, and 790 from the Children of Depression cohort). We exclude 464 subjects because of item non-response; 2 subjects because they had died according to the National Death Index (the source for our death times) but were alive according to the Health and Retirement Study; 808 subjects because of attrition before the second interview (the point at which weight change is measured); and 445 subjects because their weight change was very large (more than 5 BMI units) and potentially more likely to be a product of underlying illness. The remaining sample size is 13,104 subjects (10,404 from the Health and Retirement Study cohort; 2010 from the War Babies cohort; 690 from the Children of Depression cohort), with 1983 deaths over an average follow-up of 9.7 years.
Variables
Initial weight status is measured as BMI (kg/m2) and constructed from self-reported weight and height at first interview. Weight change is measured in BMI units and is based on weight change between the first two interviews, which are approximately two years apart. We categorize weight change as large loss (3.0–5.0 BMI units), small loss (1.0–2.9 units), large gain (3.0–5.0 units) and small gain (1.0–2.9 units). The reference group (“stable weight”) is all those with weight change less than 1 BMI unit. For a person who is 5 foot 5 inches (1.65m) tall, “stable weight” is less than 6 pounds change (2.8kg), “small weight change” is 6.0–17.9 pounds (2.8–8.1kg), and large weight change is 18.0–30.0 pounds (8.2–13.6kg). Our results were not sensitive to small changes in the cutoff points for BMI change.
Measurement of survival time starts from the second interview; month and year of death are obtained from the National Death Index. There were no National Death Index records for 93 subjects who had died according to the Health and Retirement Study. For these subjects we estimate the death time to be in between the interview where the person was last seen alive and the next interview. The results were not sensitive to the exclusion of these subjects.
We control for both self-reported health conditions and self-rated health. The Health and Retirement Study has data on eight conditions based on responses to two types of questions: “Has a doctor ever told you that you have …” (first interview) and “Since we last talked to you, that is since [last interview date], has a doctor told you that you have …” (second interview). If the respondent had answered affirmatively in the first interview but denied having had the condition in the second interview, he or she was coded as not having had the condition for both interviews. For each of the eight conditions, we construct two indicator variables; one for having the condition at the first interview and another for having been diagnosed with the condition between the first two interviews.
We also adjust for initial self-rated health and changes in self-rated health during the weight-change period. Self-rated health is reported as excellent, very good, good, fair, or poor in both the first and second interviews. We code self-rated health to be a continuous variable with 5 = excellent and 1 = poor. Change in self-rated health (continuous) ranges from −4 (from excellent to poor) to +4 (from poor to excellent). Using categorical rather than continuous variables did not change our results.
Additional control variables are sex, age (years), cohort, race/ethnicity (non-Hispanic white, non-Hispanic black, Hispanic, other), education (years), household income, physical activity (indicator for 3+ times vigorous activity/week), and smoking (never/former/current).
Statistical models
We use four proportional hazard models to estimate the effects of weight change on mortality: Model 1a estimates the main effect of weight change and adjusts for demographic and behavioral variables. Model 1b extends the Model 1a by adjusting for health status. Model 2a extends the Model 1a by including an interaction between weight change and initial BMI. This model adjusts for the same variables as Model 1a. Model 2b, our main model, extends the Model 2a by adjusting for health status variables. While health status may confound the association between weight change and mortality, it may also function as an intermediate in the causal pathway between weight change and mortality. Hence, we show the results for models both with and without adjustments for health status variables.
The model equations are:
| (1a) |
| (1b) |
| (2a) |
| (2b) |
where WeightChange is a vector of weight change indicators (large weight loss, small weight loss, large weight gain, small weight gain); InitBMI is continuous initial BMI and squared initial BMI; ChangeInit is the interaction between weight change and initial BMI; D is for demographic and behavioral variables (age, age squared, sex, race/ethnicity, education, household income, HRS cohort, smoking, physical activity); and H is for health variables (pre-existing conditions and conditions diagnosed during the weight change period, self-rated health at the first interview and changes in self-rated health during the weight change period). Using these models we estimated hazard ratios (HRs) and 95% confidence intervals (CIs).
The weight change-initial BMI interaction is constructed from categorical weight change and continuous initial BMI. We do not use squared BMI in the interaction because preliminary analyses suggested that the effect of weight change depends linearly on initial BMI; interactions with higher order terms of initial BMI were not statistically significant; and our results were insensitive to the inclusion of the squared BMI in the interaction. We do, however, include squared BMI as a control variable in order to capture the non-linear main effect of initial BMI on mortality.17–19,22,23
Models 1a and 1b omit the weight change-initial BMI interaction, so the effect of weight change on mortality hazard ratio is estimated as exp(β1) for all initial BMI levels. For Models 2a and 2b, the effect at a given initial BMI level is , where β1 and β12 are the main effect of weight change and the weight change-initial BMI interaction, respectively. We estimate the effects of weight change for initial BMI levels ranging from 18.0 to 40.0.
We use time-on-study for time scale and adjust for age and age squared; this approach performed well in a study comparing six different choices of time scale in cohort studies.24 We estimate the model parameters by maximizing the partial likelihood with the Newton-Raphson algorithm. We handle ties with the approximate likelihood method,25 and account for the clustering of subjects within households by using the robust variance-covariance estimator.26 Please see the eAppendix (http://links.lww.com) for further details on the data and methods.
RESULTS
Descriptive analyses
Of the 13,104 respondents, 15% died during follow-up (Table 1). Univariate statistics suggest that stable weight persons have a lower mortality risk than all weight change categories except the small-weight-gain category. The proportion deceased was lowest in the small-weight-gain category (13%) and highest in the large-weight-loss category (24%). Mean follow-up for those who died was on average 6.1 years, and was shortest (5.2 years) in the large-weight-loss category. Mean age was 56.9 years at the first interview; 50% of the sample were women; and 74% were non-Hispanic white.
Table 1.
Baseline Demographic Characteristics in the Whole Sample and Within Two-Year Weight Change Categories.a
| Total (n = 13,104) | Stable Weight (n = 7,669) | Large weight loss (n = 469) | Small weight loss (n = 1,874) | Large weight gain (n = 514) | Small weight gain (n = 2,578) | |
|---|---|---|---|---|---|---|
| Died; % | 15 | 14 | 24 | 20 | 18 | 13 |
| Follow-up duration (years); mean (SD) | ||||||
| For those who died | 6.1 (3.3) | 6.1 (3.3) | 5.2 (3.5) | 6.2 (3.3) | 5.6 (3.3) | 6.3 (3.2) |
| For those who were censored | 10.3 (2.8) | 10.3 (2.8) | 10.1 (2.9) | 10.5 (2.6) | 10.3 (2.9) | 10.3 (2.8) |
| Years between two first interviews; mean (SD) | 1.9 (0.2) | 1.9 (2.2) | 1.9 (0.2) | 1.9 (0.2) | 1.9 (0.2) | 1.9 (0.2) |
| Age at first interview (years); mean (SD) | 56.9 (4.9) | 57.1 (5.0) | 57.2 (5.1) | 57.0 (4.9) | 56.0 (4.3) | 56.6 (4.6) |
| Women; % | 50 | 49 | 59 | 51 | 61 | 52 |
| Race/Ethnicity; % | ||||||
| Non-Hispanic white | 74 | 76 | 65 | 71 | 68 | 74 |
| Non-Hispanic black | 15 | 14 | 22 | 18 | 20 | 16 |
| Hispanic | 8 | 8 | 12 | 9 | 10 | 9 |
| Other | 2 | 2 | 2 | 3 | 2 | 2 |
| Education (years); mean (SD) | 12.3 (3.2) | 12.5 (3.1) | 11.2 (3.7) | 12.0 (3.3) | 11.5 (3.5) | 12.1 (3.2) |
| Household Income, $1,000; mean (SD) | 52.3 (68.3) | 55.6 (77.7) | 43.2 (48.0) | 47.7 (54.5) | 42.7 (44.9) | 49.6 (51.6) |
Stable weight: change < 1 BMI units; large weight loss and weight gain: change 3–5 BMI units; small weight loss and weight gain: change 1–2.9 BMI units
Table 2 shows health characteristics of the whole sample and within the weight change categories. In the whole sample 33% were normal weight (BMI 18.5–24.9) at baseline; 42% were overweight (BMI 25–29.9) and 24% obese (BMI ≥ 30). The proportion obese was largest in the large-weight-loss category (57%) and smallest in the stable-weight category (18%). Average self-rated health at first interview was 3.4 (between good [3] and very good [4]). Self-rated health was lowest in the large-weight-loss and highest in the stable-weight categories. At first interview, 37% of respondents were free of pre-existing conditions. During the weight-change period, 17% were diagnosed with a new medical condition. Relative to the stable-weight group, the weight-change groups tended to have both higher prevalence and incidence of conditions. Table 2 also shows that people experiencing weight changes are less healthy and are more likely to be obese than those with stable weight, highlighting the importance of adjusting for both health status and initial BMI.
Table 2.
Baseline Health Characteristics in the Whole Sample and Within Two-Year Weight Change Categories.a
| Overall (n = 13,104) | Stable weight (n = 7,669) | Large weight loss (n = 469) | Small weight loss (n = 1,874) | Large weight gain (n = 514) | Small weight gain (n = 2,578) | |
|---|---|---|---|---|---|---|
| Initial BMI distribution; % | ||||||
| <18.5 | 1 | 1 | <1 | 1 | 2 | 2 |
| 18.5–24.9 | 33 | 38 | 10 | 21 | 26 | 34 |
| 25.0–29.9 | 42 | 43 | 33 | 43 | 38 | 41 |
| 30.0–39.9 | 22 | 17 | 50 | 32 | 29 | 21 |
| >=40 | 2 | 1 | 7 | 3 | 5 | 2 |
| Current smoker; % | 29 | 28 | 29 | 34 | 34 | 27 |
| Previous smoker; % | 34 | 35 | 31 | 33 | 31 | 35 |
| Physical activity 3+times/week; % | 26 | 27 | 18 | 24 | 20 | 24 |
| Self-rated healthb; mean (SD) | 3.4(1.2) | 3.5(1.2) | 2.9(1.2) | 3.2(1.2) | 3.1(1.2) | 3.4(1.2) |
| Change in self-rated healthc; mean (SD) | −0.1(0.9) | −0.1(0.9) | −0.1(1.1) | −0.0(1.0) | −0.1(1.0) | −0.1(0.9) |
| Conditions diagnosed before entering the study; % | ||||||
| High blood pressure or hypertension | 34 | 32 | 43 | 39 | 42 | 35 |
| Diabetes or high blood sugar | 10 | 8 | 18 | 13 | 11 | 9 |
| Cancer or a malignant tumor, not skin cancer | 5 | 5 | 7 | 5 | 7 | 5 |
| Chronic lung disease except asthma | 5 | 4 | 7 | 6 | 6 | 4 |
| Heart attack, CHD, other heart problem | 11 | 10 | 17 | 12 | 13 | 11 |
| Stroke, transient ischemic attack | 3 | 2 | 6 | 3 | 5 | 3 |
| Emotional, nervous, or psychiatric problems | 7 | 6 | 11 | 8 | 12 | 8 |
| Arthritis or rheumatism | 34 | 33 | 43 | 37 | 37 | 35 |
| No pre-existing conditions | 37 | 39 | 29 | 31 | 32 | 35 |
| Conditions diagnosed during the weight change period, % | ||||||
| High blood pressure or hypertension | 4 | 4 | 6 | 4 | 5 | 3 |
| Diabetes or high blood sugar | 2 | 1 | 5 | 3 | 2 | 1 |
| Cancer or a malignant tumor, not skin cancer | 1 | 1 | 4 | 2 | 1 | 1 |
| Chronic lung disease except asthma | 1 | 1 | 2 | 1 | 3 | 2 |
| Heart attack, CHD, other heart problem | 2 | 2 | 5 | 3 | 3 | 2 |
| Stroke, transient ischemic attack | 1 | 1 | 1 | 1 | 1 | 1 |
| Emotional, nervous, or psychiatric problems | 2 | 2 | 4 | 2 | 2 | 2 |
| Arthritis or rheumatism | 6 | 6 | 6 | 7 | 10 | 7 |
| Any new condition | 17 | 15 | 26 | 20 | 23 | 17 |
Stable weight: change < 1 BMI units; large weight loss and weight gain: change 3–5 BMI units; small weight loss and weight gain: change 1–2.9 BMI units
Measured on a scale from 5 (excellent) to 1 (poor)
Measured on a scale from −4 (from excellent to poor) to +4 (from poor to excellent)
CHD indicates coronary heart disease
Regression analyses
Next we consider multivariate analyses where relative mortality hazards for weight change are estimated while controlling for demographic, behavioral and health characteristics. Table 3 shows the estimated relative hazards for weight change for the four models. Models 1a and 1b estimate the main effect of weight change averaged across all BMI levels, while Models 2a and 2b (which include an interaction between weight change and initial BMI) estimate the effect of weight change at different levels of initial BMI. The reference group is always stable weight. For example, the hazard ratio of 3.55 in Model 2b for large weight loss and initial BMI of 18.5 means that, given initial BMI of 18.5, those who experienced a large weight loss had 3.55 times higher risk of death than those with stable weight
Table 3.
Effect of Weight Change on Mortality Hazard Ratio a and 95% Confidence Interval by Model, Initial Body Mass Index (BMI) and Two-Year Weight Change Category. Sample size: 13,104 subjects with 1,983 deaths.
| Stable (change < 1 BMI units)b | Large weight loss (3–5 BMI units) | Small weight loss (1–2.9 BMI units) | Large weight gain (3–5 BMI units) | Small weight gain (1–2.9 BMI units) | |
|---|---|---|---|---|---|
| HR | HR (95% CI) | HR (95% CI) | HR (95% CI) | HR (95% CI) | |
| Model 1a c | 1.00 | 1.83 (1.48–2.28) | 1.34 (1.19–1.51) | 1.34 (1.08–1.65) | 0.95 (0.84–1.07) |
| Model 1b d | 1.00 | 1.59 (1.29–1.97) | 1.20 (1.07–1.36) | 1.12 (0.89–1.40) | 0.90 (0.79–1.02) |
| Model 2a e | |||||
| Initial BMI | |||||
| 18.5 | 1.00 | 5.50 (3.50–8.64) | 1.52 (1.21–1.93) | 1.14 (0.78–1.65) | 1.07 (0.86–1.33) |
| 20 | 1.00 | 4.78 (3.19–7.14) | 1.49 (1.21–1.83) | 1.16 (0.83–1.63) | 1.04 (0.86–1.27) |
| 25 | 1.00 | 2.99 (2.31–3.86) | 1.38 (1.21–1.58) | 1.24 (0.97–1.58) | 0.97 (0.85–1.11) |
| 30 | 1.00 | 1.87 (1.52–2.30) | 1.28 (1.13–1.46) | 1.33 (1.07–1.65) | 0.90 (0.79–1.04) |
| 35 | 1.00 | 1.17 (0.86–1.59) | 1.19 (0.98–1.45) | 1.42 (1.08–1.87) | 0.84 (0.68–1.04) |
| 40 | 1.00 | 0.73 (0.46–1.16) | 1.10 (0.83–1.47) | 1.52 (1.04–2.22) | 0.78 (0.57–1.07) |
| Model 2b f | |||||
| Initial BMI | |||||
| 18.5 | 1.00 | 3.55 (2.23–5.66) | 1.35 (1.07–1.70) | 0.83 (0.56–1.24) | 0.95 (0.76–1.18) |
| 20 | 1.00 | 3.20 (2.12–4.85) | 1.32 (1.13–1.47) | 0.87 (0.61–1.24) | 0.94 (0.77–1.14) |
| 25 | 1.00 | 2.27 (1.75–2.95) | 1.25 (1.13–1.35) | 1.00 (0.78–1.29) | 0.91 (0.80–1.04) |
| 30 | 1.00 | 1.61 (1.31–1.98) | 1.19 (1.06–1.28) | 1.15 (0.93–1.43) | 0.88 (0.77–1.02) |
| 35 | 1.00 | 1.14 (0.84–1.55) | 1.12 (0.95–1.25) | 1.33 (1.00–1.77) | 0.85 (0.69–1.06) |
| 40 | 1.00 | 0.81 (0.50–1.30) | 1.06 (0.88–1.19) | 1.53 (1.03–2.29) | 0.83 (0.61–1.13) |
For Models 1a and 1b, which do not include the interaction between weight change and initial BMI, the effect is estimated as exp(b1), where b1 is the main effect for BMI change. For Models 2a and 2b, the effect is estimated as exp(b1+b2 × BMI), where b1 is the main effect for BMI change and b2 is the estimated coefficient for the product interaction term between initial BMI and weight change.
Reference category
Model 1a: Controls for BMI, BMI squared, sex, age, age squared, race/ethnicity, cohort, education, household income, physical activity and smoking. The effect is constant across initial BMI because there is no weight change–initial BMI interaction.
Model 1b: Extends Model 1a by adding controls for pre-existing conditions, changes in diagnosed conditions, initial self-rated health and changes in self-rated health.
Model 2a: Controls for BMI, BMI squared, sex, age, age squared, race/ethnicity, cohort, education, household income, physical activity, and smoking. The P-value for the weight change-initial BMI product interaction term is less than 0.001.
Model 2b: Extends Model 2a by adding controls for pre-existing conditions, changes in diagnosed conditions, initial self-rated health and changes in self-rated health. The P-value for the weight change-initial BMI product interaction term is 0.004.
In Model 1a (not controlling for health status) large and small weight losses are associated with increased mortality. In Model 1b, where we control for health status, weight loss continues to be associated with increased mortality, though the magnitude of the effect decreases (from 1.83 to 1.59 for large weight loss, and from 1.34 to 1.20 for small weight loss). Large weight gain is also associated with excess mortality in Model 1a with estimated hazard ratio 1.34, but in Model 1b the estimate falls to 1.12. Small weight gains are not associated with mortality in either of the models.
Models 2a and 2b add weight change-initial BMI interactions to Models 1a and 1b. Model 2a, which does not control for health status, shows that the effect of weight loss on mortality is attenuated by initial BMI: the higher the initial BMI, the smaller the effect. For example, the effect of large weight loss is 2.99 at an initial BMI 25 but decreases to 1.17 at an initial BMI 35. In contrast, the effect of large weight gain is magnified by initial BMI; the higher the initial BMI, the larger the effect. Small weight gains are not associated with mortality.
Model 2b, whose results are also illustrated in the Figure, extends Model 2a by adding controls for health status. Controlling for health decreases the magnitude of the weight loss effects, but the overall pattern does not change. Both large and small weight losses continue to be strongly associated with excess mortality for initial BMI levels below 30. The association thus weakens as initial BMI increases and disappears in the BMI range of 30–35, the exact thresholds being 33 for large weight loss and 32 for small weight loss (see Figure). Large weight gains are estimated to increase mortality if initial BMI is over 35, and small weight gains continue to be not associated with mortality for any initial BMI level.
Figure.
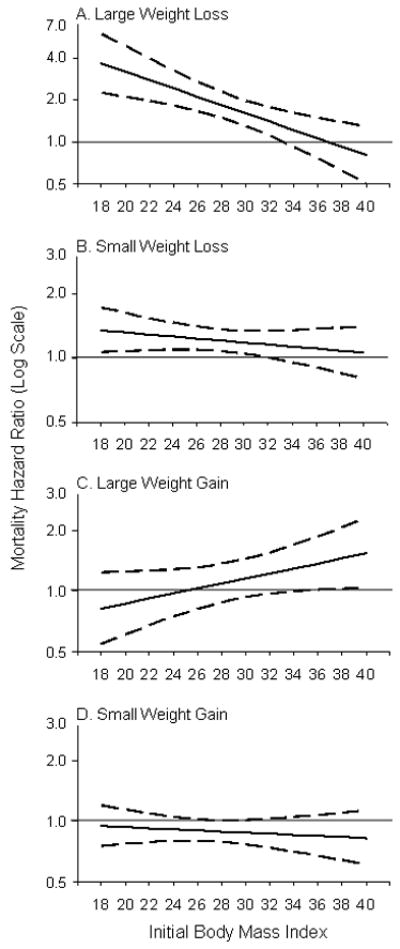
Mortality Hazard Ratio (Log Scale; solid line) and 95 % Confidence Interval (dashed line) for Two-Year Weight Change by Initial Body Mass Index (Model 2b). Reference Group Stable Weight (Change < 1 BMI Units). Large weight gain or loss refers to 3–5 BMI units; small weight gain or loss refers to 1–2.9 BMI units. Note that the scale of the vertical axis in figure part A is different from the other figure components.
In summary, both large and small weight losses are associated with increased mortality, even among those who were overweight or mildly obese at baseline. Overall, the larger the loss and the lower the initial BMI, the larger the effect. Large weight gains are not associated with increased mortality unless baseline weight is in the range of Class II obesity or higher (BMI >35). Small weight gains are not associated with increased mortality at any level of initial BMI.
Sensitivity analyses
We study the robustness of our main results on weight loss (Model 2b) to unobserved confounders using the method of external adjustment.27 While we control for observed health status, our findings could still be confounded by unobserved differences in health status. We consider the possibility of a confounder with a prevalence in the weight-change categories ranging from 0.0 to 0.6, an effect on the HR of 1.5, 2.0 or 2.5, and with a prevalence 50% higher in the weight-change categories than in the stable-weight group.
Table 4 shows the confounder-adjusted hazard ratios for weight loss, calculated for initial BMIs of 25 and 30. For large weight loss, the magnitude of the effect stays large at both levels of intial BMI (>1.90 for initial BMI 25, >1.35 for initial BMI 30) and the effects are precisely estimated at all confounder combinations. Small weight losses remain associated with increased mortality for initial BMI levels 25 and 30 unless both the effect of the confounder on mortality and the confounder prevalence are high (2.0–2.5 and 0.4–0.6, respectively). The existence of such a powerful confounder—one which is not among the diagnosed conditions, affects approximately half of those who are losing weight, and doubles the mortality risk—seems unlikely.
We also studied the sensitivity of our results by estimating the Model 2b after excluding those with pre-existing conditions; those in fair or poor health at baseline; previous and current smokers; and those who died within one, two, or three years of follow-up. The results (shown in the eAppendix; http://links.lww.com) did not change in any meaningful fashion.
DISCUSSION
Short-term weight change, compared with stable weight, is a risk factor for mortality among older Americans. The direction and magnitude of risk, however, depends on the direction and magnitude of the change itself, as well as on the initial BMI. In this study, weight loss was associated with increased mortality among normal and overweight people, as well as mildly obese people up to a BMI of ~32–33, which includes the lower range of class I obesity (30–34.9). These findings suggest that weight loss itself, or the practices used to lose weight, may be harmful even if one is overweight or mildly obese. Large weight gains may also be associated with increased mortality, although only among people who have already reached Class II obesity or above (BMI > 35). Lastly, we found no evidence that small weight gains change mortality risk at any level of initial BMI.
To minimize confounding from unintentional weight loss due to illness, we controlled for diagnosed conditions and self-rated health before weight change, as well as changes in these factors during the weight change period. We also conducted sensitivity analyses excluding those with pre-existing conditions, poor health at baseline, smokers, and those who died within a short period from the start of the follow-up. The observed weight loss-mortality association could still, however, be due to undiagnosed conditions. Hazard ratio estimates adjusted for unobserved confounding suggest that in order to dissipate the weight loss effects, the unmeasured confounder would need to have both high prevalence and a very large effect on mortality. Existence of such an unknown confounder seems unlikely.
To summarize, large and small weight losses (compared with having a stable weight) are indicators of increased mortality among 50–70 year old people who were normal, overweight, or mildly obese at baseline. Weight gain, on the other hand, may also be associated with excess mortality, but only among people who are already obese and if the change is large. The observed interaction between weight loss and initial BMI may partly explain the discrepant findings in previous studies on the magnitude of the effects of weight loss on mortality,1–15 as the magnitude of the effect observed in any given study may strongly depend on the baseline BMI distribution of the study subjects.
The modifying effect of initial BMI in the weight loss-mortality association may be due to differential balancing of the benefits of a lower weight status and harmful effects associated with weight loss or weight loss practices. It is well-known that many weight loss methods such as smoking, fasting, and diet drugs can have harmful effects. Prior studies have shown that among middle-aged and older people, overweight is not associated with excess mortality.16,20,28–30 Recent literature also suggests that obese class I (BMI 30–35) may not be associated with increased mortality, compared with normal weight.16,17,20 Hence, we would not necessarily expect people losing weight from initial BMI levels between 25 and 35 to benefit in terms of mortality, and if weight loss practices are unhealthy, one might expect increases in mortality. Among older people, only obesity levels over BMI 35 are consistently associated with increased mortality. Thus, losing weight from these high levels could potentially result in no effect or a decrease in mortality. For normal weight people, weight loss may increase mortality as BMI approaches underweight levels, which are known to be associated with higher mortality.16,17,20
The above reasoning also applies when interpreting the finding that weight gains may be associated with increased mortality only if initial BMI is well into the obese range: if having a BMI between 25 and 35 is not associated with excess mortality when compared with normal weight, gaining weight from an initial BMI level of 25–30 may not be associated with excess mortality. If initial BMI is close to the range where BMI is positively associated with mortality (BMI ~35), then gaining weight may increase mortality risk.
As noted above, we conducted several sensitivity analyses suggesting that undiagnosed conditions are unlikely to be responsible for the whole weight loss-mortality association. It is nevertheless possible that such conditions may be responsible for a part of the effect. Moreover, in cases where death and weight loss are both being driven by underlying illness, the modifying effect of initial BMI in the weight loss-mortality association would support the “obesity paradox” hypothesis,31 indicating that when such conditions occur, being obese may be protective.
This study has limitations. First, BMI was constructed from self-reported height and weight. Self-reported and clinically measured height and weight are known to be highly correlated,32 and the correlation for weight may be as high as 0.98 among older persons because of diminished cultural pressures to be thin.33,34 Second, the data did not allow us to study causes of death. As recent research has shown that the BMI-mortality association varies by cause of death,35 the effect of weight change may also vary by cause of death. Prior research has found that weight loss may be associated with increased cardiovascular and coronary heart disease mortality1,14,36 and non-cancer mortality,4 but with decreased diabetes-related mortality.15 In a recent study on long term weight loss from age 20, the effect of weight loss on mortality was mainly driven by causes other than cancer and cardiovascular disease, but the “other causes” category was not further explored.9 Further research could consider more detailed cause-specific mortality. Third, we did not have direct information on whether weight losses were intentional or unintentional. We did, however, include extensive controls for underlying health conditions, as well as changes in these conditions, to adjust for sources of unintentional weight loss. Indeed, to the extent that changes in health status are a product of weight loss and on the causal pathway between weight loss and death, these controls may constitute an “over-adjustment,” lending a conservative bias to our estimates. Lastly, our results were also robust to several different sensitivity analyses designed to address the issue of confounding from underlying illness.
Despite these limitations, our findings have important implications. We found weight loss to be associated with increased mortality among both overweight and obese persons up to a BMI ~32. If weight loss from these BMI levels is potentially harmful, public health policy should focus on prevention rather than “treatment” of overweight and obesity. In the U.S., 62% of those who considered themselves somewhat overweight and 52% of those who considered themselves a little overweight reported that they were trying to lose weight.37 Even small weight losses were associated with increased mortality, and patients, especially those who are not obese, should be educated on the potentially harmful effects of weight loss from unhealthy diets or other weight-loss behaviors. More research is needed on the health effects of various weight loss strategies (dieting, exercise, eating disorder behavior) used by the general population; simply knowing whether the loss is intentional may not be enough.
While our results failed to show overall benefits to mortality from weight loss, this is not inconsistent with research showing that weight loss decreases cardiovascular risk factors such as hypertension and hyperlipidemia,38,39 and that weight loss may be associated with decreased mortality in certain sub-populations, such as overweight diabetics.5,15 We find, however, no evidence that in the general population aged 50–70 weight loss, when compared to having a stable weight, would decrease mortality for overweight persons or mildly obese persons with BMI up to about 32. Among the morbidly obese, large weight loss achieved by bariatric surgery has been shown to decrease mortality.40 This is in line with our estimate of 0.81 (95% CI = 0.50–1.30) for the hazard ratio for large weight loss from an initial BMI of 40.
In summary, our findings suggest that for older persons, weight loss is not associated with a decrease in all-cause mortality and may even be associated with increased mortality among normal, overweight, and mildy obese people. Weight gains, large and small, on the other hand, seem to be harmless among normal and overweight people, and potentially harmful only among those who are well into the obese range. Given the only a small proportion of the older people is obese and gaining weight, and a relatively large proportion is losing weight from the normal or overweight range, weight losses might warrant more attention than weight gains.
Supplementary Material
Acknowledgments
Funding: K12-HD043459 from the National Institute of Child Health and Human Development (VWC).
We thank Samuel Preston, Irma Elo, Douglas McKee, Neil Mehta, Allison Sullivan, and three reviewers for their helpful comments and suggestions.
References
- 1.Yaari S, Goldbourt U. Voluntary and involuntary weight loss: associations with long term mortality in 9,228 middle-aged and elderly men. Am J Epidemiol. 1998;148(6):546–555. doi: 10.1093/oxfordjournals.aje.a009680. [DOI] [PubMed] [Google Scholar]
- 2.Mikkelsen KL, Heitmann BL, Keiding N, Sorensen TI. Independent effects of stable and changing body weight on total mortality. Epidemiology. 1999;10(6):671–678. [PubMed] [Google Scholar]
- 3.Dey DK, Rothenberg E, Sundh V, Bosaeus I, Steen B. Body mass index, weight change and mortality in the elderly. A 15 y longitudinal population study of 70 y olds. Eur J Clin Nutr. 2001;55(6):482–492. doi: 10.1038/sj.ejcn.1601208. [DOI] [PubMed] [Google Scholar]
- 4.Nilsson PM, Nilsson JA, Hedblad B, Berglund G, Lindgarde F. The enigma of increased non-cancer mortality after weight loss in healthy men who are overweight or obese. J Intern Med. 2002;252(1):70–78. doi: 10.1046/j.1365-2796.2002.01010.x. [DOI] [PubMed] [Google Scholar]
- 5.Gregg EW, Gerzoff RB, Thompson TJ, Williamson DF. Trying to lose weight, losing weight, and 9-year mortality in overweight U.S. adults with diabetes. Diabetes Care. 2004;27(3):657–662. doi: 10.2337/diacare.27.3.657. [DOI] [PubMed] [Google Scholar]
- 6.Sorensen TI, Rissanen A, Korkeila M, Kaprio J. Intention to lose weight, weight changes, and 18-y mortality in overweight individuals without co-morbidities. PLoS Med. 2005;2(6):e171. doi: 10.1371/journal.pmed.0020171. [DOI] [PMC free article] [PubMed] [Google Scholar]
- 7.Corrada MM, Kawas CH, Mozaffar F, Paganini-Hill A. Association of body mass index and weight change with all-cause mortality in the elderly. Am J Epidemiol. 2006;163(10):938–949. doi: 10.1093/aje/kwj114. [DOI] [PMC free article] [PubMed] [Google Scholar]
- 8.Rzehak P, Meisinger C, Woelke G, Brasche S, Strube G, Heinrich J. Weight change, weight cycling and mortality in the ERFORT Male Cohort Study. Eur J Epidemiol. 2007;22(10):665–673. doi: 10.1007/s10654-007-9167-5. [DOI] [PubMed] [Google Scholar]
- 9.Saito I, Konishi M, Iso H, Inoue M, Tsugane S. Impact of weight change on specific-cause mortality among middle-aged Japanese individuals. J Epidemiol Community Health. 2009;63(6):447–454. doi: 10.1136/jech.2008.082065. [DOI] [PubMed] [Google Scholar]
- 10.Gregg EW, Gerzoff RB, Thompson TJ, Williamson DF. Intentional weight loss and death in overweight and obese U.S. adults 35 years of age and older. Ann Intern Med. 2003;138(5):383–389. doi: 10.7326/0003-4819-138-5-200303040-00007. [DOI] [PubMed] [Google Scholar]
- 11.Wannamethee SG, Shaper AG, Lennon L. Reasons for intentional weight loss, unintentional weight loss, and mortality in older men. Arch Intern Med. 2005;165(9):1035–1040. doi: 10.1001/archinte.165.9.1035. [DOI] [PubMed] [Google Scholar]
- 12.Wannamethee SG, Shaper AG, Walker M. Weight change, body weight and mortality: the impact of smoking and ill health. Int J Epidemiol. 2001;30(4):777–786. doi: 10.1093/ije/30.4.777. [DOI] [PubMed] [Google Scholar]
- 13.Elliott AM, Aucott LS, Hannaford PC, Smith WC. Weight change in adult life and health outcomes. Obes Res. 2005;13(10):1784–1792. doi: 10.1038/oby.2005.217. [DOI] [PubMed] [Google Scholar]
- 14.Wannamethee SG, Shaper AG, Walker M. Weight change, weight fluctuation, and mortality. Arch Intern Med. 2002;162(22):2575–2580. doi: 10.1001/archinte.162.22.2575. [DOI] [PubMed] [Google Scholar]
- 15.Williamson DF, Thompson TJ, Thun M, Flanders D, Pamuk E, Byers T. Intentional weight loss and mortality among overweight individuals with diabetes. Diabetes Care. 2000;23(10):1499–1504. doi: 10.2337/diacare.23.10.1499. [DOI] [PubMed] [Google Scholar]
- 16.Flegal KM, Graubard BI, Williamson DF, Gail MH. Excess deaths associated with underweight, overweight, and obesity. JAMA. 2005;293(15):1861–1867. doi: 10.1001/jama.293.15.1861. [DOI] [PubMed] [Google Scholar]
- 17.Gronniger JT. A semiparametric analysis of the relationship of body mass index to mortality. Am J Public Health. 2006;96(1):173–178. doi: 10.2105/AJPH.2004.045823. [DOI] [PMC free article] [PubMed] [Google Scholar]
- 18.Lee IM, Manson JE, Hennekens CH, Paffenbarger RS., Jr Body weight and mortality. A 27-year follow-up of middle-aged men. JAMA. 1993;270(23):2823–2828. doi: 10.1001/jama.270.23.2823. [DOI] [PubMed] [Google Scholar]
- 19.Calle EE, Thun MJ, Petrelli JM, Rodriguez C, Heath CW., Jr Body-mass index and mortality in a prospective cohort of U.S. adults. N Engl J Med. 1999;341(15):1097–1105. doi: 10.1056/NEJM199910073411501. [DOI] [PubMed] [Google Scholar]
- 20.Mehta NK, Chang VW. Mortality Attributable to Obesity Among Middle-Aged Adults in the United States. Demography. doi: 10.1353/dem.0.0077. Forthcoming. [DOI] [PMC free article] [PubMed] [Google Scholar]
- 21.Health and Retirement Study public use dataset. Produced and distributed by the University of Michigan with funding from the National Institute on Aging (grant number NIA U01AG009740) Ann Arbor, MI: 2008. [Google Scholar]
- 22.Drenick EJ, Bale GS, Seltzer F, Johnson DG. Excessive mortality and causes of death in morbidly obese men. JAMA. 1980;243(5):443–445. [PubMed] [Google Scholar]
- 23.Adams KF, Schatzkin A, Harris TB, Kipnis V, Mouw T, Ballard-Barbash R, Hollenbeck A, Leitzmann MF. Overweight, obesity, and mortality in a large prospective cohort of persons 50 to 71 years old. N Engl J Med. 2006;355(8):763–778. doi: 10.1056/NEJMoa055643. [DOI] [PubMed] [Google Scholar]
- 24.Pencina MJ, Larson MG, D’Agostino RB. Choice of time scale and its effect on significance of predictors in longitudinal studies. Stat Med. 2007;26(6):1343–1359. doi: 10.1002/sim.2699. [DOI] [PubMed] [Google Scholar]
- 25.Efron B. The efficiency of Cox’s likelihood function for censored data. J Am Stat Assoc. 1977;72(359):557–565. [Google Scholar]
- 26.Lin DY, Wei LJ. The robust inference for the proportional hazards model. J Am Stat Assoc. 1989;84(408):1074–1078. [Google Scholar]
- 27.Lin DY, Psaty BM, Kronmal RA. Assessing the sensitivity of regression results to unmeasured confounders in observational studies. Biometrics. 1998;54(3):948–963. [PubMed] [Google Scholar]
- 28.Haapanen-Niemi N, Miilunpalo S, Pasanen M, Vuori I, Oja P, Malmberg J. Body mass index, physical inactivity and low level of physical fitness as determinants of all-cause and cardiovascular disease mortality--16 y follow-up of middle-aged and elderly men and women. Int J Obes Relat Metab Disord. 2000;24(11):1465–1474. doi: 10.1038/sj.ijo.0801426. [DOI] [PubMed] [Google Scholar]
- 29.Strawbridge WJ, Wallhagen MI, Shema SJ. New NHLBI clinical guidelines for obesity and overweight: will they promote health? Am J Public Health. 2000;90(3):340–343. doi: 10.2105/ajph.90.3.340. [DOI] [PMC free article] [PubMed] [Google Scholar]
- 30.Farrell SW, Braun L, Barlow CE, Cheng YJ, Blair SN. The relation of body mass index, cardiorespiratory fitness, and all-cause mortality in women. Obes Res. 2002;10(6):417–423. doi: 10.1038/oby.2002.58. [DOI] [PubMed] [Google Scholar]
- 31.Gruberg L, Weissman NJ, Waksman R, Fuchs S, Deible R, Pinnow EE, Ahmed LM, Kent KM, Pichard AD, Suddath WO, Satler LF, Lindsay J., Jr The impact of obesity on the short-term and long-term outcomes after percutaneous coronary intervention: the obesity paradox? J Am Coll Cardiol. 2002;39(4):578–584. doi: 10.1016/s0735-1097(01)01802-2. [DOI] [PubMed] [Google Scholar]
- 32.Willett WC. Monographs in epidemiology and biostatistics. 2. Vol. 30. New York: Oxford University Press; 1998. Nutritional Epidemiology. [Google Scholar]
- 33.Stevens J, Keil JE, Waid LR, Gazes PC. Accuracy of current, 4-year, and 28-year self-reported body weight in an elderly population. Am J Epidemiol. 1990;132(6):1156–1163. doi: 10.1093/oxfordjournals.aje.a115758. [DOI] [PubMed] [Google Scholar]
- 34.Lawlor DA, Bedford C, Taylor M, Ebrahim S. Agreement between measured and self-reported weight in older women. Results from the British Women’s Heart and Health Study. Age Ageing. 2002;31(3):169–174. doi: 10.1093/ageing/31.3.169. [DOI] [PubMed] [Google Scholar]
- 35.Flegal KM, Graubard BI, Williamson DF, Gail MH. Cause-specific excess deaths associated with underweight, overweight, and obesity. JAMA. 2007;298(17):2028–2037. doi: 10.1001/jama.298.17.2028. [DOI] [PubMed] [Google Scholar]
- 36.French SA, Folsom AR, Jeffery RW, Williamson DF. Prospective study of intentionality of weight loss and mortality in older women: the Iowa Women’s Health Study. Am J Epidemiol. 1999;149(6):504–514. doi: 10.1093/oxfordjournals.aje.a009844. [DOI] [PubMed] [Google Scholar]
- 37.Horm J, Anderson K. Who in America is trying to lose weight? Ann Intern Med. 1993;119(7 Pt 2):672–676. doi: 10.7326/0003-4819-119-7_part_2-199310011-00009. [DOI] [PubMed] [Google Scholar]
- 38.Van Gaal LF, Wauters MA, De Leeuw IH. The beneficial effects of modest weight loss on cardiovascular risk factors. Int J Obes Relat Metab Disord. 1997;21(suppl 1):S5–S9. [PubMed] [Google Scholar]
- 39.Stevens VJ, Obarzanek E, Cook NR, Lee IM, Appel LJ, Smith West D, Milas NC, Mattfeldt-Beman M, Belden L, Bragg C, Millstone M, Raczynski J, Brewer A, Singh B, Cohen J. Long-term weight loss and changes in blood pressure: results of the Trials of Hypertension Prevention, phase II. Ann Intern Med. 2001;134(1):1–11. doi: 10.7326/0003-4819-134-1-200101020-00007. [DOI] [PubMed] [Google Scholar]
- 40.Adams TD, Gress RE, Smith SC, Halverson RC, Simper SC, Rosamond WD, Lamonte MJ, Stroup AM, Hunt SC. Long-term mortality after gastric bypass surgery. N Engl J Med. 2007;357(8):753–761. doi: 10.1056/NEJMoa066603. [DOI] [PubMed] [Google Scholar]
Associated Data
This section collects any data citations, data availability statements, or supplementary materials included in this article.