Abstract
Recent findings denote an important contribution of macrophage inflammatory pathways in causing obesity-related insulin resistance. Inducible nitric oxide synthase (iNOS) is activated in proinflammatory macrophages and modestly elevated in insulin-responsive tissues. Although the benefits of systemic iNOS inhibition in insulin-resistant models have been demonstrated, the role of macrophage iNOS in metabolic disorders is not clear. In the current work, we used bone marrow transplantation (BMT) to generate mice with myeloid iNOS deficiency [iNOS BMT knockout (KO)]. Interestingly, disruption of iNOS in myeloid cells did not protect mice from high-fat diet-induced obesity and insulin resistance. When mice were treated with the iNOS inhibitor, N6-(1-Iminoethyl)-L-lysine hydrochloride (L-NIL), we observed a significant and comparable improvement of glucose homeostasis and insulin sensitivity in both wild-type and iNOS BMT KO mice. We further demonstrated that absence of iNOS in primary macrophages did not affect acute TLR4 signaling pathways and had only a modest and mixed effect on inflammatory gene expression. With respect to TNFα treatment, iNOS KO macrophages showed, if anything, a greater inflammatory response. In summary, we conclude that iNOS inhibition in tissues other than myeloid cells is responsible for the beneficial effects in obesity/insulin resistance.
Inhibition of iNOS in tissues other than myeloid cells is responsible for the beneficial effects in obesity/insulin resistance.
Inflammation is one of the mechanisms underlying insulin resistance and the metabolic syndrome ( 1). Emerging data have established that obesity and insulin resistance are associated with a state of chronic tissue inflammation, as indicated by elevated plasma levels of TNFα, C-reactive protein, IL-6, and plasminogen activator inhibitor-1 ( 2). Activated inflammatory signaling pathways mediated by C-jun N-terminus kinase, inhibitor of κB kinase (IKK), and p38 MAPK induce the adverse effects of inflammation on insulin signaling in insulin-responsive tissues ( 3,4). Recent studies have shown that an increased number of inflammatory macrophages infiltrate into obese adipose tissue and the resultant adipose tissue macrophage (ATM)-mediated inflammatory phenotype impairs adipocyte and systemic insulin sensitivity ( 5). Thus, obesity and type 2 diabetes are chronic proinflammatory states in which the inflammatory responses contribute to insulin resistance.
Nitric oxide synthases (NOS) are a family of enzymes that catalyze the generation of nitric oxide (NO) from l-arginine. As an important secondary messenger molecule, NO regulates a number of biological functions in cells ( 6,7). The level of inducible NOS (iNOS or NOS2) is tightly controlled by transcriptional regulation and is dramatically enhanced in phagocytes, such as neutrophils or macrophages, in inflamed tissues ( 8). The duration and quantity of NO generated by iNOS is typically greater than that produced by other NOS enzymes. Although there are cellular mechanisms to control NO accumulation, excessive NO may react with superoxide to create peroxynitrite, leading to protein nitration, lipid peroxidation, DNA damage, and mitochondrial toxicity ( 8).
The role of iNOS in diabetes was first described by Perreault and Marette ( 9) in iNOS knockout (KO) mice. When iNOS is genetically ablated, mice are protected from high-fat diet-induced insulin resistance. In ob/ob mice, treatment with N6-(1-Iminoethyl)-L-lysine hydrochloride (L-NIL), a selective inhibitor of iNOS, reverses fasting hyperglycemia ( 10). Two widely used antidiabetic drugs, metformin and rosiglitazone, inhibit iNOS induction in muscle cells, adipocytes, and macrophages ( 11,12). Moreover, disruption of iNOS potentiates the insulin-sensitizing actions of rosiglitazone ( 13). In addition, increased expression of iNOS is found in liver and muscle of obese mouse models, in which iNOS mediates nitrosylation and deactivation of insulin receptor (IR)β/insulin receptor substrate-1 (IRS-1) and AKT ( 14,15). NO donor or ectopic iNOS expression also causes IRS-1 degradation in cultured muscle and liver cell lines ( 16).
Although detrimental effects of iNOS on insulin sensitivity have been demonstrated in several studies, the role of macrophage iNOS in metabolic disorders has not been addressed. Because macrophage inflammation contributes to insulin resistance, and iNOS is induced in macrophages during inflammation, we examined the role of macrophage iNOS in insulin-resistant mouse models. In the current work, we used bone marrow transplantation (BMT) to generate mice with myeloid iNOS deficiency (iNOS BMT KO). Surprisingly, we found that the disruption of iNOS in myeloid cells did not protect mice from high-fat diet-induced obesity and insulin resistance. When mice were treated with the systemic iNOS inhibitor L-NIL, we observed a significant and comparable improvement of glucose homeostasis and insulin sensitivity in both wild-type (WT) and iNOS BMT KO mice. We further demonstrated that absence of iNOS in macrophages led to a mixed response to lipopolysaccharide (LPS) stimulation and a more proinflammatory response to TNFα treatment. Thus, we conclude that iNOS inhibition in tissues other than myeloid cells is responsible for the beneficial effects in obesity/insulin resistance.
Results
iNOS is an important component of the inflammatory pathway and to examine the role of macrophage iNOS in insulin resistance, we generated mice with myeloid deficiency of iNOS (iNOS BMT KO) by using bone marrow-adoptive transplant. With this approach, bone marrow from iNOS−/− mice was transplanted into irradiated wild-type C57BL/6J host mice to create chimeric animals in which all the hematopoietic elements carry the iNOS KO, whereas, all somatic tissues expressed normal iNOS. WT mice transplanted with WT bone marrows were used as controls.
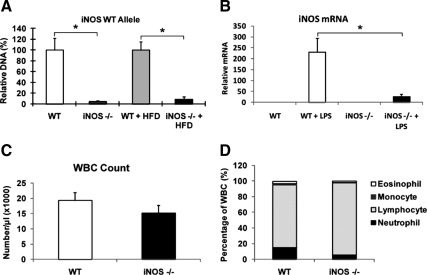
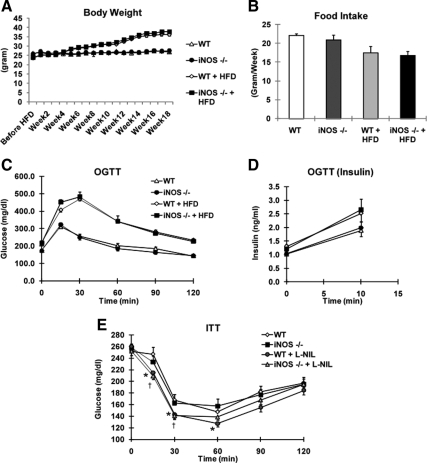
Quantitative PCR confirmed that the average KO efficiency in circulating white blood cells in iNOS BMT KO mice was approximately 95% on chow diet and about 90% on HFD (P < 0.01) (Fig. 1A). Furthermore, iNOS expression in LPS-stimulated ip macrophages (IP MACs) from iNOS BMT KO mice was decreased more than 90% compared with WT mice (Fig. 1B). Hemograms demonstrated a statistically nonsignificant trend for lower white blood cell counts, percent monocytes, and percent neutrophils in iNOS BMT KO mice (Fig. 1, C and D). Interestingly, the percent lymphocytes in iNOS BMT KO mice showed an increased trend (Fig. 1D), although absolute lymphocyte numbers were not altered (data not shown). After 8 wk for bone marrow reconstitution, mice were started on HFD feeding. Body weights and food intake of WT mice and iNOS BMT KO mice were similar throughout the course of the study (Fig. 2, A and B). Neither glucose tolerance tests (GTTs) performed at wk 14 on HFD (Fig. 2, C and D), nor insulin tolerance tests (ITTs) performed at wk 15 (data not shown) revealed any noticeable difference between WT and iNOS BMT KO groups. This was unexpected because iNOS is considered to be a proinflammatory gene, and ablation of iNOS might be expected to ameliorate macrophage inflammation and insulin resistance. Although the macrophage is an important cell type that expresses iNOS, other tissues also express iNOS, especially under stress conditions ( 17,18). Given that whole-body iNOS KO mice showed improved insulin sensitivity, it is possible that iNOS deficiency in tissues other than macrophages protected mice from insulin resistance. To test this hypothesis, we treated WT mice and iNOS BMT KO mice with a selective iNOS inhibitor, L-NIL. Several reports have previously shown that L-NIL treatment is able to decrease glucose and insulin levels in mice ( 10,16). Consistent with these previous publications, ITTs revealed that insulin sensitivity was significantly enhanced by L-NIL treatment (Fig. 2E) in high-fat diet (HFD)-fed mice. However, the improvement was identical in WT and iNOS BMT KO mice, indicating that macrophage iNOS does not account for the beneficial effect of iNOS inhibition.
Figure 1.
iNOS deficiency in myeloid cells from mice transplanted with iNOS-deleted hematopoietic cells. A, Quantitative PCR analysis for the WT iNOS genomic locus in peripheral blood mononuclear cells from transplanted mice. B, Intraperitoneal MACs isolated from iNOS BMT KO mice or WT mice were stimulated by LPS for 3 h. Normalized expression of WT iNOS mRNA was measured. C, Total white blood cell (WBC) counts in recipient mice. D, Hemogram analyses demonstrating blood cell lineage distributions in recipient mice. All data shown are as mean ± sem. Asterisks indicate statistical significance (P < 0.05) between conditions connected by bars.
Figure 2.
Myeloid iNOS deficiency does not protect mice from HFD-induced insulin resistance and obesity. A, Weight gain of mice on chow diet or HFD over 18 wk. B, Food intake of mice on chow diet and HFD. Data shown are weekly food intake. C, Glucose and (D) insulin levels were measured at indicated times during oral glucose tolerance tests (OGTTs) in WT (n = 8) and iNOS BMT KO (n = 10) mice after 14-wk HFD feeding. E, WT and iNOS BMT KO mice were treated with vehicle or L-NIL (50 mg/kg, twice daily) for 10 d. Mice (WT, n = 9; KO, n = 10; WT + L-NIL, n = 6; KO + L-NIL, n = 6) were subjected to insulin tolerance tests. Glucose levels were measured at indicated times. Asterisks indicate statistical significance (P < 0.05) between vehicle-treated and L-NIL-treated WT mice. Daggers indicate statistical significance (P < 0.05) between vehicle-treated and L-NIL-treated iNOS BMT KO mice. All data shown are as mean ± sem.
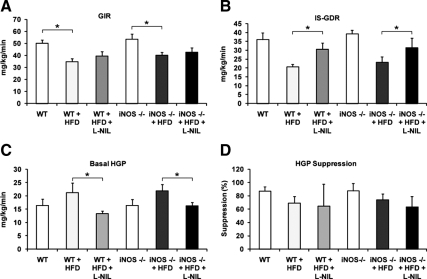
Hyperinsulinemic-euglycemic clamp studies provide a quantitative measurement of insulin sensitivity in vivo. Using the clamp technique, we compared insulin sensitivity in mice with macrophage iNOS deficiency or systemic iNOS inhibition (Fig. 3). The results showed that L-NIL treatment significantly enhanced the insulin-stimulated glucose disposal rate (GDR) (Fig. 3B) and reduced basal hepatic glucose production (HGP) (Fig. 3C). The suppression of HGP by insulin was not altered by L-NIL treatment (Fig. 3D). L-NIL treatment was equally effective in both WT and iNOS BMT KO mice, showing that inhibition of myeloid cell iNOS does not contribute to the insulin-sensitizing effects of systemic iNOS inhibition by L-NIL treatment. Consistent with the results in Fig. 2, no difference in any aspect of insulin sensitivity was noted between WT and iNOS BMT KOs. Based on these results, we conclude that myeloid iNOS contributes little to HFD-induced insulin resistance.
Figure 3.
Systemic iNOS inhibition, but not myeloid cell iNOS deficiency, improves insulin sensitivity. WT mice on chow diet (n = 5), HFD with vehicle treatment (n = 6), HFD with L-NIL treatment (n = 5), iNOS BMT KO mice on chow diet (n = 4), HFD with vehicle treatment (n = 7), or HFD with L-NIL treatment (n = 5) were subjected to euglycemic hyperinsulinemic clamps. Glucose infusion rate (GIR) (A), insulin-stimulated GDR (B), basal HGP (C), and percent suppression of HGP by insulin (D) are shown as mean ± sem. Asterisks indicate statistical significance (P < 0.05) between conditions connected by bars.
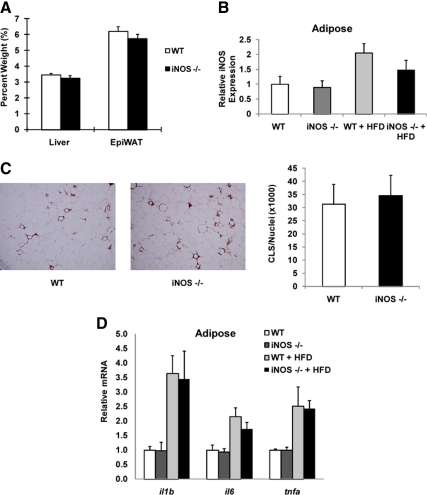
Next we assessed iNOS levels in insulin-responsive tissues. In Fig. 4A, we show that myeloid iNOS deficiency did not alter the percent weight of the liver or epididymal white adipose tissue (WAT). Previous publications have shown that HFD induces the levels of iNOS in insulin target tissues, such as liver and adipose tissue ( 10,19) and consistent with these findings, we observed increased adipose iNOS levels by HFD feeding (Fig. 4B). The levels of iNOS in adipose tissue of WT and BMT KO mice were comparable on chow diet but were approximately 25% lower, albeit not statistically significantly, in iNOS BMT KO mice on HFD, presumably due to the absence of iNOS in the ATMs, which accumulate in adipose tissue with HFD/obesity (Fig. 4B). In contrast, ATM number is very low on chow diets, accounting for the lack of difference of iNOS expression in whole adipose tissue between the genotypes on the chow diet.
Figure 4.
Myeloid cell iNOS deficiency does not decrease adipose tissue inflammation. A, Liver weight and epididymal WAT (EpiWAT) weight were measured. Data shown are organ percent weight and expressed as mean ± sem. B, Adipose iNOS mRNA levels were measured by qPCR. Data shown are the fold induction of gene expression normalized with housekeeping gene and expressed as mean ± sem. C, Tissue sections of epididymal WAT of WT and BMT KO mice were subjected to MAC-2 staining (brown). The number of crown-like structures was calculated and shown as mean ± sem. D, Total RNA extracted from epididymal WAT was subjected to quantitative PCR analysis. Data shown are the fold induction of gene expression normalized with housekeeping gene and expressed as mean ± sem.
To examine whether iNOS BMT KO impairs macrophage infiltration into adipose tissue on HFD, we performed immunohistochemistry by staining adipose tissue for macrophage markers. We found that the number of crown-like structures formed by macrophages was comparable in WT mice and iNOS BMT KO mice (Fig. 4C). More importantly, HFD-induced inflammatory gene expression in adipose tissue was not altered by myeloid cell iNOS deficiency (Fig. 4D).
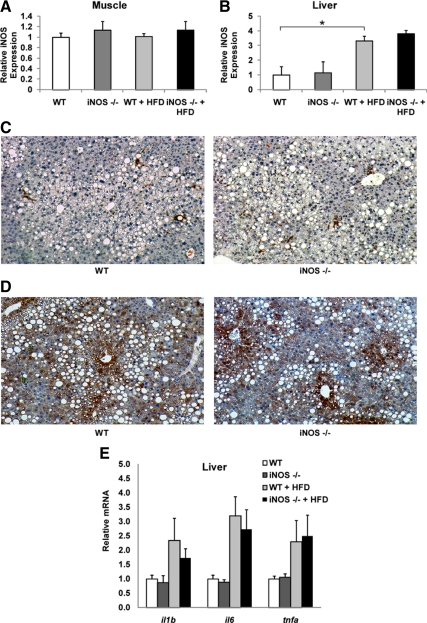
We further measured iNOS expression in muscle and liver. As shown in Fig. 5, A and B, iNOS levels were enhanced by HFD in the liver, but not in the muscle, and there were no differences between genotypes. Staining for the macrophage marker MAC-2 indicated no differences in Kupffer cell numbers between WT mice and iNOS BMT KO mice (Fig. 5C), whereas iNOS staining indicated that expression on HFD was evenly distributed among hepatocytes and nonhepatocytes (Fig. 5D). Similar to adipose tissue, HFD-induced inflammatory gene expression in liver was not different in iNOS BMT KO mice compared with WT mice (Fig. 5E).
Figure 5.
Myeloid cell-specific iNOS deficiency does not alter liver and muscle iNOS levels. A and B, muscle (A) and liver (B) iNOS mRNA levels were measured by quantitative PCR. Data shown are the fold induction of gene expression normalized with housekeeping gene and expressed as mean ± sem. C and D, Liver sections were stained (brown) for MAC-2 (C) or iNOS (D). E, Total RNA extracted from liver was subjected to quantitative PCR analysis. Data shown are the fold induction of gene expression normalized with housekeeping gene and expressed as mean ± sem. Asterisks indicate statistical significance (P < 0.05) between conditions connected by bars.
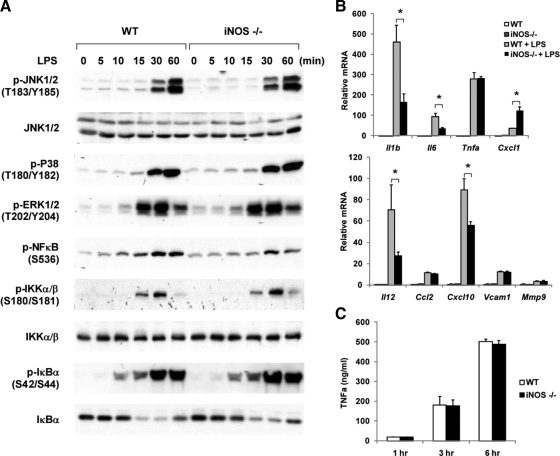
The in vivo findings that iNOS deficiency in myeloid cells did not protect mice from diet-induced insulin resistance were somewhat surprising. Numerous publications suggest that attenuation of macrophage inflammation leads to beneficial effects on insulin resistance in the context of HFD/obesity ( 20,21,22,23). This prompted us to assess whether iNOS deficiency in macrophages attenuated inflammation. Therefore, we measured the inflammatory responses of iNOS null IP MACs after treatment with LPS or TNFα. Compared with WT macrophages, iNOS KO macrophages showed no difference in LPS-stimulated phosphorylation of IKK, IκB, nuclear factor-κB, and MAPKs (Fig. 6A). Interestingly, a varied gene expression pattern was observed in response to LPS (Fig. 6B). Thus, LPS-induced expression of IL-1β, IL-6, IL-12, and chemokine (C-X-C motif) ligand 10 (CXCL10) was significantly reduced in iNOS KO cells, compared with WT, whereas, TNFα, chemokine (C-C motif) ligand 2 (CCL2), and matrix metallopeptidase 9 expression was the same. In contrast, CXCL1 expression was augmented in iNOS KO cells. In line with the gene expression results, TNFα secretion from iNOS-deficient macrophages was comparable to WT cells (Fig. 6C).
Figure 6.
iNOS deficiency in macrophages does not attenuate LPS-induced inflammation. A, WT murine IP MACs or iNOS null IP MACs were treated with 100 ng/ml LPS for the times indicated. Phosphoproteins and total proteins were detected by immunoblotting. B, WT or iNOS null IP MACs were stimulated with 50 ng/ml LPS for 6 h. Total RNA extracted from cells was subjected to pNPA analysis. C, WT or iNOS null IP MACs were stimulated with 50 ng/ml LPS for 6 h. TNFα levels in the conditioned media were measured by ELISA. Data shown are the fold induction of gene expression normalized with housekeeping genes (mean ± sd) from three experiments. Asterisks indicate statistical significance (P < 0.05) between conditions connected by bars.
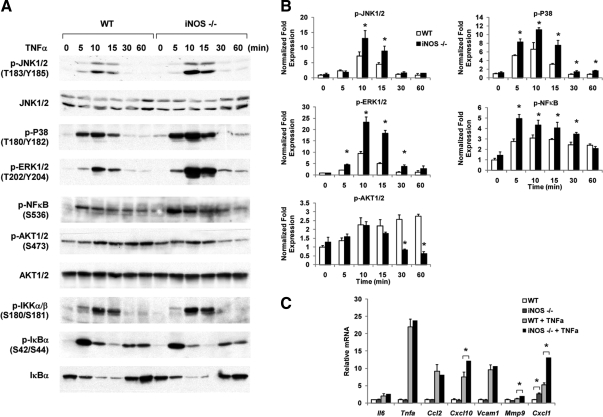
Next we tested TNFα signaling in iNOS−/− macrophages. Figure 7, A and B, demonstrates that three MAPKs, namely C-jun N-terminus kinase, p38, and ERK, showed increased stimulation by TNFα in iNOS KO cells. Phosphorylation of nuclear factor-κB was also enhanced, although phosphorylation of IKK and IκB was the same. With respect to gene expression, mRNA levels of TNFα-stimulated CXCL10, matrix metallopeptidase 9, and CXCL1 were higher in iNOS KO cells than in WT cells (Fig. 7B). The expression of other genes, such as TNFα, vascular cell adhesion molecule 1, IL-6, and CXCL2, was not altered in iNOS KO cells. Taken together, iNOS KO macrophages exhibit a somewhat mixed response to LPS but, if anything, a surprisingly somewhat more proinflammatory response to TNFα. Overall, it appears that neither the number of ATMs nor macrophage inflammatory function was reduced by iNOS ablation in these cells.
Figure 7.
iNOS deficiency increases proinflammatory pathways caused by TNFα stimulation. A, WT murine IP MACs or iNOS null IP MACs were treated with 10 ng/ml of TNFα for the times indicated. Phosphoproteins and total proteins were detected by immunoblotting. B, Relative phosphoprotein levels normalized to respective kinase are shown as mean ± sd. C, WT or iNOS null IP MACs were stimulated with 5 ng/ml of TNFα for 3 h. Total RNA extracted from cells was subjected to pNPA analysis. Data shown are the fold induction of gene expression normalized with housekeeping genes (mean ± sd) from three experiments. Asterisks indicate statistical significance (P < 0.05) between conditions connected by bars.
Discussion
Cumulative results have underscored the important role of macrophage-mediated inflammation in initiating obesity-related insulin resistance, and recent studies have indicated that specific lymphocyte subpoplations can also participate by promoting chemotaxis and activation of ATMs in obese mice ( 21,24,25). These findings suggest that antiinflammatory treatment may be a potential therapy for insulin resistance and diabetes. In mice, iNOS is robustly expressed in activated macrophages and is also modestly up-regulated in insulin-responsive tissues in obese/insulin-resistant states ( 15). Elevated iNOS may lead to increased NO and related cytotoxic products. Therefore, inhibition of iNOS function might be beneficial in metabolic diseases. Indeed, genetic and pharmacological manipulations that inhibit the iNOS pathway have generated favorable results on glucose homeostasis ( 9,10). However, systemic iNOS inhibition may alter immune response or cause undesirable hypertension due to loss of vasodilatation, which limits the therapeutic application of this approach ( 26). In this regard, identifying the target tissues that mediate the beneficial effects of iNOS inhibition may be of value to our understanding of insulin resistance and the development of iNOS-targeted therapeutic approaches. Thus, we assessed whether lack of iNOS in myeloid cells could prevent HFD-induced insulin resistance in mice. Surprisingly, myeloid iNOS deficiency did not attenuate HFD-induced insulin resistance, whereas systemic iNOS inhibition achieved with L-NIL administration did. A number of previous publications have demonstrated the relative specificity of L-NIL in vitro and in vivo ( 27,28). In our studies, we used a submaximal dose of L-NIL and observed enhanced insulin sensitivity in both the WT and BMT iNOS KO mice, inconsistent with earlier findings in iNOS−/− mice. Although we did not study the specificity of L-NIL for iNOS in the current experiments, in conjunction with these previous publications, we conclude that iNOS inhibition in tissues other than myeloid cells is responsible for the beneficial effects in obesity/insulin resistance.
Our studies indicate that myeloid cell iNOS does not contribute to systemic insulin resistance. This finding could be due to several reasons. One possibility is that NO generated by iNOS may exert some protective effects on the inflammatory process. Thus, although iNOS and excessive NO production are generally considered detrimental to tissues, a protective role of iNOS has also been reported ( 29). For example, upon stimulation, iNOS null macrophages generate more reactive oxygen species than normal macrophages ( 30). We found that LPS-induced TNFα secretion was the same in iNOS null cells, whereas iNOS deficiency potentiated TNFα-activated MAPKs. As a result, the expression of selected inflammatory pathway genes is higher, whereas other genes, such as CCL10 and IL-12, were down-regulated, suggesting a duel role of iNOS in inflammation. It is possible that iNOS-derived NO mediates feedback regulation on proinflammatory effects, perhaps via nitrosylation of downstream signaling proteins. Thus, a mixed effect of iNOS deficiency may ultimately lead to a net outcome of no change in inflammation, hence, no improvement in insulin sensitivity with iNOS BMT KO. Alternatively, NO is a highly reactive and unstable radical that readily diffuses within cells and across cell membranes ( 31). However, it is unclear whether NO from ATMs can diffuse far enough to reach adipocytes and influence proteins involved in insulin signaling. Because we did not see changes in insulin sensitivity when myeloid iNOS was eliminated, it appears that myeloid cell-derived NO is not sufficient to induce insulin resistance in target tissues. It is important to note that iNOS levels in human macrophages are much lower than in rodents, and the role of iNOS in human host defense is still controversial ( 32,33).
Our findings are not contradictory to previous publications. Our study implies that iNOS inhibitors most likely target tissues other than macrophages or lymphocytes to regulate glucose homeostasis. One probable site of action is skeletal muscle. iNOS expression is increased in skeletal muscle from obese humans and mice compared with lean controls ( 15,34). In mice, this is associated with IRS-1 suppression, which can be reversed by iNOS inhibition ( 15). Sugita et al. (16) have shown that NO donors and iNOS directly affect IR signaling by nitrosylating IR/IRS-1/AKT in myocytes. Mutation of cysteine 224 of Akt eliminates NO-mediated nitrosylation and degradation ( 14). In line with these findings, ex vivo insulin stimulated muscle glucose uptake is enhanced with iNOS deficiency ( 9). Although we did not detect changes in muscle iNOS levels after HFD feeding, this is not inconsistent with the idea that iNOS inhibition in the muscle improves insulin sensitivity. In addition to muscle, iNOS also exerts adverse effects on insulin signaling in the liver. Increased levels of iNOS and decreased levels of IRS-1 and 2 were observed in the livers of ob/ob mice ( 10). L-NIL treatment enhances IRS-1 and -2 levels and reduces fasting glucose in these animals ( 10). Our results suggest that iNOS expression is increased in the liver by HFD feeding, mainly in hepatocytes, highlighting the likelihood that hepatic iNOS can participate in the development of hepatic insulin resistance. We also showed that HFD enhanced adipose iNOS levels. However, the expression of iNOS is low or undetectable in human adipocytes ( 35,36), although several studies demonstrated that iNOS expression is increased by cytokine treatment in 3T3-L1 adipocytes and may modulate lipolysis ( 18). Thus, the relevance of iNOS in adipocytes remains to be resolved.
When we measured liver iNOS levels in WT mice compared with BMT iNOS KO mice, somewhat surprisingly, we did not observe any differences in iNOS levels between the two genotypes. When we performed immunohistochemistry on liver sections with iNOS antibody, we found that iNOS expression was induced by HFD, but whether the iNOS is expressed in hepatocyte, Kupffer cell, or other liver cell types remains to be determined. Although we did not isolate Kupffer cell-enriched fractions from liver to determine Kupffer cell iNOS deficiency in BMT KO mice, based on several previous publications from our laboratory ( 37), as well as from others (38,39), the BMT protocol has always been successful in causing more than 80% reconstitution with KO donor cells 6 months after irradiation. Thus it is reasonable to conclude that iNOS was deleted from hematopoietic cells (Kupffer cells and recruited macrophages) in the liver.
Collectively, our results suggest that iNOS deficiency in macrophages does not prevent LPS- and TNFα-stimulated inflammation. In line with these in vitro findings, inhibition of iNOS in myeloid cells does not protect mice from HFD-induced obesity and insulin resistance. Because treatment of mice with the iNOS inhibitor, L-NIL, improves glucose tolerance and systemic insulin sensitivity, it is likely that muscle and liver, rather than myeloid cells, are the tissue targets responsible for the beneficial effects of L-NIL-mediated iNOS inhibition.
Materials and Methods
Materials and cell culture
LPS and recombinant TNFα were purchased from Sigma Chemical Co. (St. Louis, MO). All primary antibodies were purchased from Cell Signaling Technology, Inc. (Danvers, MA) unless otherwise indicated. L-NIL was purchased from Cayman Chemical (Ann Arbor, MI). TNFα ELISA kit was purchased from Invitrogen (Carlsbad, CA). Sixty percent HFD was purchased from Research Diets (New Brunswick, NJ). Murine primary macrophages were elicited by ip injection of thioglycollate (3 ml/mouse) in C57BL/6J mice. Macrophages were obtained from ip lavage and washed twice. Cells were cultured in RPMI supplemented with 10% fetal bovine serum for 3 d and then starved overnight in RPMI supplemented with 0.5% fetal bovine serum before the treatment.
Animals
Male WT and iNOS mice (8 wk old; C57BL/6J background) were purchased from The Jackson Laboratory (Bar Harbor, ME) and adapted to a 12-h light, 12-h dark cycle for 1 wk. Bone marrow obtained from wild-type and iNOS mice (∼4 × 10⁶ cells) were injected through the tail vein into male C57BL/6 (9 wk old) that had been irradiated (1000 rad). After 8 wk, reconstitution of donor marrow was verified by quantitative PCR for iNOS genomic locus normalized by actin genomic locus. Mice were then place on 60% HFD for 18 wk. At wk 16 on HFD, a subset of mice was orally treated with L-NIL (50 mg/kg, twice daily) for 10 d.
Mouse procedures conformed to the Guide for Care and Use of Laboratory Animals of the US National Institutes of Health and were approved by the Animal Subjects Committee of the University of California, San Diego.
Metabolic studies
GTTs and ITTs were performed on 6-h fasted mice. For GTT, animals were orally administered with glucose (1 g/kg), whereas for ITT 0.35 U/kg insulin (Novolin R; Novo Nordisk, Princeton, NJ) was injected ip. Blood samples were taken at basal and indicated times after injection.
Hyperinsulinemic euglycemic clamp studies were performed as previously described ( 22). Briefly, two cannulas were implanted in the right jugular vein of each mouse under single-dose anesthesia. The cannulas were tunneled subcutaneously and exteriorized at the back of the neck. The mice were allowed to recover for 4–5 d before clamp procedure. The euglycemic-hyperinsulinemic clamp experiments began with a constant infusion (5 μCi/h) of d-[3-3H]glucose (DuPont NEN, Boston, MA). After 90 min of tracer equilibration and basal sampling at t = − 10 and 0 min, glucose (50% dextrose, variable infusion; Abbott Laboratories, Abbott Park, IL) and tracer (5 μCi/h) plus insulin (8 mU/kg/min) were infused into the jugular vein. Small blood samples from the tail vein were drawn at 10-min intervals and immediately analyzed for glucose to maintain the integrity of the glucose clamp throughout the duration of the experiment. Blood samples were taken at t = −10, 0 (basal), 110, and 120 min (end of experiment) to determine glucose-specific activity and insulin and free fatty acid. The achievement of steady-state conditions (120 mg/dl ± 5 mg/dl) was confirmed at the end of the clamp by measuring blood glucose every 10 min and ensuring that steady state for glucose infusion and plasma glucose levels were maintained for a minimum of 20 min. All blood samples were immediately centrifuged, and plasma was stored at −80 C for subsequent analysis. HGP and GDR were calculated in the basal state and during the steady-state portion of the clamp. Tracer-determined rates were quantified by using the Steele equation for steady-state conditions ( 40). At steady state, the rate of glucose disappearance, or total GDR, is equal to the sum of the rate of endogenous HGPs plus the exogenous (cold) glucose infusion rate. The insulin-stimulated-GDR is equal to the total GDR minus the basal glucose turnover rate.
Glucose, insulin, and free fatty acid levels were measured as previously described ( 22).
Gene expression analyses
Total RNA was extracted from tissue with Purelink total RNA purification system (Invitrogen, Carlsbad, CA) following the manufacturer’s protocol. Total RNA, 2 μg, was reverse transcribed with using iScript cDNA Synthesis Kit (Bio-Rad Laboratories, Inc., Hercules, CA). Primer sequences used in the PCRs were chosen based on the sequences available in GenBank. mRNA of iNOS was measured using the following primer set: 5′-GAGGCCCAGGAGGAGAGAGATCCG-3′ and 5′-TCCATGCAGACAACCTTGGTGTTG-3′, in which the forward primer detects the exon absent in the mutant mice. PCR was carried out using iTaq SYBR Green supermix (Bio-Rad Laboratories) on an MJ Research Chromo4 Real Time PCR system (Bio-Rad Laboratories BV). The mRNA expression of all genes reported is normalized to housekeeping gene (RNA polymerase II).
For quantitative nuclease protection assay, cells were lysed in lysis buffer after various treatments. The quantitative nuclease protection assay ArrayPlate assays were performed by High Throughput Genomics, Inc. (Tucson, AZ).
Western blotting
Cells were serum starved overnight before treatments with agonists. Cells were treated with LPS (100 ng/ml) or TNFα (10 ng/ml) for the indicated times. Cells were then lysed, and total cell lysates were subjected to Western blotting as previously described ( 41).
Immunohistochemistry and quantification of crown-like structure
Immunohistochemistry studies were conducted by the University of California San Diego histology core at Moores Cancer Center. Briefly, paraffin-embedded adipose (epididymal fat) tissue or liver sections from the mice were incubated with MAC-2 antibody (Abcam, Inc., Cambridge, MA) with a 1:100 dilution, or with iNOS antibody (Abcam) with a 1:50 dilution for overnight at 4 C. Subsequently, a biotinylated antirat secondary antibody (BD Biosciences, Palo Alto, CA) was used at 1:100 dilution, followed by 1:500 horseradish peroxidase-streptavidin (Jackson ImmunoResearch Laboratories, Inc., West Grove, PA) and development in substrate chromogen. Slides were counterstained with Mayer’s and mounted with Vectashield mounting media with 4′,6-diamidino-2-phenylindole (Vector Laboratories, Inc., Burlingame, CA). Both bright-field (MAC-2) and fluorescent photographs (DAPI) were taken of three representative fields per slide in a blinded fashion using a fluorescent microscope.
Statistical analysis
Unless otherwise noted, data were analyzed by ANOVA followed by Tukey’s post hoc tests. Individual pair-wise comparisons were performed using Student’s t test. Analysis was performed using Excel (Microsoft, Redmond, WA) or Prizm (GraphPad Software, Inc., San Diego, CA).
Acknowledgments
We thank Jachelle O. Pimentel and Arezou Amidi (University of California, San Diego, CA) for technical support. We thank the Histology and Immunohistochemistry Resource (L. Gapuz and N. Varki) at the Rebecca & John Moores University of California San Diego Cancer Center.
Footnotes
This work was supported by National Institutes of Health Grants DK033651 (to J.M.O.) and DK063491 (to J.M.O.). This work was also supported by the Eunice Kennedy Shriver National Institute of Child Health and Human Development/National Institutes of Health through cooperative agreement of U54 HD012303-25 as part of the specialized Cooperative Centers Program in Reproduction and Infertility Research.
Disclosure Summary: The authors have nothing to disclose.
First Published Online May 5, 2010
Abbreviations: ATM, Adipose tissue macrophage; BMT, bone marrow transplant; CCL, chemokine (C-C motif) ligand; CXCL, chemokine (C-X-C motif) ligand; GDR, glucose disposal rate; GTT, glucose tolerance text; HFD, high-fat diet; IKK, inhibitor of κB kinase; iNOS, inducible nitric oxide synthase; IP MAC, ip macrophage; IR, insulin receptor; IRS, insulin receptor substrate; ITT, insulin tolerance test; KO, knockout; L-NIL, N6-(1-Iminoethyl)-L-lysine hydrochloride; LPS, lipopolysaccharide, NO, nitric oxide; WAT, white adipose tissue; WT, wild type.
References
- Hotamisligil GS 2006 Inflammation and metabolic disorders. Nature 444:860–867 [DOI] [PubMed] [Google Scholar]
- Dandona P, Aljada A, Chaudhuri A, Mohanty P, Garg R 2005 Metabolic syndrome: a comprehensive perspective based on interactions between obesity, diabetes, and inflammation. Circulation 111:1448–1454 [DOI] [PubMed] [Google Scholar]
- Hotamisligil GS 2003 Inflammatory pathways and insulin action. Int J Obes Relat Metab Disord 27(Suppl 3):S53–S55 [DOI] [PubMed] [Google Scholar]
- Shen YH, Zhang L, Gan Y, Wang X, Wang J, LeMaire SA, Coselli JS, Wang XL 2006 Up-regulation of PTEN (phosphatase and tensin homolog deleted on chromosome ten) mediates p38 MAPK stress signal-induced inhibition of insulin signaling. A cross-talk between stress signaling and insulin signaling in resistin-treated human endothelial cells. J Biol Chem 281:7727–7736 [DOI] [PubMed] [Google Scholar]
- Lumeng CN, DelProposto JB, Westcott DJ, Saltiel AR 2008 Phenotypic switching of adipose tissue macrophages with obesity is generated by spatiotemporal differences in macrophage subtypes. Diabetes 57:3239–3246 [DOI] [PMC free article] [PubMed] [Google Scholar]
- Murad F 2006 Shattuck Lecture. Nitric oxide and cyclic GMP in cell signaling and drug development. N Engl J Med 355:2003–2011 [DOI] [PubMed] [Google Scholar]
- Nathan C 2004 The moving frontier in nitric oxide-dependent signaling. Sci STKE 2004:pe52 [DOI] [PubMed] [Google Scholar]
- Tripathi P, Tripathi P, Kashyap L, Singh V 2007 The role of nitric oxide in inflammatory reactions. FEMS Immunol Med Microbiol 51:443–452 [DOI] [PubMed] [Google Scholar]
- Perreault M, Marette A 2001 Targeted disruption of inducible nitric oxide synthase protects against obesity-linked insulin resistance in muscle. Nat Med 7:1138–1143 [DOI] [PubMed] [Google Scholar]
- Fujimoto M, Shimizu N, Kunii K, Martyn JA, Ueki K, Kaneki M 2005 A role for iNOS in fasting hyperglycemia and impaired insulin signaling in the liver of obese diabetic mice. Diabetes 54:1340–1348 [DOI] [PubMed] [Google Scholar]
- Li M, Pascual G, Glass CK 2000 Peroxisome proliferator-activated receptor γ-dependent repression of the inducible nitric oxide synthase gene. Mol Cell Biol 20:4699–4707 [DOI] [PMC free article] [PubMed] [Google Scholar]
- Pilon G, Dallaire P, Marette A 2004 Inhibition of inducible nitric-oxide synthase by activators of AMP-activated protein kinase: a new mechanism of action of insulin-sensitizing drugs. J Biol Chem 279:20767–20774 [DOI] [PubMed] [Google Scholar]
- Dallaire P, Bellmann K, Laplante M, Gélinas S, Centeno-Baez C, Penfornis P, Peyot ML, Latour MG, Lamontagne J, Trujillo ME, Scherer PE, Prentki M, Deshaies Y, Marette A 2008 Obese mice lacking inducible nitric oxide synthase are sensitized to the metabolic actions of peroxisome proliferator-activated receptor-γ agonism. Diabetes 57:1999–2011 [DOI] [PMC free article] [PubMed] [Google Scholar]
- Yasukawa T, Tokunaga E, Ota H, Sugita H, Martyn JA, Kaneki M 2005 S-nitrosylation-dependent inactivation of Akt/protein kinase B in insulin resistance. J Biol Chem 280:7511–7518 [DOI] [PubMed] [Google Scholar]
- Carvalho-Filho MA, Ueno M, Hirabara SM, Seabra AB, Carvalheira JB, de Oliveira MG, Velloso LA, Curi R, Saad MJ 2005 S-nitrosation of the insulin receptor, insulin receptor substrate 1, and protein kinase B/Akt: a novel mechanism of insulin resistance. Diabetes 54:959–967 [DOI] [PubMed] [Google Scholar]
- Sugita H, Fujimoto M, Yasukawa T, Shimizu N, Sugita M, Yasuhara S, Martyn JA, Kaneki M 2005 Inducible nitric-oxide synthase and NO donor induce insulin receptor substrate-1 degradation in skeletal muscle cells. J Biol Chem 280:14203–14211 [DOI] [PubMed] [Google Scholar]
- Carvalho-Filho MA, Ueno M, Carvalheira JB, Velloso LA, Saad MJ 2006 Targeted disruption of iNOS prevents LPS-induced S-nitrosation of IRβ/IRS-1 and Akt and insulin resistance in muscle of mice. Am J Physiol Endocrinol Metab 291:E476–E482 [DOI] [PubMed] [Google Scholar]
- Penfornis P, Marette A 2005 Inducible nitric oxide synthase modulates lipolysis in adipocytes. J Lipid Res 46:135–142 [DOI] [PubMed] [Google Scholar]
- Nomiyama T, Perez-Tilve D, Ogawa D, Gizard F, Zhao Y, Heywood EB, Jones KL, Kawamori R, Cassis LA, Tschöp MH, Bruemmer D 2007 Osteopontin mediates obesity-induced adipose tissue macrophage infiltration and insulin resistance in mice. J Clin Invest 117:2877–2888 [DOI] [PMC free article] [PubMed] [Google Scholar]
- Solinas G, Vilcu C, Neels JG, Bandyopadhyay GK, Luo JL, Naugler W, Grivennikov S, Wynshaw-Boris A, Scadeng M, Olefsky JM, Karin M 2007 JNK1 in hematopoietically derived cells contributes to diet-induced inflammation and insulin resistance without affecting obesity. Cell Metab 6:386–397 [DOI] [PubMed] [Google Scholar]
- Schenk S, Saberi M, Olefsky JM 2008 Insulin sensitivity: modulation by nutrients and inflammation. J Clin Invest 118:2992–3002 [DOI] [PMC free article] [PubMed] [Google Scholar]
- Patsouris D, Li PP, Thapar D, Chapman J, Olefsky JM, Neels JG 2008 Ablation of CD11c-positive cells normalizes insulin sensitivity in obese insulin resistant animals. Cell Metab 8:301–309 [DOI] [PMC free article] [PubMed] [Google Scholar]
- Verschuren L, Kooistra T, Bernhagen J, Voshol PJ, Ouwens DM, van Erk M, de Vries-van der Weij J, Leng L, van Bockel JH, van Dijk KW, Fingerle-Rowson G, Bucala R, Kleemann R 2009 MIF deficiency reduces chronic inflammation in white adipose tissue and impairs the development of insulin resistance, glucose intolerance, and associated atherosclerotic disease. Circ Res 105:99–107 [DOI] [PMC free article] [PubMed] [Google Scholar]
- Nishimura S, Manabe I, Nagasaki M, Eto K, Yamashita H, Ohsugi M, Otsu M, Hara K, Ueki K, Sugiura S, Yoshimura K, Kadowaki T, Nagai R 2009 CD8+ effector T cells contribute to macrophage recruitment and adipose tissue inflammation in obesity. Nat Med 15:914–920 [DOI] [PubMed] [Google Scholar]
- Feuerer M, Herrero L, Cipolletta D, Naaz A, Wong J, Nayer A, Lee J, Goldfine AB, Benoist C, Shoelson S, Mathis D 2009 Lean, but not obese, fat is enriched for a unique population of regulatory T cells that affect metabolic parameters. Nat Med 15:930–939 [DOI] [PMC free article] [PubMed] [Google Scholar]
- Dover AR, Chia S, Ferguson JW, Cruden NL, Megson IL, Fox KA, Newby DE 2006 Inducible nitric oxide synthase activity does not contribute to the maintenance of peripheral vascular tone in patients with heart failure. Clin Sci (Lond) 111:275–280 [DOI] [PubMed] [Google Scholar]
- Hallinan EA, Tsymbalov S, Dorn CR, Pitzele BS, Hansen Jr DW, Moore WM, Jerome GM, Connor JR, Branson LF, Widomski DL, Zhang Y, Currie MG, Manning PT 2002 Synthesis and biological characterization of L-N(6)-(1-iminoethyl)lysine 5-tetrazole-amide, a prodrug of a selective iNOS inhibitor. J Med Chem 45:1686–1689 [DOI] [PubMed] [Google Scholar]
- Stenger S, Thuring H, Rollinghoff M, Manning P, Bogdan C 1995 L-N6-(1-iminoethyl)-lysine potently inhibits inducible nitric oxide synthase and is superior to NG-monomethyl-arginine in vitro and in vivo. Eur J Pharmacol 294:703–712 [DOI] [PubMed] [Google Scholar]
- Zingarelli B, Hake PW, Yang Z, O'Connor M, Denenberg A, Wong HR 2002 Absence of inducible nitric oxide synthase modulates early reperfusion-induced NF-κB and AP-1 activation and enhances myocardial damage. FASEB J 16:327–342 [DOI] [PubMed] [Google Scholar]
- Zeidler PC, Roberts JR, Castranova V, Chen F, Butterworth L, Andrew ME, Robinson VA, Porter DW 2003 Response of alveolar macrophages from inducible nitric oxide synthase knockout or wild-type mice to an in vitro lipopolysaccharide or silica exposure. J Toxicol Environ Health 66:995–1013 [DOI] [PubMed] [Google Scholar]
- Pacher P, Beckman JS, Liaudet L 2007 Nitric oxide and peroxynitrite in health and disease. Physiol Rev 87:315–424 [DOI] [PMC free article] [PubMed] [Google Scholar]
- Schneemann M, Schoeden G 2007 Macrophage biology and immunology: man is not a mouse. J Leukoc Biol 81:579; discussion 580 [DOI] [PubMed] [Google Scholar]
- Fang FC, Nathan CF 2007 Man is not a mouse: reply. J Leukoc Biol 81:580 [DOI] [PubMed] [Google Scholar]
- Torres SH, De Sanctis JB, de L Briceño M, Hernández N, Finol HJ 2004 Inflammation and nitric oxide production in skeletal muscle of type 2 diabetic patients. J Endocrinol 181:419–427 [DOI] [PubMed] [Google Scholar]
- Linscheid P, Seboek D, Zulewski H, Scherberich A, Blau N, Keller U, Müller B 2006 Cytokine-induced metabolic effects in human adipocytes are independent of endogenous nitric oxide. Am J Physiol Endocrinol Metab 290:E1068–E1077 [DOI] [PubMed] [Google Scholar]
- Engeli S, Janke J, Gorzelniak K, Böhnke J, Ghose N, Lindschau C, Luft FC, Sharma AM 2004 Regulation of the nitric oxide system in human adipose tissue. J Lipid Res 45:1640–1648 [DOI] [PubMed] [Google Scholar]
- Saberi M, Woods NB, de Luca C, Schenk S, Lu JC, Bandyopadhyay G, Verma IM, Olefsky JM 2009 Hematopoietic cell-specific deletion of toll-like receptor 4 ameliorates hepatic and adipose tissue insulin resistance in high-fat-fed mice. Cell Metab 10:419–429 [DOI] [PMC free article] [PubMed] [Google Scholar]
- Naito M, Hasegawa G, Ebe Y, Yamamoto T 2004 Differentiation and function of Kupffer cells. Med Electron Microsc 37:16–28 [DOI] [PubMed] [Google Scholar]
- Odegaard JI, Ricardo-Gonzalez RR, Red Eagle A, Vats D, Morel CR, Goforth MH, Subramanian V, Mukundan L, Ferrante AW, Chawla A 2008 Alternative M2 activation of Kupffer cells by PPARδ ameliorates obesity-induced insulin resistance. Cell Metab 7:496–507 [DOI] [PMC free article] [PubMed] [Google Scholar]
- Steele R 1959 Influences of glucose loading and of injected insulin on hepatic glucose output. Ann NY Acad Sci 82:420–430 [DOI] [PubMed] [Google Scholar]
- Lu M, Shyy JY 2006 Sterol regulatory element-binding protein 1 is negatively modulated by PKA phosphorylation. Am J Physiol 290:C1477–C1486 [DOI] [PubMed] [Google Scholar]


