Abstract
Renal (pro)renin receptor (PRR) expression is increased in diabetes. The exact mechanisms involved in this process are not well established. We hypothesized that high glucose up-regulates PRR through protein kinase C (PKC)-Raf-ERK and PKC-c-Jun N-terminal kinase (JNK)-c-Jun signaling pathways. Rat mesangial cells exposed to 30 mm d-glucose demonstrated significant increase in PRR mRNA and protein expression, intracellular phosphorylation of Raf-1 (Y340/341), ERK, JNK, nuclear factor-κB (NF-κB) p65 (S536) and c-Jun (S63). By chromatin immunoprecipitation assay and EMSA, high glucose induced more functional NF-κB and activator protein (AP)-1 dimers bound to corresponding cis-regulatory elements in the predicted PRR promoter to up-regulate PRR transcription. Conventional and novel PKC inhibitors Chelerythrine and Rottlerin, Raf-1 inhibitor GW5074, MEK1/2 inhibitor U0126, JNK inhibitor SP600125, NF-κB inhibitor Quinazoline, and AP-1 inhibitor Curcumin, respectively, attenuated glucose-induced PRR up-regulation. Chelerythrine and Rottlerin also inhibited glucose-induced phosphorylation of Raf-1 (Y340/341), ERK1/2, JNK, NF-κB p65 (S536), and c-Jun (S63). GW5074 and U0126 inhibited the phosphorylation of ERK1/2 and NF-κB p65 (S536). SP600125 inhibited phosphorylation of NF-κB p65 (S536) and c-Jun (S63). We conclude that high glucose up-regulates the expression of PRR through mechanisms dependent on both PKC-Raf-ERK and PKC-JNK-c-Jun signaling pathways. NF-κB and AP-1 are involved in high-glucose-induced PRR up-regulation in rat mesangial cells.
Hyperglycemia upregulates (Pro)renin receptor expression, a finding that could lead to better understanding of the pathophysiology of diabetes complications.
All components of the renin-angiotensin system are present within the kidney, and its activity is significantly increased in diabetes (1,2). The (pro)renin receptor (PRR) is a newly described component of this system (3,4). The ATP6AP2 (ATPase, H+ transporting, lysosomal accessory protein 2) gene that is mapped to chromosome X encodes PRR protein in humans (5,6). The exact physiological and pathological functions of PRR are not established yet. Previous studies demonstrated the presence of PRR in human mesangial cells and its high binding capacity to renin and prorenin (3,4). PRR stimulation resulted in increased biosynthesis of angiotensin I from angiotensinogen and activation of the intracellular ERK 1 and 2 (3,4). Overexpression of human PRR in transgenic rats resulted in the elevation of blood pressure and heart rate (7). PRR blockade in rodents improved albuminuria, glomerulosclerosis (8,9,10,11), and inflammation (12,13,14). Recently we reported increased expression of renal PRR in streptozocin (STZ)-induced diabetic rat model, especially in renal glomeruli and tubules (15) and cultured rat mesangial cells (RMCs) exposed to high glucose level (16). These data imply that PRR may contribute to the pathophysiology of kidney diseases, particularly in the presence of elevated blood glucose. The present study was undertaken to investigate the role of protein kinase C (PKC)-Raf-ERK and PKC-c-Jun N-terminal kinase (JNK)-c-Jun signaling pathways in the regulation of PRR expression by high glucose in RMCs.
Materials and Methods
Cell culture and treatment
RMCs were obtained from the American Type Culture Collection (Manassas, VA) and cultured according to American Type Culture Collection recommended protocol. DMEM (Invitrogen, Carlsbad, CA) containing 5 mm d-glucose was used in cell culture. Our recent studies showed that d-glucose induced PRR expression via time- and dose-dependent manners with maximum expression after 2 wk of high-glucose exposure (14). According to these results, all studies described below used RMCs incubated for 14 d in DMEM containing 30 mm d-glucose (high glucose) for experimental groups and 5 mm d-glucose plus 25 mm l-glucose for control groups (14). RMCs were split every 48 h. Cells (5 × 10⁶) were subcultured in each split. The culture media were changed daily. Before each experimental treatment, cells were serum starved for 12 h with serum-free medium, Opti-MEM I (Invitrogen) in the presence of 30 mm d-glucose or 5 mm d-glucose + 25 mm l-glucose. Cells were treated with different protein kinase inhibitors for 6 h in serum-free medium. Chelerythrine (16,17), Rottlerin (18), U0126 (19), SP600125 (20), GW5074 (21), and nuclear factor-κB (NF-κB) activation inhibitor Quinazoline (22), specific inhibitors of conventional PKC, novel PKC (nPKC), MAPK kinase (MEK)1/2, c-JNK, Raf-1, and NF-κB, respectively, were obtained from Calbiochem (La Jolla, CA). Curcumin (23,24,25,26), a specific inhibitor for activator protein (AP)-1, was obtained from Sigma (St. Louis, MO). The concentration of each inhibitor was primarily based on previously published reports demonstrating their effectiveness in RMCs. At the end of each experiment, cells were harvested for the preparation of whole-cell lysate and total RNA extraction.
Determination of PRR mRNA expression
Quantitative real-time RT-PCR was used to evaluate changes in PRR mRNA. RNA was extracted from cultured cells with the RNeasy total RNA isolation kit as per the manufacturer’s recommendation (QIAGEN, Valencia, CA). The integrity and relative contamination of mRNA with ribosomal RNA was assessed by 2% formaldehyde agarose gel electrophoresis. Expression levels of PRR mRNA were measured by real-time RT-PCR iCycler according to the manufacturer’s instructions (Bio-Rad, Hercules, CA). Single-stranded cDNA was synthesized using iScript cDNA synthesis kit (Bio-Rad). PCR was performed with iQ SYBR green supermix (Bio-Rad) according to the manufacturer’s instructions. The used primers sequences are listed in Table 1. Reactions were performed in triplicate, and threshold cycle numbers were averaged. No-template control was used as negative control. Samples were normalized to β-actin mRNA.
Table 1.
Oligonucleotides used in RT-PCR, ChIP assay, and EMSA
| Application | Target element | Oligonucleotide | Sequence (5′–3′) |
|---|---|---|---|
| RT-PCR | PRR forward | TGGCCTATACCAGGAGATCG | |
| PRR reverse | AATAGGTTGCCCACAGCAAG | ||
| β-Actin forward | AGCCATGTACGTAGCCATCC | ||
| β-Actin reverse | ACCCTCATAGATGGGCACAG | ||
| ChIP | C | Prom-1145F | CCATTCCGAGTCACCCTCT |
| Prom-1031R | TCTCATCCTCCTGTCTTGATTTT | ||
| A, D | Prom-976F | AGGGATGGTATATGCGATGG | |
| Prom-808R | ACCGAGTATCCGAGAATGGA | ||
| E | Prom-375F | CCACGTTCTAGCCCTTTCTG | |
| Prom-143R | CCGTACGAGACGGTTATCCT | ||
| F, G, B | Prom-184F | GGGACGAGAATTTTGGAAAC | |
| Prom-25R | AGGGAGGGGAAATCTGAGAG | ||
| EMSA | A | NF-κB01 | AGTATAAGTAGAAAGTTCCAGTAGTCGACC |
| B | NF-κB02 | GATGCAGAGAGAGGACATCGCCGCATCAAC | |
| G | Sp1 | GTAGTGCAATCAGGGGCGGGGTTAACGCTTGCAGTGGGTCCGATGCAGAG | |
| C | AP-1.1 | AACTCCATTCCGAGTCACCCTCTCGGGAAC | |
| D | AP-1.2 | AACAAAAGATTGGTGTCTAATACACGGGTG | |
| E | AP-1.3 | GTTCTAGCCCTTTCTGACTACGGGTACAAC | |
| F | AP-1.4 | ACCGTCTCGTACGGTGAGTAGTGCAATCAG |
Detection of protein expression and phosphorylation
Whole-cell lysates were extracted with lysis buffer containing 50 mm Tris-HCl, pH 8.0; 150 mm NaCl; 2 mm EDTA; 0.1% SDS; 1% IGEPAL CA-630; 0.5% deoxycholate sodium; 20 μm MG132 (Calbiochem, La Jolla CA); 50 mm sodium fluoride; 2 mm sodium orthovanadate; 1 mm phenyl methane sulfonyl fluoride; and 1× dilution protease inhibitor cocktail (Roche, Indianapolis, IN). Extracted proteins were quantified by BCA protein assay kit (Pierce Biotechnology, Rockford, IL). A total of 20–50 μg of cell lysate per sample was loaded and separated by SDS-PAGE. Primary antibodies against ATP6AP2, TATA binding protein (Abcam, Cambridge, MA), PKCα, PKCβI, PKCγ, PKCδ, Raf-1, phospho-Raf-1 (Y340/341), NF-κB p65, NF-κB p50, NF-κB p52, Jun B, Jun D, c-Jun, phospho-c-Jun (S63), c-Fos, Sp1, Sp3 (Santa Cruz Biotechnology, Santa Cruz, CA), phospho-NF-κB p65 (S536) (Cell Signaling Technology, Danvers, MA), ERK1/2, phospho-ERK1/2 (T185/Y187), JNK, and phospho-JNK (T183/Y185) (Invitrogen) were used in this study. Blots were reprobed with anti-β-actin antibody (Sigma). The band density of each target protein was normalized to the corresponding density of β-actin. The arbitrary unit of band densities was represented as the expression level.
Compartmentalization analysis of PKC
Fractionation of PKC in cytosols and membranes was conducted as previously described (27). Nuclear proteins were prepared by nuclear and cytoplasmic extraction reagents as per the manufacturer’s recommendations (Pierce Biotechnology). Cytosolic, membranous, and nuclear proteins were quantified by Western blot analysis, and nuclear proteins were also used for EMSA.
Prediction of PRR promoter and real-time mapping of NF-κB and AP-1 regulatory elements
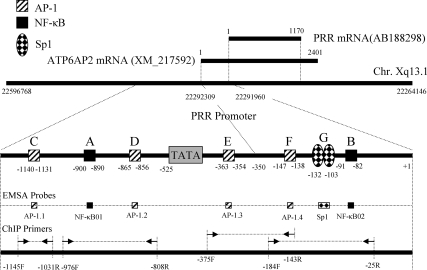
Using ensemble genome browser, ATP6AP2 gene was mapped to chromosome Xq13 (X 22,263,146–22,597,769) in rat, Xp11.4 (X 40,325,104–40,350,833) in human, and XA1.1 (X 11,744,760–11,774,008) in mouse. The similarity of human and rat ATP6AP2 or PRR is 89.4% (nucleotides) and 92.84% (amino acid). By comparing the predicted rat ATP6AP2 mRNA (XM_217592.4; 2041 bp) with rat PRR mRNA (AB188298.1; 1170 bp), we defined the start nucleotide of rat PRR mRNA as transcription start site (+1) (Fig. 1). Contrary to human and mouse ATP6AP2 mRNA located at plus strand, rat PRR mRNA resides in reverse strand with 3′ to 5′ orientation. Upstream (1000 bp) and downstream (1000 bp) sequences of human, mouse, and rat ATP6AP2 mRNAs, i.e. human (X40324140-40326104), mouse (X11743760-11745760), and rat (X22291960-22293960), were extracted as candidate promoters from the Ensemble Genome Browser Database. Prediction of rat candidate promoter (X22291960-22293960) by Berkeley Drosophila Genome Project neural network promoter prediction program showed that three regions (−643 to −593 bp, −589 to −539 bp, and −535 to −485 bp) have characteristics of potential promoters with high score (score 0.99, 0.83, and 0.95, respectively; cutoff 0.8). By analyzing the rat sequence with Hamming-clustering method TATA signal prediction in eukaryotic genes, all three potential promoters have TATA box sequence. The multiple alignments of human, mouse, and rat ATP6AP2 candidate promoter sequences showed an extensive consensus among these three species. By integrating the information from promoter consensus sequences of human, mouse, and rat with the prediction of transcription factor binding sites by Alibaba 2.1, we mapped AP-1 and NF-κB binding sites for PRR promoter as illustrated in Fig. 1.
Figure 1.
PRR promoter prediction, mapping of NF-κB and AP-1 regulatory elements, and designs of ChIP primers and EMSA probes. Sp1, AP-1, and NF-κB elements in PRR promotor are designated with large capital letters A–G. EMSA probes corresponding to A–G elements were labeled as NF-κB01-02, AP-1.1-1.4, and Sp1, respectively. Position and orientation of ChIP primers corresponding to different A–G elements were labeled with black arrows and dashed lines. F, Forward primer; R, reverse primer.
A chromatin immunoprecipitation (ChIP) assay kit was used in this study (Millipore, Billerica, MA). After 2 wk of glucose exposure, cells were fixed with formalin and the assay protocol was followed according to the manufacturer’s instructions. DNAs from all samples and inputs were purified with phenol/chloroform extraction and ethanol precipitation. Input, immunoprecipitation, and none-antibody fractions were analyzed by subsequent PCR with iQ SYBR green supermix (Bio-Rad) according to the manufacturer’s instructions on real-time PCR iCycler (Bio-Rad). The appropriated primer pairs corresponding to the fragments in the promoter region of PRR gene, shown as A to G elements, are listed in the Fig. 1 and Table 1. The evaluation of real-time binding ability of transcription factor to promoter was performed according to the following equation: 2(Ct Input-Ct ChIP) − 2(Ct Input-Ct NoAb), where Ct is cycle threshold, and expressed as relative enrichment. In each experimental group, triplicate samples were used for statistical analysis.
In vitro binding activity of NF-κB and AP-1 to predicted PRR promoter by EMSA
After 2 wk of glucose exposure, nuclear proteins were prepared by NE-PER nuclear and cytoplasmic extraction reagents as per manufacturer’s recommendations (Pierce Biotechnology). The oligonucleotides probes (Table 1) corresponding to the consensus NF-κB and AP-1 binding sites in the promoter region of the rat PRR (shown as A to G elements in Fig. 1) were used to measure the DNA binding activity of NF-κB and AP-1. EMSA was performed using a digoxigenin (DIG) gel shift kit (Roche) as directed by the manufacturer’s instructions. In brief, the double-stranded oligonucleotides were 3′-end labeled with DIG-11-deoxyuridine triphosphate. DIG-labeled probes were incubated at room temperature for 20 min with 4 μg of nuclear extracts. The DNA-protein complexes were separated by 5% nondenaturing polyacrylamide gels, transferred to nylon membranes, and detected chemiluminescently. A 125-fold excess of unlabeled probe was used for competition experiments with NF-κB, AP-1, and Sp1, respectively. Equal loading of labeled oligonucleotide was confirmed by examining the density of unlabeled oligonucleotide at the bottom of each lane.
Statistical analysis
Comparisons among different treatment groups are examined by ANOVA. Data are expressed as mean ± se. P < 0.05 is considered statistically significant.
Results
Effects of inhibition of PKC-Raf1-ERK and PKC-JNK kinases pathways on the expression of PRR induced by high glucose in RMCs
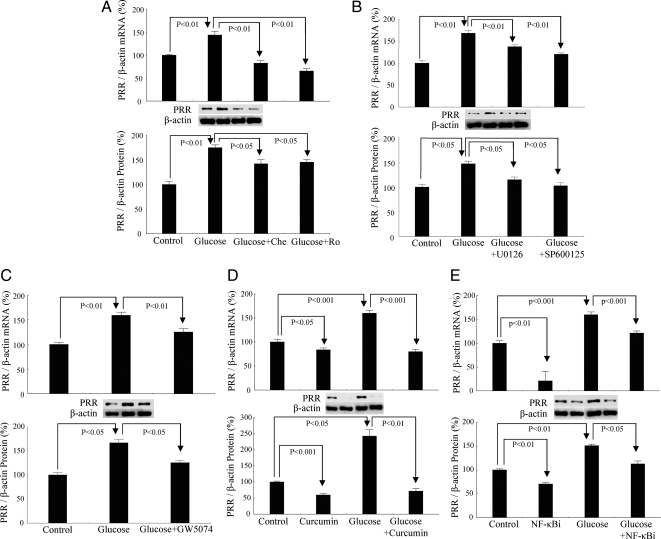
Under basal conditions, PRR was constitutively expressed in RMCs. High-glucose treatment significantly up-regulated PRR mRNA by 44% and protein by 75% (Fig. 2A). Inhibition of conventional PKC or nPKC with Chelerythrine or Rottlerin, respectively, significantly attenuated high-glucose-induced increase of PRR mRNA by 76 and 79% and protein by 33 and 30%, respectively (Fig. 2A).
Figure 2.
Effect of glucose and different intracellular signaling pathways on PRR expression. A, Inhibition of PKC with Chelerythrine (Che; 5 μm) and Rottlerin (Ro; 5 μm). B, Inhibition of MAPKs with U0126 (10 μm) and SP600125 (20 μm). C, Inhibition of Raf-1 with GW5074 (10 nm). D, Inhibition of AP-1 with Curcumin (100 μm). E, Inhibition of NF-κB with Quinazoline (NF-κBi) (10 μm). Control, 5 mm d-glucose+25 mm l-glucose; glucose, 30 mm d-glucose. All the results represent the average of three independent experiments and each experiment was repeated at least three times.
Similarly, inhibition of MEK1/2 with U0126, JNK with SP600125, Raf-1 kinase with GW5074, AP-1 transcription factor with Curcumin, or NF-κB transcription factor with Quinazoline significantly blocked the increase of PRR mRNA by 33, 45, 33, 49, and 24% and PRR protein by 31, 43, 41, 70, and 25%, respectively (Fig. 2, B–E).
Influence of high glucose on the expression and compartmentalization of PKC isomers in RMCs
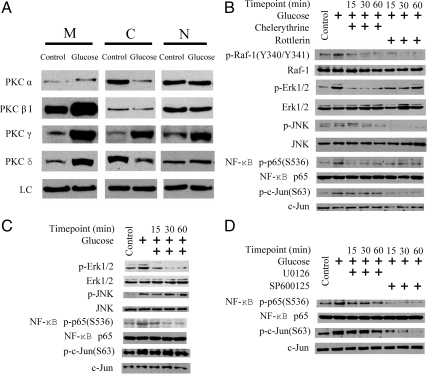
PKCα, -βI, -γ, and -δ were constitutively expressed in membranous, cytosolic, and nuclear compartments (Fig. 3A). High glucose increased membranous PKCα, -βI, -γ, and -δ, cytosolic PKCγ, and nuclear PKCγ and -δ and decreased cytosolic PKCα, -βI, and -δ (Fig. 3A).
Figure 3.
PKC isomer proteins and their translocation, phosphorylation of intracellular signal proteins in response to high glucose alone, and combined with different kinases inhibitors in RMCs. Panel A, PKC isomers in membranous (M), cytosolic (C), and nuclear (N) compartments. Loading control (LC), β-Actin for membranous and cytosolic fractions and TATA binding protein (TBP) for nuclear fraction. Panels B–D, Phosphorylation of intracellular signal proteins in response to high glucose alone and combined with different kinases inhibitors. After 2 wk of glucose exposure and 12 h of serum starvation, cells were exposed to inhibitors for 15, 30, and 60 min. Panel B, PKC inhibition and phosphorylation of Raf-1, ERK1/2, JNK, c-Jun, and NF-κB p65. Panel C, Raf-1 inhibition and phosphorylation of ERK1/2, JNK, c-Jun, and NF-κB p65. Panel D, MEK1/2 and JNK inhibition and phosphorylation of NF-κB p65 and c-Jun. Control, 5 mm d-glucose+25 mm l-glucose; glucose, 30 mm d-glucose. The results are representative of three independent experiments.
Effect of PKC, Raf-1, and MAPK inhibition on JNK, NF-κB p65, and c-Jun phosphorylation
RMCs treated with high glucose demonstrated increased phosphorylation of Raf-1 (Y340/341), ERK1/2 (T185/Y187), JNK (T183/Y185), NF-κB p65(S536), and c-Jun (S63) (Fig. 3B). Glucose treatment did not influence expression of total Raf-1, ERK1/2, JNK, NF-κB p65, or c-Jun (Fig. 3B). Both Chelerythrine and Rottlerin prevented high glucose-induced phosphorylation of Raf-1 (Y340/341), ERK1/2 (T185/Y187), JNK (T183/Y185), and NF-κB p65(S536) within 15–60 min of treatments (Fig. 3B). Chelerythrine did not have a significant effect on c-Jun(S63) phosphorylation, whereas Rottlerin inhibited c-Jun(S63) phosphorylation within 15 min of treatment (Fig. 3B).
Raf-1 inhibitor GW5074 significantly inhibited glucose-induced phosphorylation of ERK1/2 (T185/Y187) and NF-κB p65(S536) within 15–60 min of treatment but did not affect JNK (T183/Y185) or c-Jun (S63) phosphorylation (Fig. 3C).
In glucose-treated RMCs, MEK1/2 inhibitor U0126 inhibited NF-κB p65(S536) and c-Jun(S63) phosphorylation within 15–60 min of treatment (Fig. 3D). Similarly, JNK inhibitor SP600125 significantly inhibited the phosphorylation of NF-κB p65(S536) and c-Jun(S63) within 15–60 min of treatment (Fig. 3D).
NF-κB and AP-1 involvement in PRR transcription regulation
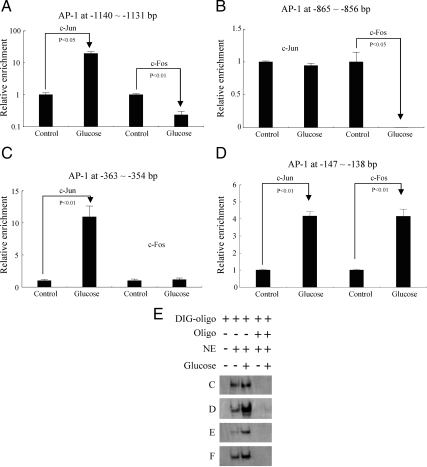
To investigate the cis-regulatory elements NF-κB and AP-1 involvement in PRR transcription regulation, rat PRR promoter and NF-κB and AP-1 transcription factors binding sites were predicted and mapped (detailed in Materials and Methods). ChIP and EMSA were conducted according to the map of rat PRR promoter (Fig. 1). ChIP assay demonstrated that high glucose induced 20-fold increase of c-Jun and 4.3-fold decrease of c-Fos at −1140 to −1131 bp AP-1 binding site (Fig. 4A), 100-fold decrease of c-Fos, whereas c-Jun was unchanged at −865 to −856 bp AP-1 binding site (Fig. 4B), 11-fold increase in c-Jun binding, whereas c-Fos was unchanged at −363 to −354 bp AP-1 binding site (Fig. 4C) and 4.17- and 4.15-fold increase in c-Jun and c-Fos at −147 to −138 bp AP-1 binding site, respectively (Fig. 4D). EMSA results demonstrated that high glucose enhanced AP-1 binding to AP-1-binding elements C (−1140 to −1131 bp), D (−865 to −856 bp), E (−363 to −354 bp), and F (−147 to −138 bp) (Fig. 4E). The corresponding unlabeled competitive probes targeting to C, D, E, and F regions competed for the AP-1 complexes and inhibited the binding process (Fig. 4E).
Figure 4.
Effect of glucose on binding of AP-1 regulatory elements in predicted PRR promoter. Panels A–D, In vivo mapping of AP-1 by ChIP. Panel E, EMSA and competitive EMSA. Oligo, AP-1 probes to AP-1 binding elements (Panels C–F as shown in Fig. 1). NE, Nuclear extract. Glucose (−), Control (5 mm d-glucose+25 mm l-glucose); glucose (+), 30 mm d-glucose. ChIP assay is based on three independent experiments and EMSA is a representative of three experiments.
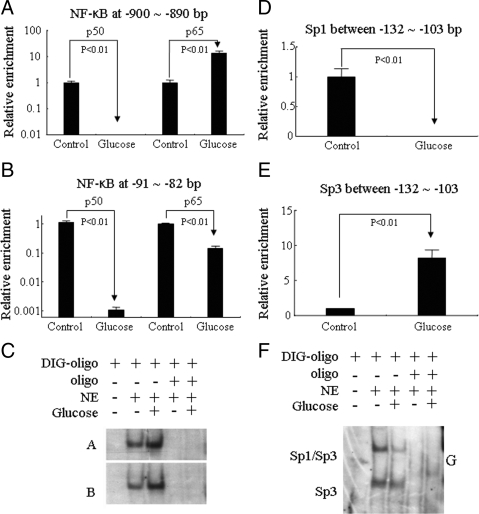
For NF-κB binding assay, high glucose induced a sharp decrease of p50 binding and 10.6-fold increase of p65 binding at −900 to −890 bp (Fig. 5A) and 107.7- and 7.1-fold decrease of p50 and p65 binding, respectively, at −91 to −82 bp (Fig. 5B). EMSA results showed that high glucose enhanced NF-κB binding activities to NF-κB-binding elements A (−900 to −890 bp) and B (−91 to −82 bp) (Fig. 5C). The corresponding unlabeled competitive probes targeting A and B regions competed for the NF-κB complexes and inhibited the binding processes (Fig. 5C). At the upstream of this NF-κB binding sites, high glucose induced a significant decrease of Sp1 binding (Fig. 5D) and a sharp increase of Sp3 binding at −132 to −103 bp (Fig. 5E). EMSA results also showed that Sp1-binding sequence (G element: −132 to −103 bp) formed two complexes (Sp1/Sp3 and Sp3) in basal condition, whereas high-glucose treatment significantly decreased Sp1/Sp3 complex and kept Sp3 without significant changes (Fig. 5F). These results were confirmed by showing that the corresponding unlabeled competitive probe targeting G region competed for the Sp1/Sp3 and Sp3 complexes and inhibited the binding process (Fig. 5F).
Figure 5.
Effect of glucose on binding of NF-κB and Sp1/Sp3 regulatory elements in predicted PRR promoter. Panels A and B, In vivo mapping of NF-κB by ChIP. Panel C, NF-κB EMSA and competitive EMSA. Panels D and E, In vivo mapping of Sp1 and Sp3 by ChIP. F, Sp1/Sp3 EMSA and competitive EMSA. Oligo, NF-κB probes to NF-κB binding elements A and B and Sp1 probes to Sp1 or Sp3 binding elements G as shown in Fig. 1. NE, Nuclear extract. Glucose (−), Control (5 mm d-glucose + 25 mm l-glucose); glucose (+), 30 mm d-glucose. ChIP assay is based on three independent experiments and EMSA is a representative of three experiments.
Discussion
All elements of the renin-angiotensin system are present in the glomeruli and mesangial cells (28,29,30). Increased production of angiotensinogen (31,32), renin (33), and angiotensin II (34) was also observed in cultured mesangial cells exposed to high glucose and in the glomeruli of STZ-induced diabetes rats. These reports together with our recent finding of up-regulation of PRR in renal glomeruli, and tubules in STZ-induced diabetes rat model (15) suggest a role for this receptor in the pathophysiology of kidney diseases. In the present study, we demonstrated that high glucose promotes the expression of PRR in mesangial cells through the enhancement of PKC-Raf-1-ERK and PKC-JNK-kinase pathways.
Previous studies suggested involvement of PRR in the development of diabetic nephropathy (11). However, little is known about the mechanism(s) by which high glucose regulates the expression of PRR. Delineation of the mechanisms involved in glucose-induced PRR expression will help better understanding of this receptor’s contribution to the pathophysiology of diabetes complications in the kidney and has the potential for development of new therapeutic tools for their management.
We demonstrated that PRR is constitutively expressed in RMCs, and this receptor expression is up-regulated in the presence of high glucose levels via dose- and time-dependent manner (14). Although our results showed a moderate up-regulation of PRR expression in the presence of high glucose, the net effects could be significant due to its powerful catalytic capacity in angiotensinogen conversion leading to more angiotensin II formation and also through its direct role of activating the intracellular MAPK pathway.
Our studies also confirmed the involvement of intracellular PKC, Raf-1, ERK1/2, and JNK signals in the regulation of PRR transcription because blockade of these pathways attenuated the glucose-induced expression of this receptor. Furthermore, we elucidated the interaction between these intracellular kinases that could influence expression of PRR. In the current study, high-glucose-induced membrane translocation of PKCα, -βI, and -γ and nuclear translocation of PKCδ. These results are consistent with previous reports of increased PKC activity in presence of high-glucose levels (29,35). Inhibition of conventional PKC and nPKC attenuated the glucose-induced activation of Raf-1, ERK1/2, and JNK, suggesting that PKCs are upstream regulators of this intracellular signaling cascade. Raf-1 inhibition significantly reduced the activation of ERK1/2 but not JNK in response to high glucose, suggesting that PRR up-regulation depends on two signaling pathways, namely PKC-Raf-1-ERK and PKC-JNK. Interestingly, inhibition of these signaling cascades produces more profound effects on PRR mRNA than its protein expression and could imply longer half-life of this receptor. In addition, we postulate that these inhibitory effects are mediated at the transcription level of this receptor. Several factors that influence the translational process from PRR mRNA to protein, such as mRNA modification, protein synthesis, and modification and protein degradation could contribute to the observed differences in the mRNA and protein expression of this receptor. Because inhibition of the PKC-Raf-1-ERK and PKC-JNK cascades does not completely block the PRR expression, it is possible that other cellular signal pathways could also contribute to regulation of this receptor expression in response to high-glucose exposure.
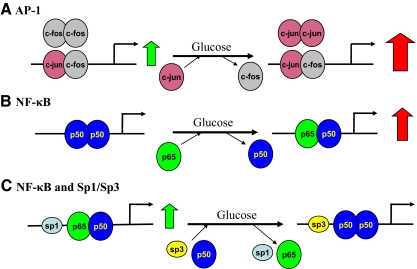
Our studies confirmed the involvement of NF-κB in glucose-induced PRR up-regulation because this process was blocked by inhibiting this factor. In the current study, high glucose induced an activation of NF-κB p65 (S536), which was suppressed by inhibition of PKC, Raf-1, MEK1/2, and JNK activities. Collectively these results strongly suggest that in the presence of high glucose, PKC, Raf-1, ERK1/2, and JNK influence the PRR transcription by enhancing the activity of NF-κB. These findings are further strengthened by ChIP and EMSA results (Fig. 6). The ChIP assay demonstrated that the distal PRR/NF-κB site far from the start site is functional in vivo. Two types of dimers (p65-p50 and p50-p50) are constitutively bound to this PRR/NF-κB site in mesangial cells. Glucose induces p50-p50 depolymerization and more p65-p50 assembles (Fig. 6B). Due to the positive regulatory activity of p65-p65 homodimer, PRR transcription is enhanced. EMSA results provide further support to our findings that the distal PRR/NF-κB site is enhanced by high-glucose treatment. In contrast, a silenced proximal NF-κB element is observed by using real-time ChIP assay (Fig. 6C). Although the in vitro EMSA result for this site shows high-glucose enhancement of NF-κB binding, this effect under the ideal condition does not recognize the interaction of adjoining upstream Sp1/Sp3. Previous studies confirmed this concept by documenting that some genes, such as inhibitory-κBα (36) and human immunodeficiency virus long-terminal repeat (37), have closely adjacent NF-κB regulatory regions and Sp1 sites in their promoters. The NF-κB p65 transcription factor and Sp1 have been shown to interact and such interaction is important for gene activation (36,37). In the setting of the PRR gene, NF-κB and Sp1 sites are closely present at a proximal regulatory region of the promoter. At upstream Sp1-binding sequence of proximal NF-κB sites, more inhibitory Sp3 transcription factors are bound in response to high glucose, which is confirmed, by in vivo ChIP assay and in vitro EMSA. The substitution of Sp1 by Sp3 and decreased p65 and p50 binding after high glucose exposure result in silencing of the proximal NF-κB site (Fig. 6C).
Figure 6.
Working model of AP-1, NF-κB, and Sp1/Sp3 in predicted PRR promoter. Large open and solid black arrows refer to constitutive and regulated expression, respectively.
In addition to NF-κB activation, our studies also demonstrated that glucose-induced PRR up-regulation can be blocked by AP-1 inhibition. This finding suggests that AP-1 is another factor involved in the PRR transcription regulation. AP-1 is the alias of c-Jun, which is a downstream target of JNK. Reports of JNK activation by chronic glucose treatment in mesangial cells are controversial (38,39,40). In our study, increased JNK phosphorylation was observed during chronic high-glucose exposure of cultured mesangial cells, and its phosphorylation was suppressed by PKC inhibition but not Raf-1 inhibition. Similar results were observed for c-Jun. High glucose promotes c-Jun phosphorylation, a process that can be suppressed by nPKC and JNK inhibition. These results confirm that in addition to PKC-Raf-ERK signaling, PKC-JNK-c-Jun signaling also contributes to glucose-induced PRR up-regulation and also suggests that AP-1 is a key regulator in this receptor transcription regulation in presence of high-glucose levels. These conclusions are further reinforced by ChIP and EMSA assay of AP-1. Four AP-1 sites were predicted in the PRR promoter. The results from in vitro EMSA confirmed high-glucose enhancement of AP-1 binding activities to all four AP-1-binding sequences in the predicted PRR promoter. Real-time ChIP mapping indicated that c-Jun and c-Fos are constitutively bound to AP-1 binding sites in the PRR promoter. Different assembly of c-Jun and c-Fos may form three types of dimers, c-Jun-c-Fos heterodimer and c-Jun-c-Jun and c-Fos-c-Fos homodimers. Due to lack of a transactive site, c-Fos homodimer is nonfunctional. Under long-term effects of high-glucose exposure, AP-1 binding sites assume predominant c-Jun-c-Jun dimers to up-regulate transcription of PRR (Fig. 6A). At proximal AP-1 site (−147 to −138 bp), c-Jun-c-Fos is the predominant dimer.
Based on these studies, we conclude that in cultured mesangial cells, high glucose up-regulates the expression of PRR through mechanisms dependent on PKC-Raf-1-ERK1/2-NF-κB, PKC-JNK-NF-κB, and PKC-JNK-AP-1 (c-Jun) signaling pathways. Understanding the mechanisms involved in the regulation of PRR could help in better elucidation of pathophysiology of kidney disease, particularly in the presence of hyperglycemic states.
Footnotes
This work was supported by Grants DK-078757 and HL091535 from the National Institutes of Health (to H.M.S.).
Disclosure Summary: J.H. and H.M.S. have nothing to declare.
First Published Online May 5, 2010
Abbreviations: AP, Activator protein; ChIP, chromatin immunoprecipitation; Ct, cycle threshold; DIG, digoxigenin; JNK, c-Jun N-terminal kinase; MEK, MAPK kinase; NF-κB, nuclear factor-κB; nPKC, novel PKC; PKC, protein kinase C; PRR, (pro)renin receptor; RMC, rat mesangial cell; STZ, streptozocin.
References
- Carey RM, Siragy HM 2003 The intrarenal renin-angiotensin system and diabetic nephropathy. Trends Endocrinol Metab 14:274–281 [DOI] [PubMed] [Google Scholar]
- Carey RM, Siragy HM 2003 Newly recognized components of the renin-angiotensin system: potential roles in cardiovascular and renal regulation. Endocr Rev 24:261–271 [DOI] [PubMed] [Google Scholar]
- Nguyen G, Delarue F, Berrou J, Rondeau E, Sraer JD 1996 Specific receptor binding of renin on human mesangial cells in culture increases plasminogen activator inhibitor-1 antigen. Kidney Int 50:1897–1903 [DOI] [PubMed] [Google Scholar]
- Nguyen G, Delarue F, Burcklé C, Bouzhir L, Giller T, Sraer JD 2002 Pivotal role of the renin/prorenin receptor in angiotensin II production and cellular responses to renin. J Clin Invest 109:1417–1427 [DOI] [PMC free article] [PubMed] [Google Scholar]
- Ludwig J, Kerscher S, Brandt U, Pfeiffer K, Getlawi F, Apps DK, Schägger H 1998 Identification and characterization of a novel 9.2-kDa membrane sector-associated protein of vacuolar proton- ATPase from chromaffin granules. J Biol Chem 273:10939–10947 [DOI] [PubMed] [Google Scholar]
- Demirci FY, White NJ, Rigatti BW, Lewis KF, Gorin MB 2001 Identification, genomic structure, and screening of the vacuolar proton-ATPase membrane sector-associated protein M8–9 gene within the COD1 critical region (Xp11.4). Mol Vis 7:234–239 [PubMed] [Google Scholar]
- Burcklé CA, Jan Danser AH, Müller DN, Garrelds IM, Gasc JM, Popova E, Plehm R, Peters J, Bader M, Nguyen G 2006 Elevated blood pressure and heart rate in human renin receptor transgenic rats. Hypertension 47:552–556 [DOI] [PubMed] [Google Scholar]
- Kaneshiro Y, Ichihara A, Sakoda M, Takemitsu T, Nabi AH, Uddin MN, Nakagawa T, Nishiyama A, Suzuki F, Inagami T, Itoh H 2007 Slowly progressive, angiotensin II-independent glomerulosclerosis in human (pro)renin receptor-transgenic rats. J Am Soc Nephrol 18:1789–1795 [DOI] [PubMed] [Google Scholar]
- Takahashi H, Ichihara A, Kaneshiro Y, Inomata K, Sakoda M, Takemitsu T, Nishiyama A, Itoh H 2007 Regression of nephropathy developed in diabetes by (pro)renin receptor blockade. J Am Soc Nephrol 18:2054–2061 [DOI] [PubMed] [Google Scholar]
- Ichihara A, Sakoda M, Kurauchi-Mito A, Kaneshiro Y, Itoh H 2008 Involvement of (pro)renin receptor in the glomerular filtration barrier. J Mol Med 86:629–635 [DOI] [PMC free article] [PubMed] [Google Scholar]
- Ichihara A, Hayashi M, Kaneshiro Y, Suzuki F, Nakagawa T, Tada Y, Koura Y, Nishiyama A, Okada H, Uddin MN, Nabi AH, Ishida Y, Inagami T, Saruta T 2004 Inhibition of diabetic nephropathy by a decoy peptide corresponding to the “handle” region for nonproteolytic activation of prorenin. J Clin Invest 114:1128–1135 [DOI] [PMC free article] [PubMed] [Google Scholar]
- Huang Y, Wongamorntham S, Kasting J, McQuillan D, Owens RT, Yu L, Noble NA, Border W 2006 Renin increases mesangial cell transforming growth factor-β1 and matrix proteins through receptor-mediated, angiotensin II-independent mechanisms. Kidney Int 69:105–113 [DOI] [PubMed] [Google Scholar]
- Matavelli LC, Huang J, Siragy HM 2010 (Pro)renin receptor contributes to diabetic nephropathy through enhancing renal inflammation. Clin Exp Pharmacol Physiol 37:277–282 [DOI] [PMC free article] [PubMed] [Google Scholar]
- Huang J, Siragy HM 2009 Glucose promotes the production of interleukine-1β and cyclooxygenase-2 in mesangial cells via enhanced (pro)renin receptor expression. Endocrinology 150:5557–5565 [DOI] [PMC free article] [PubMed] [Google Scholar]
- Siragy HM, Huang J 2008 Renal (pro)renin receptor upregulation in diabetic rats through enhanced angiotensin AT1 receptor and NADPH oxidase activity. Exp Physiol 93:709–714 [DOI] [PMC free article] [PubMed] [Google Scholar]
- Herbert JM, Augereau JM, Gleye J, Maffrand JP 1990 Chelerythrine is a potent and specific inhibitor of protein kinase C. Biochem Biophys Res Commun 172:993–999 [DOI] [PubMed] [Google Scholar]
- Chao MD, Chen IS, Cheng JT 1998 Inhibition of protein kinase C translocation from cytosol to membrane by chelerythrine. Planta Med 64:662–663 [DOI] [PubMed] [Google Scholar]
- Gschwendt M, Müller HJ, Kielbassa K, Zang R, Kittstein W, Rincke G, Marks F 1994 Rottlerin, a novel protein kinase inhibitor. Biochem Biophys Res Commun 199:93–98 [DOI] [PubMed] [Google Scholar]
- Favata MF, Horiuchi KY, Manos EJ, Daulerio AJ, Stradley DA, Feeser WS, Van Dyk DE, Pitts WJ, Earl RA, Hobbs F, Copeland RA, Magolda RL, Scherle PA, Trzaskos JM 1998 Identification of a novel inhibitor of mitogen-activated protein kinase kinase. J Biol Chem 273:18623–18632 [DOI] [PubMed] [Google Scholar]
- Han Z, Boyle DL, Chang L, Bennett B, Karin M, Yang L, Manning AM, Firestein GS 2001 c-Jun N-terminal kinase is required for metalloproteinase expression and joint destruction in inflammatory arthritis. J Clin Invest 108:73–81 [DOI] [PMC free article] [PubMed] [Google Scholar]
- Lackey K, Cory M, Davis R, Frye SV, Harris PA, Hunter RN, Jung DK, McDonald OB, McNutt RW, Peel MR, Rutkowske RD, Veal JM, Wood ER 2000 The discovery of potent cRaf1 kinase inhibitors. Bioorg Med Chem Lett 10:223–226 [DOI] [PubMed] [Google Scholar]
- Tobe M, Isobe Y, Tomizawa H, Nagasaki T, Takahashi H, Fukazawa T, Hayashi H 2003 Discovery of quinazolines as a novel structural class of potent inhibitors of NF-κB activation. Bioorg Med Chem 11:383–391 [DOI] [PubMed] [Google Scholar]
- Hahm ER, Cheon G, Lee J, Kim B, Park C, Yang CH 2002 New and known symmetrical curcumin derivatives inhibit the formation of Fos-Jun-DNA complex. Cancer Lett 184:89–96 [DOI] [PubMed] [Google Scholar]
- Hahm ER, Gho YS, Park S, Park C, Kim KW, Yang CH 2004 Synthetic curcumin analogs inhibit activator protein-1 transcription and tumor-induced angiogenesis. Biochem Biophys Res Commun 321:337–344 [DOI] [PubMed] [Google Scholar]
- Park CH, Lee JH, Yang CH 2005 Curcumin derivatives inhibit the formation of Jun-Fos-DNA complex independently of their conserved cysteine residues. J Biochem Mol Biol 38:474–480 [DOI] [PubMed] [Google Scholar]
- Balasubramanian S, Eckert RL 2007 Curcumin suppresses AP1 transcription factor-dependent differentiation and activates apoptosis in human epidermal keratinocytes. J Biol Chem 282:6707–6715 [DOI] [PubMed] [Google Scholar]
- Babazono T, Kapor-Drezgic J, Dlugosz JA, Whiteside C 1998 Altered expression and subcellular localization of diacylglycerol-sensitive protein kinase C isoforms in diabetic rat glomerular cells. Diabetes 47:668–676 [DOI] [PubMed] [Google Scholar]
- Atiyeh BA, Arant Jr BS, Henrich WL, Seikaly MG 1995 In vitro production of angiotensin II by isolated glomeruli. Am J Physiol 268:F266–F272 [DOI] [PubMed] [Google Scholar]
- Becker BN, Yasuda T, Kondo S, Vaikunth S, Homma T, Harris RC 1998 Mechanical stretch/relaxation stimulates a cellular renin-angiotensin system in cultured rat mesangial cells. Exp Nephrol 6:57–66 [DOI] [PubMed] [Google Scholar]
- Andrade MC, Quinto BM, Carmona AK, Ribas OS, Boim MA, Schor N, Casarini DE 1998 Purification and characterization of angiotensin I-converting enzymes from mesangial cells in culture. J Hypertens 16:2063–2074 [DOI] [PubMed] [Google Scholar]
- Singh R, Singh AK, Alavi N, Leehey DJ 2003 Mechanism of increased angiotensin II levels in glomerular mesangial cells cultured in high glucose. J Am Soc Nephrol 14:873–880 [DOI] [PubMed] [Google Scholar]
- Anderson S, Jung FF, Ingelfinger JR 1993 Renal renin-angiotensin system in diabetes: functional, immunohistochemical, and molecular biological correlations. Am J Physiol 265:F477–F486 [DOI] [PubMed] [Google Scholar]
- Vidotti DB, Casarini DE, Cristovam PC, Leite CA, Schor N, Boim MA 2004 High glucose concentration stimulates intracellular renin activity and angiotensin II generation in rat mesangial cells. Am J Physiol Renal Physiol 286:F1039–F1045 [DOI] [PubMed] [Google Scholar]
- Singh R, Singh AK, Leehey DJ 2005 A novel mechanism for angiotensin II formation in streptozotocin-diabetic rat glomeruli. Am J Physiol Renal Physiol 288:F1183–F1190 [DOI] [PubMed] [Google Scholar]
- Whiteside CI, Dlugosz JA 2002 Mesangial cell protein kinase C isozyme activation in the diabetic milieu. Am J Physiol Renal Physiol 282:F975–F980 [DOI] [PubMed] [Google Scholar]
- Chiao PJ, Miyamoto S, Verma IM 1994 Autoregulation of IκBα activity. Proc Natl Acad Sci USA 91:28–32 [DOI] [PMC free article] [PubMed] [Google Scholar]
- Perkins ND, Agranoff AB, Pascal E, Nabel GJ 1994 An interaction between the DNA-binding domains of RelA(p65) and Sp1 mediates human immunodeficiency virus gene activation. Mol Cell Biol 14:6570–6583 [DOI] [PMC free article] [PubMed] [Google Scholar]
- Ingram AJ, Ly H, Thai K, Kang MJ, Scholey JW 1999 Mesangial cell signaling cascades in response to mechanical strain and glucose. Kidney Int 56:1721–1728 [DOI] [PubMed] [Google Scholar]
- Kang MJ, Wu X, Ly H, Thai K, Scholey JW 1999 Effect of glucose on stress-activated protein kinase activity in mesangial cells and diabetic glomeruli. Kidney Int 55:2203–2214 [DOI] [PubMed] [Google Scholar]
- Wilmer WA, Cosio FG 1998 DNA binding of activator protein-1 is increased in human mesangial cells cultured in high glucose concentrations. Kidney Int 53:1172–1181 [DOI] [PubMed] [Google Scholar]


