

Abstract
C57BL/6J (B6) and CAST/EiJ (CAST), the inbred strain derived from M. musculus Castaneus, differ in nutrient intake behaviors, including dietary fat and carbohydrate consumption in a two-diet choice paradigm. Significant quantitative trait loci (QTL) for carbohydrate (Mnic1) and total energy intake (Kcal2) are present between these strains on chromosome (Chr) 17. Here we report the refinement of the Chr 17 QTL in a subcongenic strain of the B6.CAST-D17Mit19–D17Mit91 congenic mice described previously. This new subcongenic strain possesses CAST Chr 17 donor alleles from 4.8 to 45.4 Mb on a B6 background. Similar to CAST, the subcongenic mice exhibit increased carbohydrate and total calorie intake per body weight, while fat intake remains equivalent. Unexpectedly, this CAST genomic segment also confers two new physical activity phenotypes: 22% higher spontaneous physical activity levels and significantly increased voluntary wheel running activity, compared with the parental B6 strain. Overall, these data suggest that gene(s) involved in carbohydrate preference and increased physical activity are contained within the proximal region of Chr 17. Interval-specific microarray analysis in hypothalamus and skeletal muscle revealed differentially expressed genes within the subcongenic region including neuropeptide W (Npw), glyoxalase I (Glo1), cytochrome P450, family 4, subfamily f, polypeptide 1 (Cyp4f15), phospholipase A2, group VII (Pla2g7), and phosphodiesterase 9a (Pde9a). This subcongenic strain offers a unique model for dissecting the contributions and possible interactions among genes controlling food intake and physical activity, key components of energy balance.
Keywords: Food intake, physical activity, QTL mapping, mouse Chromosome 17, congenic strain, microarray
Introduction
The heritability of food preferences in rodents and humans has been recognized for more than a decade (Faith et al, 1999; Rankinen et al, 2006; Reed et al, 1997). Strong evidence is accumulating that genetic factors are involved in determining individual differences in nutrient intake traits, particularly with regard to fat and carbohydrates. In humans using dietary recall, genome-wide linkage scans of energy and macronutrient intakes have identified several chromosomal loci associated with dietary energy and macronutrient intakes (Cai et al, 2004, 2006; Choquette et al, 2008; Collaku et al, 2004). However, identifying causative genes in these regions in humans is challenging because power calculations would suggest the need for very large sample sizes (Wareham et al., 2008). Laboratory animals are more amenable for genetic mapping of complex traits because two strains that differ in the trait of interest can be mated to produce F2 intercross or N2 backcross progeny. In such mapping populations, statistically significant associations between phenotype and genotype point to chromosomal locations of genes influencing the trait.
Our laboratory has characterized the natural variation that occurs in macronutrient diet selection in mouse inbred strains (Smith et al, 2000). Based on these results, two phenotypically divergent strains were chosen as a genetic model. Quantitative trait loci (QTL) mapping, performed in a C57BL/6J (B6) × CAST/Ei (CAST) intercross population (F2), identified significant QTL for nutrient intake (Smith Richards et al, 2002). We found QTLs for the macronutrient intake of carbohydrate (Mnic1–3) (Chrs 6, 17, and X), all conferred by the CAST allele. With respect to fat intake (Mnif1–3), the B6 allele was responsible for two QTLs on Chrs 8 and X, and the CAST allele determined a locus on Chr 18. Total kcal (Kcal1–2) (Chrs 2, 17 and 18) (Smith Richards et al, 2002), and total food volume (Tfv1) (Chr 17) (Kumar et al, 2008) were linked to the CAST allele with the exception of Kcal3 (B6). These QTLs provide strong evidence for multiple genetic controls on macronutrient-specific and total calorie intake.
Once a trait has been located in a chromosomal sub-region, congenic mouse strains can be used to isolate and confirm the QTL, as shown for nutrient intake (Kumar et al, 2007), bone density (Delahunty et al, 2006); growth, body weight and fatness (Farber, Medrano, 2007; Jerez-Timaure et al, 2005; Warden et al, 2004), pain phenotypes (Raber et al, 2006), and diabetes (Leiter et al, 2006), to name just a few. The current study is focused on a region of mouse Chromosome 17 encompassing QTLs for increased carbohydrate and total energy intake. Thus we constructed a congenic mouse strain B6.CAST-D17Mit19–D17Mit91 (B6.CAST-17) by introgressing M. musculus castaneus (CAST/Ei) alleles in the B6 background (Kumar et al, 2007). This congenic strain captured the overlapping chromosome 17 QTLs for macronutrient intake-carbohydrate 1 (Mnic1), kilocalorie intake 2 (Kcal2) (Smith Richards et al, 2002), and total food volume 1 (Tfv1) (Kumar et al, 2008). These QTL were then verified by phenotypic studies showing that the original B6.CAST-17 congenic mice consumed 27% more carbohydrate, 17% more total calories, and 22% higher food volume per body weight (Kumar et al, 2007), compared with littermate, wild-type B6 controls. The equivalent fat intake between the homozygous congenic and B6 mice underscores the nutrient-specific effects of this genetic locus. The B6.C-17 congenic segment spans ~60.3 Mb and contains an estimated 1138 genes (NCBI - Build 36.1).
To narrow this nutrient intake QTL and to identify candidate genes, we constructed a subcongenic strain, possessing a 40.1 Mb interval. This strain retained the nutrient intake traits of the original congenic strain and also revealed a co-segregating physical activity phenotype (Kumar et al, 2007). We hypothesized that expression profiling would reveal candidate genes causally related to the increased consumption of carbohydrate and total calories, as well as to increased physical activity. Thus microarray analyses were performed to compare gene expression between the B6.CAST-17.1 subcongenic and B6 strains in hypothalamus and skeletal muscle. The hypothalamus was selected because it is important in the regulation of metabolic and behavioral feeding phenotypes. Skeletal muscle was selected for its role in physical activity endurance as well as in determining energy balance by communicating with the brain through neural connections, hormones, or metabolites (Berthoud and Lenard, 2008).
Materials and methods
Mouse strain development
All protocols for animal housing and experimental use were approved by the PBRC Institutional Animal Care and Use Committee. The original B6.CAST-D17Mit19–D17Mit91 (B6.CAST-17) congenic has been described previously (Kumar et al, 2007, 2008). The new subcongenic line reported here, B6.CAST-D17Mit19–D17Mit50, was generated by back-crossing the original congenic with the B6 strain to yield F1 heterozygous mice. F1 mice were then intercrossed to generate F2 mice that were genotyped using published microsatellite markers. Mice with appropriate recombinant regions were bred to homozygosity. The three genotypes for the subcongenic region were designated as: homozygous subcongenic (HOMO), heterozygous subcongenic (HET), and wild-type B6 (WT). WT mice of the B6 parental strain were littermate controls derived from the (B6 × B6.CAST-17.1)F2 mice. The use of littermate controls to test the phenotypic effect of a congenic segment is extremely important for overcoming the problems of background heterogeneity as well as the effects of litter or other environmental variables.
Genotyping
Genomic DNA was isolated from mouse tail clips using NaOH/Tris or phenol/chloroform extraction. Mice were genotyped using simple sequence length polymorphisms (SSLP) markers (Integrated DNA Technologies, Coralville IA). PCR products were separated using 4% NuSieve (Bio Whittaker Molecular Applications, Rockland, ME) gel electrophoresis and visualized with ethidium bromide.
Nutrient intake
We determined macronutrient diet selection as previously described (Smith Richards et al, 2002). At 5–6 wk of age, male mice were weighed and singly-housed in polycarbonate cages until body weight returned to baseline. At 8 wks of age, mice were transferred to individual housing in stainless steel hanging cages with wire mesh floors and polyvinylchloride nesting tubes to reduce time spent on wire flooring. After 7–10 d adaptation to these new housing conditions, animals were provided for 10 days with a choice between two diet mixtures: fat/protein (F/P; vegetable shortening and casein) and carbohydrate/protein (C/P; corn starch, powdered sugar, and casein). The protein composition of both diets was equivalent (22% of energy) and the balance of calories for each was contributed by fat or carbohydrate (78%). Both diets were supplemented with vitamins, minerals, and cellulose. Food intake including all spillage was measured daily. At the end of the choice macronutrient diet study, mice were fed chow for two wks and then placed in the metabolic chambers.
Body composition
Body composition was measured immediately before and after the 10 d diet selection study (see below) by nuclear magnetic resonance (NMR) using a Bruker Mice Minispec NMR analyzer (Bruker Optics, Inc., Billerica, MA). Lean mass and liquid mass were summed to produce the variable fat free mass (FFM) used for analysis.
Indirect calorimetry and physical activity
Indirect calorimetry and spontaneous physical activity were measured using the Comprehensive Laboratory Animal Monitoring System (CLAMS; Columbus Instruments, Columbus, OH). At 12–14 weeks of age, mice were housed individually in the Oxymax calorimeter chambers at 25 deg. C, with a 12:12-h light-dark cycle and ad libitum access to rodent chow and tap water. Animals were acclimated to the metabolic cages for 2 d prior to 5 d of data collection. Oxygen consumption (VO2) and carbon dioxide respiration (VCO2) and respiratory exchange ratio (RER) were measured by indirect calorimetry with an air flow of 0.6 L/min. Energy expenditure (kJ/h) was calculated using VO2 (VO2 × [3.815 + (1.232 × RER)] × 4.1868) (Albarado et al, 2004). Percent relative cumulative frequency (PRCF) curves were calculated for energy expenditure (Riachi et al, 2004). The analysis of PRCF curves is a method that facilitates the group comparisons and interpretation of a range of indirect calorimetry values contained in large data sets. As such, PRCF provides a tool for visualizing small differences between groups in the number of data points collected. A difference in EE across the diurnal period would appear as a parallel shift of the S-shaped cumulative frequency curve. General physical activity was determined using an infared beam-operated sensor system that detected x- and z-axis activity. This system measures both total counts (every time a beam is broken) and ambulatory counts (every time a new beam is broken). An X-total (X-TOT) count is registered when the animal moves horizontally more than 0.5 in. and is representative of small-scale, repetitive activities such as scratching and grooming. The X-ambulatory count (X-AMB) measures actual locomotion by registering a count only when the animal breaks a new beam. A Z-total (Z-TOT) count is registered when 1.5 in. of vertical movement occurs, i.e., rearing.
Wheel running activity
Voluntary running wheel activity was recorded with an automated running wheel system (MiniMitter, Sunriver, OR). Mice were allowed free access to the wheel 24 h/day. At 9–11 wk of age, sib-mated B6.CAST-17.1 subcongenic and wild-type B6 mice were habituated to the wheel cages for 3 wks before the data collection period, which lasted ~2 wks. A review of the literature indicates that habituation to wheel running in rodents can range up to 21 d because animals require learning or practice to establish a stable pattern (Sherwin, 1998). The cages (16 cm × 31 cm) are fitted with an anodized aluminum wheel (diameter 23 cm and 0.7225 m/revolution), and a magnetic sensor to measure activity. Total wheel revolutions were saved to a data file every 60 s using the Vital View Data Acquisition System. Total daily distance (km), total time spent running (min), and peak speed (maximum revolutions per min) were analyzed using Microsoft Exel. Average daily running speed (m/min) was calculated by dividing distance by duration.
RNA isolation and cDNA synthesis
cDNA was synthesized from 1 µg of RNA using superscript II reverse transcriptase (Invitrogen) and used for real time qPCR.
Microarray: experimental design and analysis
Chow-fed mice were food deprived at 1300 (during the light period) and euthanized 4 h later. Genome-wide gene expression was compared between B6.CAST-17.1 homozygous subcongenic and littermate B6 mice in two tissues. The gastrocnemius muscle was dissected from the carcass, cleaned of fat, quickly frozen in liquid nitrogen, and later stored at −80 deg. The hypothalamus was carefully lifted from the base of the brain using the curved edge of inverted forceps, based on visual landmarks. Individual RNA samples (3 per strain per tissue) were labeled and hybridized according to the manufacturer’s protocol. Thus, three biological replicates were analyzed for each strain. Total RNA was isolated from hypothalamus and skeletal muscle using TRIzol (TRI reagent, Molecular Research center), and the quality determined using an Agilent Bioanalyzer 2100. RNA (1 µg) transcribed to DIG-labeled cRNA using AB Chemiluminescent RT-IVT Kit v2.0. Microarray hybridization (using 10 µg of fragmented, DIG-labeled cRNA), processing, chemiluminescence detection, imaging, auto-gridding, and image analysis were performed according to AB protocols, using the 1700 Chemiluminescent Microarray Analyzer Software v. 1.0.3. The Applied Biosystems (AB) Mouse Genome Survey Microarray was used which contains ~34,000 features including a set of ~1000 controls. Each microarray uses 32,996 probes targeted to 32,381 curated genes representing 44,498 transcripts. The AB Expression system software was used to extract assay signal and signal-to-noise ratio values from the images. Signal intensities across microarrays were normalized using the quantile-quantile method based on R-script (Bolstad et al, 2003; http://www.bioconductor.org). Features with a signal/noise value of ≥3.0 and quality flag value of <5000 were considered “detected” and subjected to analysis. The transformed data were analyzed by ANOVA using Spotfire DecisionSite Software v16.0 (Spotfire, Somerville, MA). Differential expression was defined as a fold change ≥1.5 and a P-value of ≤ 0.05. A signal transduction gene of interest, with borderline significance (P = 0.053), was subsequently validated in qPCR (phosphodiesterase 9a). These data were submitted to the NCBI Gene Expression Omnibus (GSE10517).
Real-time quantitative PCR (qPCR)
qRT-PCR reactions were carried out using Taqman and SYBR green detection methods (Applied Biosystems, Foster City, CA). The primers and probes used for qPCR were designed to amplify regions that exclude any known expressed sequence SNPs. qPCR was performed in an ABI Prism 7900HT sequence detection system (Applied Biosystems, Foster City, CA) using SYBR green and gene specific primers. Relative mRNA levels were determined in duplicate samples using a standard curve generated by pool of RNA samples and normalized to cyclophilin.
Statistics
The effect of genotype on nutrient intake, metabolic parameters, and physical activity was determined by ANOVA. Wheel data expressed as counts by day were analyzed by ANOVA with repeated measures using a mixed model with genotype as the between-group factor and day as the within-group factor. When a main effect was observed, individual comparisons were evaluated using Tukey’s protected t-test.
Results
Construction of the B6.CAST-17.1 subcongenic strain
Figure 1 illustrates the CAST/Ei donor region introgressed in the original congenic and subcongenic lines. Fine-mapping has determined that the minimum subcongenic segment, with known CAST genotype, extends from proximal marker D17Mit19 at 4.8 Mb to distal marker D17Mit50 at 45.4Mb. The flanking interval proximal to D17Mit19 is uncharacterized. The external distal marker is D17Mit107 (B6), and the small interval between D17Mit50 and D17Mit107 is of unknown genotype. Thus we have reduced the Chr 17 QTL/CAST congenic segment from a 60.3 Mb region (estimated to include ~1134 genes) to ~40.6 Mb (~854 genes).
FIG. 1.

Chromosome 17 and the position of the B6.CAST-17.0 (original congenic) and B6.CAST-17.1 subcongenic intervals responsible for increased carbohydrate and total energy intake, and increased physical activity. The BC-17.1 subcongenic strain carries 40.6 Mb of CAST donor DNA on proximal Chr 17 in a B6 background. The donor segment extends from D17Mit19 at 4.8Mb to D17Mit50 at 45.4Mb. The external distal marker is D17Mit107 (B6). Based on phenotypic analyses, the gene(s) responsible for the QTL lies between 4,804,477 and 45,496,289 bp on the physical map of mouse Chr 17, containing an estimated 869 genes (NCBI – Build 36.1). The gray shaded areas represent yet undefined regions of CAST- or B6-derived genomic DNA. FI, food intake; BW, body weight; SPA, spontaneous physical activity.
Body weight and body composition
Baseline body weights of 8-wk-old homozygous B6 and B6.CAST-17.1 subcongenic mice were similar at the beginning of the 10-day phenotyping period (Table 1). Body composition (Table 2) was similar in the B6.CAST-17.1 homozygous congenic and wild-type B6 mice one day before, and immediately after 10 d access to the macronutrient selection diet.
Table 1.
Phenotypic data for B6.CAST-17.1 subcongenic mice
| HOMO (n = 14) |
HET (n = 12) |
WT (n = 20) |
|
|---|---|---|---|
| Baseline BW, g | 21.7 ± 0.4a | 22.7 ± 0.3a | 22.0 ± 0.3a |
| Total kcal per 20 g BW | 103 ± 4a | 97 ± 2ab | 93 ± 2a |
| C/P kcal per 20 g BW | 58 ± 3a | 49 ± 4ab | 40 ± 4b |
| F/P kcal per 20 g BW | 45 ± 4a | 48 ± 4a | 53 ± 4a |
| Total food volume (g) per 20 g BW |
23.5 ± 0.8a | 21.7 ± 0.6ab | 20.0 ± 0.6b |
10 d sums of food kcal consumed from a choice between the carbohydrate/protein (C/P) and fat/protein (F/P) diets. Genotype of subcongenic donor region: HOMO = homozygous CAST; HET = heterozygous CAST; WT = wild-type B6. BW = body weight. Values without common letters are significantly different at P < 0.05 (total kcal) or P < 0.01 (C/P kcal & total food volume).
Table 2.
Body composition data for B6.CAST-17.1 mice.
| HOMO (n = 14) |
WT (n = 20) |
|
|---|---|---|
| % Fat mass | ||
| Before diet | 10 ± 0.4 | 11 ± 0.4 |
| After diet | 10 ± 0.5 | 10 ± 0.4 |
| % Muscle mass | ||
| Before diet | 87 ± 0.4 | 86 ± 0.4 |
| After diet | 87 ± 0.5 | 86 ± 0.4 |
| FFM (Fat free mass) | ||
| Before diet | 17 ± 0.3 | 17 ± 0.3 |
| After diet | 19 ± 0.2 | 19 ± 0.3 |
Effects of subcongenic genotype on body composition in mice at baseline and after 10 d access to 2-choice macronutrient diet. HOMO = homozygous CAST donor region; WT = wild-type B6.
Macronutrient diet selection
The cumulative calorie intake over 10 days, adjusted for body weight, was HOMO > HET = WT (Table 1). Specifically, the homozygous B6.CAST-17 strain consumed, per body weight, 9% more total calories and 30% more carbohydrate/protein calories when compared with wild-type B6 mice. A robust phenotypic effect of the donor segment to increase carbohydrate intake, compared with wild-type B6, was evident in both the congenic (27%) (Kumar et al, 2007) and subcongenic (30%) mice. By contrast, total kcal intake per body weight was slightly lower in subcongenic mice (9%) when compared with the original congenic strain (17%), suggesting that one or more genes in original segment are responsible for altering nutrient intake or metabolism through gene-gene interactions. The lack of a genotype effect on fat/protein (F/P) intake emphasizes the nutrient-specific effects of this genetic locus. Overall, there were significant effects of genotype, with body weight as covariate, on carbohydrate/protein (C/P) kcal [F(2, 42) = 5.35, P < 0.01], total kcal [F(2, 42) = 4.56, P < 0.05], and total gm intake [F(2, 42) = 7.29, P < 0.005] but not on F/P kcal [F(2, 42) = 1.45, P = 0.24].
Indirect calorimetry
On a standard chow diet, B6.CAST-17.1 subcongenic mice showed no difference across the 24 h period in their energy expenditure (EE) [F (1,28) = 1.18, P = 0.29] (Fig. 2A) or differential utilization of carbohydrates or fats as indicated by the RER [F(1,28) = 0.90, P = 0.35] (Fig. 2C) compared to wild-type B6 mice. A comparison of the PRCF curves for EE revealed increased EE values in B6.CAST-17.1 mice compared with B6 mice (Fig. 2B). Specifically, the S-shaped cumulative frequency curve was shifted slightly to the right during their active period, represented by the upper portion of the curve (REE + EE), as compared with their inactive period illustrated by the lower end of the curve (REE). This finding is consistent with the higher physical activity of B6.CAST-17.1 mice during the dark period, thus reflecting the difference in activity-induced EE.
FIG. 2.
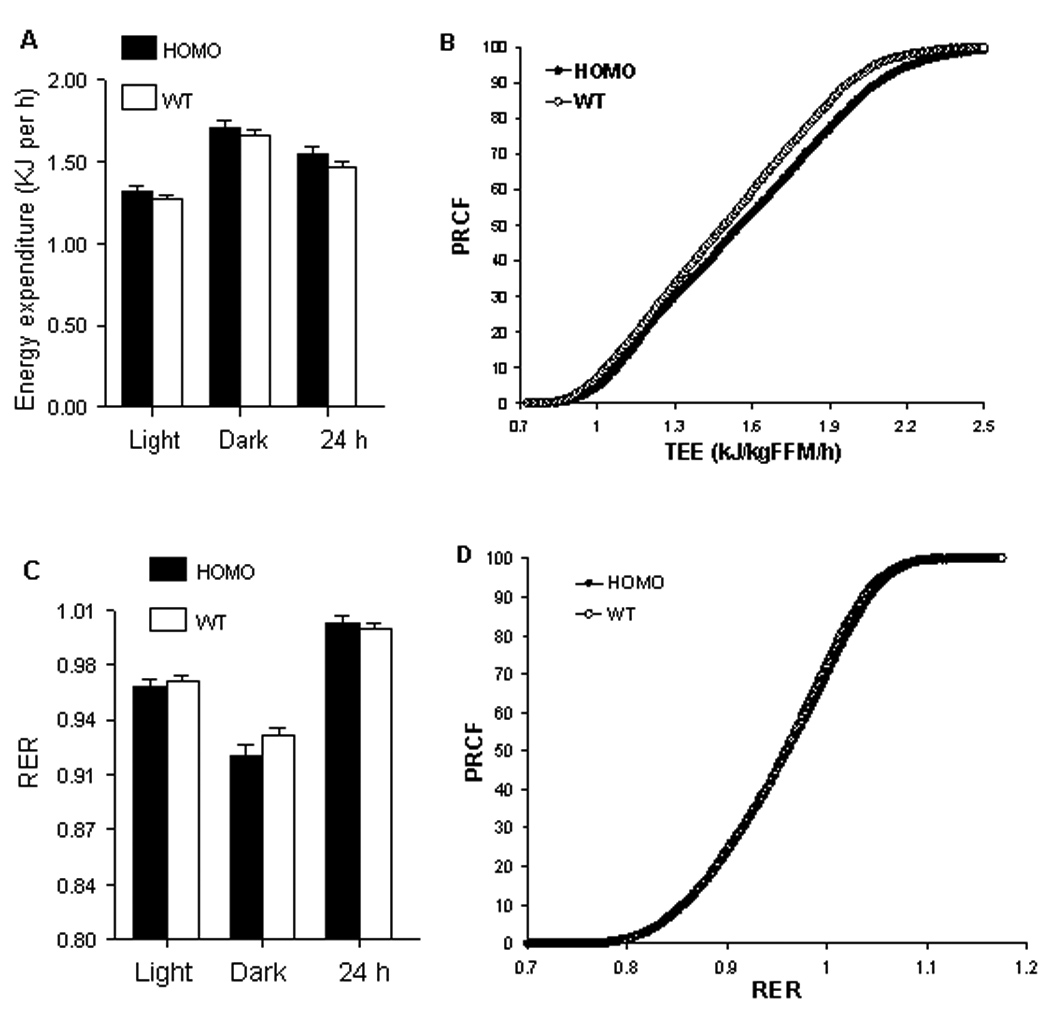
(A) Total energy expenditure (TEE) and (C) respiratory exchange ratio (RER) obtained by indirect calorimetry for 12 h light, 12 h dark, and 24 h total periods. (B, D) Plots of percent relative cumulative frequency (PRCF) of TEE and RER values, respectively. Each PRCF curve represents the data pooled from all mice (n=15) within a genotype (~4600 data points per curve), i.e., in chow-fed B6.CAST-D17Mit19–D17Mit50 homozygous (HOMO) and wild-type B6 (WT) subcongenic mice.
Spontaneous locomotor activity
The B6.CAST-17.1 subcongenic mice exhibited significantly increased spontaneous locomotor activity, as measured by X-TOT counts during the light (subcongenic, 9783 ± 802 counts; wild-type B6, 7385 ± 610 counts; P < 0.05) and dark (subcongenic, 31961 ± 2658 counts; wild-type B6, 25066 ± 1862 counts; P < 0.05) periods. Subcongenic mice also displayed significantly higher X-AMB counts during the light (subcongenic, 4661 ± 395 counts; wild-type B6, 3604 ± 233 counts; P < 0.05) and dark (subcongenic, 19764 ± 2262 counts; wild-type B6, 14933 ± 954 counts; P < 0.05) periods (Fig. 3. No genotype effects on rearing activity (Z-TOT) were observed.
FIG. 3.
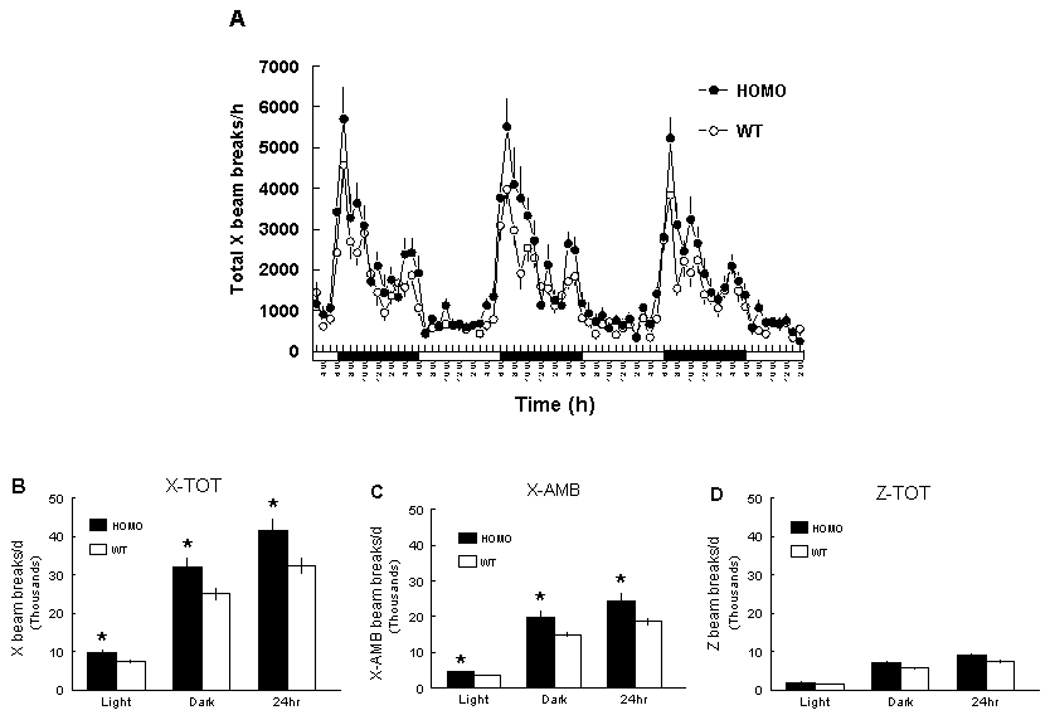
(A & B) Spontaneous physical activity (X-total counts) of B6.CAST-17.1 homozygous (HOMO) and wild-type B6 (WT) subcongenic mice. In “A”, the hourly data are presented, as recorded on three successive days following 2 d of acclimation to the activity chambers. In “B”, the data are presented as the mean of 3 d for each of three activity parameters (X-TOT, X-AMB, and Z-TOT) during the lights-on (0600–1800) or dark (1800-0600) periods. An X-total (X-TOT) count measures horizontal movement >0.5 in. and is representative of small-scale, repetitive activities such as scratching and grooming. The X-ambulatory count (X-AMB) measures actual locomotion in the horizontal plane. A Z-total (Z-TOT) count represents vertical movement, i.e., rearing. n = 15 mice per genotype. *P <0.05.
Voluntary wheel running
Following acclimation, there was a significant genotype effect on voluntary running wheel activity from days 25–37 as measured by total daily distance [F(1,16.7) = 8.77, P < 0.01] and total daily time spent running [F(1,16) = 7.67, P < 0.05], with B6.CAST-17.1 homozygous subcongenic mice running farther and longer than homozygous B6 mice (Fig. 4A). No differences were found between strains in daily running speed [F(1, 17.8) = 3.66, P = 0.07] or peak speed per min [F(1,17.9 = 0.99, P = 0.33] (data not shown). The subcongenic mice ran farther than controls during the dark period (P < 0.05) but not the light period (P = 0.28) (Fig. 4B). The average daily distance run by B6 mice in our study was similar to that of Harri et al. (Harri et al, 1999) who reported that B6 mice run approx. 5 km/day. There was no difference in baseline body weight between strains at week 0 (P = 0.27), but by weeks 4 and 5 of wheel running the subcongenic mice weighed significantly less than controls (P < 0.05) (Fig. 4C). This observation suggests that our subcongenic mice, fed standard chow diet, were unable to adequately compensate for the increased energy cost of running, despite the fact that they eat more calories per body weight under non-running conditions, e.g., in the macronutrient diet selection paradigm.
FIG. 4.
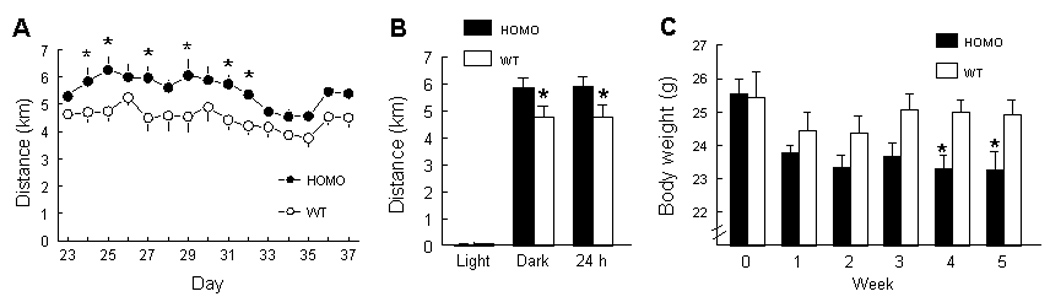
(A) Average daily running distance in singly-housed B6.CAST-17.1 homozygous (HOMO) and wild-type B6 (WT) subcongenic mice during days 23–37, following habituation to the wheel housing. (B) The data from “A” are presented as the mean of 15 d of activity, during lights-on (0700) and lights off (1900) periods. (C) Average body weight measured twice per week throughout the experiment, including the habituation to wheel running.
*P < 0.05. n = 6 mice per genotype.
Identification of deregulated genes in chow-fed B6.CAST-17.1 mice
In hypothalamus, out of 481 expressed genes within the QTL interval, only 35 were deregulated; specifically, mRNA abundance in the subcongenic strains was decreased in 19 and increased in 16 genes (Table 3). The most compelling candidate gene is Npw (neuropeptide W), a ligand for the former orphan receptor GPR7, and part of a neuropeptide system thought to have a role in regulating feeding behavior, energy homeostasis, and neuroendocrine function. Other gene candidates include: Glo1, part of the enzymatic defense against glycation and Cyp4f15, an cytochrome P450 enzyme with leukotriene B4 omega-hydroxylase activity. In skeletal muscle, out of 375 expressed genes within the QTL interval, 10 showed decreased expression in congenic mice and 26 were up regulated compared to WT littermates (Table 4).
Table 3.
Differentially expressed genes in hypothalamus between homozygous B6.CAST-17.1 and wild-type B6 subcongenic mice (positive fold difference indicates increased expression, negative value indicates decreased expression in homozygous B6.CAST-17.1 mice).
| Probe ID |
P-value | Fold change |
UniGene | Gene Symbol | Gene Name |
|---|---|---|---|---|---|
| 370857 | 0.001 | −4.870 | Mm.30145 | Enpp5 | Ectonucleotide pyrophosphatase/ phosphodiesterase 5 |
| 300048 | 0.011 | −3.306 | Mm.9277 | Pla2g7 | Phospholipase A2, group VII (platelet-activating factor acetylhydrolase, plasma) |
| 925126 | 0.013 | −2.970 | Mm.240325 | Cnpy3 | Canopy 3 homolog |
| 932548 | 0.047 | −2.825 | Mm.8684 | Agpat1 | 1-acylglycerol-3-phosphate O- acyltransferase 1 |
| 653008 | 0.028 | −2.542 | Mm.181237 | Rnaset2b | Ribonuclease T2B |
| 319582 | 0.004 | −2.465 | Mm.390965 | Prrt1 | Proline-rich transmembrane protein 1 |
| 742093 | 0.020 | −2.141 | Mm.12787 | Lmf1 | Lipase maturation factor 1 |
| 342655 | 0.030 | −2.073 | Mm.274942 | Paqr4 | Progestin and adipoQ receptor family member IV |
| 488903 | 0.024 | −2.038 | Mm.329022 | Abcf1 | ATP-binding cassette, sub-family F (GCN20), member 1 |
| 902367 | 0.053 | −1.936 | Mm.322170 | Atp6v0c | ATPase, H+transporting, V0 subunit C |
| 768402 | 0.016 | −1.783 | Mm.26783 | BC008155 | cDNA sequence BC008155 |
| 367090 | 0.034 | −1.773 | Mm.295009 | Ppp2r5d | Protein phosphatase 2, regulatory subunit B (B56), delta isoform |
| 781102 | 0.043 | −1.747 | Mm.76543 | Abcc10 | ATP-binding cassette, sub-family C (CFTR/MRP), member 10 |
| 735476 | 0.036 | −1.734 | Mm.439827 | Bat1a | HLA-B-associated transcript 1A |
| 576743 | 0.048 | −1.729 | Mm.70999 | Gm88 | Gene model 88, (NCBI) |
| 921891 | 0.007 | −1.729 | Mm.41191 | Rab11fip3 | RAB11 family interacting protein 3 (class II) |
| 418927 | 0.006 | −1.681 | Mm.38607 | Gnptg | N-acetylglucosamine-1- phosphotransferase, gamma subunit |
| 906020 | 0.053 | −1.652 | Mm.10812 | Pde9a | Phosphodiesterase 9A |
| 899243 | 0.020 | −1.521 | Mm.390952 | LOC381065 | null |
| 899632 | 0.042 | 1.585 | Mm.54174 | Nlrp3 | NLR family, pyrin domain containing 3 |
| 748793 | 0.030 | 1.598 | Mm.122698 | Wdr27 | WD repeat domain 27 |
| 917926 | 0.025 | 1.674 | Mm.439711 | Acat2 | Acetyl-Coenzyme A acetyltransferase 2 |
| 484730 | 0.024 | 1.764 | Mm.133401 | Arid1b | AT rich interactive domain 1B (Swi1 like) |
| 880965 | 0.025 | 1.780 | Mm.372314 | Hspa1b | heat shock protein 1A|heat shock protein 1B |
| 592477 | 0.003 | 1.848 | Mm.28251 | LOC545184 | null |
| 490554 | 0.001 | 1.911 | Mm.276296 | 100043468 | Predicted gene, 100043468 |
| 915442 | 0.022 | 1.941 | Mm.261984 | Glo1 | Glyoxalase 1 |
| 338441 | 0.002 | 1.995 | Mm.259884 | Mut | Methylmalonyl-Coenzyme A mutase |
| 470980 | 0.015 | 2.234 | Mm.290116 | BC004004 | cDNA sequence BC004004 |
| 346004 | 0.012 | 2.303 | Mm.291772 | Npw | Neuropeptide W |
| 801941 | 0.009 | 2.405 | Mm.275521 | Wtap | Wilms' tumour 1-associating protein |
| 919579 | 0.003 | 2.466 | Mm.26539 | Cyp4f15 | Cytochrome P450, family 4, subfamily f, polypeptide 15 |
| 729309 | 0.009 | 2.561 | Mm.49544 | Cchcr1 | Coiled-coil alpha-helical rod protein 1 |
| 353516 | 0.003 | 2.984 | Mm.206588 | Transcribed locus, weakly similar to NP_034374.2 Friend virus susceptibility 1 (b allele) |
|
| 797869 | 0.000 | 5.084 | Mm.12743 | Rsph1 | Radial spoke head 1 homolog (Chlamydomonas) |
Genes were selected based on a significance level of P < 0.05 and ≥ 1.5 fold change in expression, i.e, ratio of the normalized signal intensity for B6.CAST-17.1 to wild-type subcongenic mice.
Table 4.
Differentially expressed genes in skeletal muscle between homozygous B6.CAST-17.1 and wild-type B6 subcongenic mice (positive fold change indicates increased expression, negative value indicates decreased expression in homozygous B6.CAST-17.1 mice).
| Gene | |||||
|---|---|---|---|---|---|
| Probe ID |
P-value | Fold change |
UniGene | symbol | Gene Name |
| 300048 | <0.001 | −4.75 | Mm.9277 | Pla2g7 | Phospholipase A2, group VII (platelet- activating factor acetylhydrolase, plasma) |
| 835665 | 0.009 | −2.74 | Mm.130900 | Cyp4f39 | Cytochrome P450, family 4, subfamily f, polypeptide 39 |
| 331296 | 0.027 | −2.30 | Mm.44983 | 2810434 M15Rik |
RIKEN cDNA 2810434M15 gene |
| 801941 | 0.035 | −2.18 | Mm.275521 | Wtap | Wilms' tumour 1-associating protein |
| 376652 | 0.025 | −2.09 | Mm.277233 | Rhot2 | Ras homolog gene family, member T2 |
| 320903 | 0.031 | −1.81 | Mm.466882 | H2-Q1 | Histocompatibility 2, Q region locus 1 |
| 653008 | 0.007 | −1.71 | Mm.181237 | Rnaset2a | Ribonuclease T2 |
| 529509 | 0.046 | −1.64 | Mm.161119 | Zbtb12 | Zinc finger and BTB domain containing 12 |
| 766610 | 0.013 | −1.52 | Mm.2948 | H2-Ke2 | H2-K region expressed gene 2 |
| 725017 | 0.047 | −1.51 | Mm.29513 | Ndufa7 | NADH dehydrogenase (ubiquinone) 1 alpha subcomplex, 7 (B14.5a) |
| 864480 | 0.019 | 1.51 | Mm.293466 | Rgmb | RGM domain family, member B |
| 537031 | 0.008 | 1.53 | Mm.28895 | 1110038B 12Rik |
RIKEN cDNA 1110038B12 gene |
| 739907 | 0.04 | 1.56 | Mm.328914 | Ppard | Peroxisome proliferator activator receptor delta |
| 920635 | 0.029 | 1.58 | Mm.328851 | Mrps34 | Mitochondrial ribosomal protein S34 |
| 716720 | 0.012 | 1.60 | Mm.439743 | H2-Q7 | Histocompatibility 2, Q region locus 9 locus 7 |
| 895302 | 0.021 | 1.60 | Mm.32912 | Psmb1 | Proteasome (prosome, macropain) subunit, beta type 1 |
| 401591 | 0.038 | 1.63 | Mm.227250 | Fgfr1op | Fgfr1 oncogene partner |
| 361109 | 0.026 | 1.74 | Mm.246697 | Ly6g6d | Lymphocyte antigen 6 complex, locus G6D |
| 432416 | 0.028 | 1.76 | Mm.390957 | Pbx2 | Pre B-cell leukemia transcription factor 2 |
| 667857 | 0.018 | 1.80 | Mm.102761 | Rrp1b | Ribosomal RNA processing 1 homolog B (S. cerevisiae) |
| 428868 | 0.029 | 1.89 | Mm.5021 | Ddr1 | Discoidin domain receptor family, member 1 |
| 480967 | 0.002 | 1.89 | Mm.2443 | Bak1 | BCL2-antagonist/killer 1 |
| 740898 | 0.004 | 1.92 | Mm.250393 | BC051226 | cDNA sequence BC051226 |
| 898097 | 0.004 | 2.42 | Mm.275521 | Wtap | Wilms' tumour 1-associating protein |
| 917291 | 0.011 | 2.54 | Mm.439675 | H2-D1 | Histocompatibility 2, D region locus 1 |
| 631849 | 0.019 | 2.55 | Mm.46176 | Ppp1r11 | Protein phosphatase 1, regulatory (inhibitor) subunit 11 |
| 796692 | 0.015 | 2.60 | Mm.653 | Cfb | Complement factor B |
| 302170 | 0.01 | 2.67 | Mm.328851 | Mrps34 | Mitochondrial ribosomal protein S34 |
| 430779 | 0.001 | 3.36 | Mm.33042 | 2810468N 07Rik |
RIKEN cDNA 2810468N07 gene |
| 797869 | 0.001 | 3.41 | Mm.12743 | Rsph1 | Radial spoke head 1 homolog (Chlamydomonas) |
| 353516 | 0.019 | 3.46 | Mm.206588 | B230354 K17Rik |
RIKEN cDNA B230354K17 gene |
| 679659 | 0.009 | 3.49 | Mm.22602 | Atp6v0e | ATPase, H+ transporting, lysosomal V0 subunit |
| 352835 | 0.024 | 3.83 | Mm.127166 | Prss34 | Protease, serine, 34 |
| 566227 | 0.021 | 4.10 | Mm.25168 | Crip3 | Cysteine-rich protein 3 |
| 742202 | 0.008 | 5.25 | Mm.3301 | Tpsab1 | Tryptase alpha/beta 1 |
| 571419 | 0.003 | 39.55 | Mm.15680 | H2-Ea | Histocompatibility 2, class II antigen E alpha |
Genes were selected based on a significance level of P < 0.05 and ≥ 1.5 fold change in expression, i.e, ratio of the normalized signal intensity for B6.CAST-17.1 to wild-type subcongenic mice.
Quantitative real-time PCR (qRT-PCR)
As confirmation of the microarray results, we showed that mRNA levels of Npw and Glo1 were significantly increased, and those of Pla2g7 and Pde9a were significantly decreased in B6.CAST-17.1 homozygous congenic mice compared with homozygous B6 (Table 5). However, Cyp4f15 was regulated in the opposite direction when measured by qPCR. The increased expression of Acat2 and Ppard in congenic mice in qPCR did not reach the criterion for statistical significance. Also, the deregulation of Agpat1 in the current microarray analysis of chow-fed mice was not validated by quantitative PCR. This result is consistent with our previous finding that Agpat1 expression in the hypothalamus was significantly decreased after 24 h of macronutrient diet self-selection, but was unaltered on chow diet (Kumar and Smith Richards, 2008), suggesting a gene-diet interaction.
Table 5.
qRT-PCR validation of selected gene candidates identified by microarray analysis.
| Gene symbol |
Gene Name | Tissue | Array fold change |
Real-time qPCR | |
|---|---|---|---|---|---|
| Fold change |
P-value | ||||
| Pla2g7 | Phospholipase A2, group VII (Platelet-activating factor acetylhydrolase) |
Hypothal. | −3.31 | −2.12 | <0.0001 |
| Agpat1 | 1-acylglycerol-3-phosphate O-acyltransferase 1 |
Hypothal. | −2.83 | 1.00 | 0.997 |
| Pde9a | Phosphodiesterase 9a | Hypothal. | −1.65 | −1.34 | <0.0001 |
| Cyp4f15 | Cytochrome P450, family 4, subfamily f, polypeptide 15 |
Hypothal. | 2.47 | −4.22 | <0.0001 |
| Npw | Neuropeptide W | Hypothal. | 2.30 | 1.74 | <0.0001 |
| Glo1 | Glyoxalase I | Hypothal. | 1.94 | 2.12 | <0.0001 |
| Acat2 | Acetyl-coenzyme A acetyltransferase 2 |
Hypothal. | 1.67 | 1.08 | 0.151 |
| Ppard | Peroxisome proliferator activator receptor delta |
S. muscle | 1.56 | 0.60 | 0.114 |
Independent validation, using quantitative real-time RT-PCR, of selected gene candidates identified by microarray analysis. Fold change refers to the ratio of expression values for B6.CAST-17.1 relative to B6/B6 subcongenic. Statistical significance was calculated based on normalized threshold (CT) values.
Sequencing of positional candidate gene Ppard
Peroxisome proliferator-activated receptor-delta, located in the peak of the QTL region, showed a small but significant increase in gene expression in the microarray experiment. Furthermore, fatty acid synthase (Fasn) on Chr 11, a target gene of PPARd in skeletal muscle, was upregulated by 2.2-fold in sub-congenic mice. These results, along with the known effects of Ppard on fuel metabolism in skeletal muscle, led us to investigate the candidacy of this gene. Therefore we sequenced the full-length coding region in a homozygous subcongenic mouse possessing CAST/Ei alleles at Ppard. A total of 5 coding SNPs were identified between the publicly available B6 and CAST sequence. None of these SNPs results in a missense mutation.
Discussion
In this study we used genetic strategies to narrow a nutrient intake QTL first identified in the B6.CAST-D17Mit19–D17Mit91 (B6.CAST-17) congenic strain (Kumar et al, 2007). Thus we reduced the original 60.3 Mb congenic interval to a 40.1-Mb region and showed that the B6.CAST-17.1 subcongenic strain retained the original, linked phenotypes of higher carbohydrate intake and higher calorie intake (Smith Richards et al, 2002). An important new finding emerged showing that this subcongenic strain possesses an activity phenotype, i.e., higher physical activity levels, both in spontaneous locomotion and in voluntary wheel running, compared with the B6 strain. Because resting energy expenditure was not different between the homozygous subcongenic B6.CAST-17.1 and B6 mice, we propose that increased energy intake, specifically carbohydrate, supports their increased physical activity level. It is not known whether the original congenic strain B6.C-17.0 possesses an activity phenotype as it has not been tested. Notably, the subcongenic strain did not recapitulate the lower-body-weight phenotype observed in the original congenic (Kumar et al, 2007), suggesting that the region between D17Mit50 and D17Mit91 harbors a gene(s) affecting body weight. Chr 17 contains several adiposity and obesity QTLs mapped in this (Smith Richards et al, 2002) and other genetic crosses, including several that overlap our subcongenic donor region, i.e., Obq19 (Ishimori et al, 2004), Obwq4 (Stylianou et al, 2006), and Adip18 (Stylianou et al, 2006). To our knowledge however, there are no published reports of other lines coinciding with our subcongenic line, that have captured alleles affecting food intake. To identify candidate genes that were differentially expressed between homozygous subcongenic B6.CAST-17.1 and B6 mice, in hypothalamus and skeletal muscle, an interval-specific microarray was used.
A number of studies have identified QTLs for physical activity but none have mapped a genetic locus on chromosome 17 or identified specific gene(s), with one exception (Furuse et al, 2002). Notably, a locus designated Locomotor activity 2 (Loco2) was mapped between D17Mit168 and D17Mit166. The Loco2 QTL for increased spontaneous physical activity coincides with our B6.CAST-17.1 region and thus may harbor a gene(s) that is contributing to the observed phenotypes.
The heritability of voluntary wheel running in mice has also been demonstrated by the identification of QTL. For example, several suggestive QTL for wheel running were reported in B × D recombinant inbred (RI) strains including one locus on chromosome 17 which according to its reported map position (41.5 cM), falls outside our subcongenic region (Hofstetter et al, 1999). Evidence for a genetic link between wheel running and other related behaviors is inconclusive and the motivations for wheel running are likely heterogeneous (Sherwin, 1998). Nevertheless, we have shown in the current study that spontaneous physical activity and wheel running are influenced by the animal’s genotype, suggesting that both of these behaviors are under genetic control.
The genes that regulate voluntary physical activity are presently unknown. Our microarray analysis has identified 71 genes in the Chr 17 subcongenic interval that were differentially regulated during chow feeding, and may be involved in nutrient intake and/or physical activity. Notably, we found a subtle but highly significant increase (10%) in Npw expression in the hypothalamus of B6.CAST-17.1 mice. Preliminary studies in rodents have shown that CNS administration of NPW can increase or decrease food intake, increase locomotor activity, stimulate prolactin secretion, and promote analgesia (Levine et al, 2005; Shimomura et al, 2002; Singh and Davenport, 2006; Tanaka et al, 2003). Thus Npw is a promising candidate for the Chr 17 QTL.
The greater than 2-fold increase in Glo1 expression in the current study replicated our earlier finding of clear transcriptional regulation of Glo1 in the hypothalamus of B6.C-17 mice (Kumar et al, 2007; Kumar and Smith Richards, 2008). Glo1 encodes an antioxidant enzyme which detoxifies alpha-ketoaldehydes to prevent the accumulation of pro-oxidative compounds such as methylglyoxal, that are potentially damaging to the proteome, genome and lipidome (Thornalley, 2008). Previously we found that both mRNA expression and protein abundance of glyoxalase 1 were significantly increased in B6.C-17 congenic mice; moreover, these mice exhibited higher enzymatic activity compared with controls (Kumar and Smith Richards, 2008). Although the physiological function of Glo1 in the brain is unknown, it has been proposed that neuronal damage by excess methylglyoxal could contribute to increased anxiety (Thornalley, 2006) or affect slow-wave sleep (Tafti et al, 2003). We postulate that induction of this antioxidant defense system protects high carbohydrate-consuming mouse strains against the potentially damaging effects of dietary oxidants (Kumar and Smith Richards, 2008). Additional studies of the antioxidant response in these mice and functional characterization of this enzyme will determine its involvement in feeding or spontaneous activity.
Cyp4f15, a cytochrome P450 gene involved in the metabolism of xenobiotics (Cui et al, 2001), showed highly significant down-regulation in the hypothalamus of B6.CAST-17.1 mice. Cyp4f15 is widely distributed and highly expressed in brain. The functions of CYP4F enzymes in the brain are in the early stages of investigation; however their presence there suggests metabolic protection against potential toxicity from compounds that may occur in drugs or foods.
We found a modest (26%) yet significant reduction in hypothalamic phosphodiesterase 9a (Pde9a) expression in B6.CAST-17.1 mice using qPCR. It is worth noting that small changes in gene expression may be biologically relevant especially when studying the central nervous system (Chiu et al., 2007; Pavlidis, 2003). The phosphodiesterases (PDE) comprise a group of enzymes that degrade cyclic adenosine monophosphate (cAMP) and cyclic guanosine monophosphate (cGMP). As such, PDEs participate in the regulation of all cellular functions, depending on the cyclic nucleotides that serve as second messengers, by regulating the localization, duration and amplitude of cyclic nucleotide signaling within subcellular domains. However the PDE 9 gene family is not well characterized and a possible role of Pde9a as a candidate gene for energy balance phenotypes awaits future functional studies. Also, hypothalamic Pla2g7 expression was significantly decreased by nearly 40% in B6.CAST-17.1 mice. Pla2g7 encodes platelet-activating factor (PAF) acetylhydrolase, a secreted enzyme that catalyzes the degradation of PAF to inactive products by hydrolysis of the acetyl group at the sn-2 position. The Pla2g7 gene product is a potent pro- and anti-inflammatory molecule implicated in multiple inflammatory disease processes, including cardiovascular disease and resistance to atherosclerosis.
It should be noted that although expression arrays can be used to identify patterns of gene expression within a QTL or subcongenic donor region and lead to the identification of complex trait genes, it is possible that the responsible gene(s) is not expressed differentially. That is, some but not all QTL genes unequivocally identified by positional cloning have shown differential gene expression in key tissues. Alleles also may affect a phenotype through changes in coding sequence, splice variants or differences in protein expression. Moreover, by selecting only two tissues (hypothalamus and skeletal muscle) for analysis of gene expression, some causal genes may have been overlooked. For example, additional brain regions, e.g., hippocampus and striatum, may provide further information about gene expression profiles predictive of increased physical activity.
Whether or not the above genes are involved in determining physical activity, carbohydrate intake, or total calorie intake remains to be determined. Functional studies will determine their viability as candidates while fine structure genetic mapping is underway. Although we have reduced the Chr 17 QTL/congenic segment from 60.3 Mb to 40.1 Mb, candidate gene analysis in an interval of this size is considered impractical. Pathways regulating energy intake and physical activity may share common regulatory mechanisms (Sakkou et al, 2007). Fine structure genetic mapping of this locus will reveal whether it is encoded by a single gene determining both food intake and spontaneous physical activity, or by two or more genes, each determining a sub-phenotype of energy balance.
Acknowledgments
This work was supported by Grant DK53113 (to B.K.S.R.) from the National Institutes of Health, and was partially supported by CNRU Center Grant #1P30 DK072476, sponsored by NIDDK. We thank Candice Pereira and Stephannie Ruiz for technical assistance in these studies. A preliminary report was published in abstract form (Kumar et al, 2007).
Footnotes
Conflict of interest
The authors declare no conflict of interest.
References
- 1.Albarado DC, McClaine J, Stephens JM, Mynatt RL, Ye J, et al. Impaired coordination of nutrient intake and substrate oxidation in melanocortin-4 receptor knockout mice. Endocrinol. 2004;145:243–252. doi: 10.1210/en.2003-0452. [DOI] [PubMed] [Google Scholar]
- 2.Berthoud HR, Lenard NR. Central and peripheral regulation of food intake and physical activity: pathways and genes. Obesity. 2008;16 Suppl 3:S11–S22. doi: 10.1038/oby.2008.511. [DOI] [PMC free article] [PubMed] [Google Scholar]
- 3.Bolstad BM, Irizarry RA, Astrand M, Speed TP. A comparison of normalization methods for high density oligonucleotide array data based on variance and bias. Bioinformatics. 2003;19:185–193. doi: 10.1093/bioinformatics/19.2.185. [DOI] [PubMed] [Google Scholar]
- 4.Cai G, Cole SA, Bastarrachea RA, Maccluer JW, Blangero J, et al. Quantitative trait locus determining dietary macronutrient intakes is located on human chromosome 2p22. Am J Clin Nutr. 2004;80:1410–1414. doi: 10.1093/ajcn/80.5.1410. [DOI] [PubMed] [Google Scholar]
- 5.Cai G, Cole SA, Butte N, Bacino C, Diego V, et al. A quantitative trait locus on chromosome 18q for physical activity and dietary intake in Hispanic children. Obesity (Silver Spring) 2006;14:1596–1604. doi: 10.1038/oby.2006.184. [DOI] [PubMed] [Google Scholar]
- 6.Chiu S, Kim K, Haus KA, Espinal GM, Millon LV, et al. Identification of positional candidate genes for body weight and adiposity in subcongenic mice. Physiol Genomics. 2007;31:75–85. doi: 10.1152/physiolgenomics.00267.2006. [DOI] [PubMed] [Google Scholar]
- 7.Choquette AC, Lemieux S, Tremblay A, Chagnon YC, Bouchard C, et al. Evidence of a quantitative trait locus for energy and macronutrient intakes on chromosome 3q27.3: the Quebec Family Study. Am J Clin Nutr. 2008;88:1142–1148. doi: 10.1093/ajcn/88.4.1142. [DOI] [PubMed] [Google Scholar]
- 8.Collaku A, Rankinen T, Rice T, Leon AS, Rao DC, et al. A genome-wide linkage scan for dietary energy and nutrient intakes: the Health, Risk Factors, Exercise Training, and Genetics (HERITAGE) Family Study. Am J Clin Nutr. 2004;79:881–886. doi: 10.1093/ajcn/79.5.881. [DOI] [PubMed] [Google Scholar]
- 9.Cui X, Kawashima H, Barclay TB, Peters JM, Gonzalez FJ, et al. Molecular cloning and regulation of expression of two novel mouse CYP4F genes: expression in peroxisome proliferator-activated receptor α-deficient mice upon lipopolysaccharide and clofibrate challenges. J Pharmacol Exp Ther. 2001;296:542–550. [PubMed] [Google Scholar]
- 10.Delahunty KM, Shultz KL, Gronowicz GA, Koczon-Jaremko B, Adamo ML, et al. Congenic mice provide in vivo evidence for a genetic locus that modulates serum insulin-like growth factor-I and bone acquisition. Endocrinol. 2006;147:3915–3923. doi: 10.1210/en.2006-0277. [DOI] [PubMed] [Google Scholar]
- 11.Faith MS, Rha SS, Neale MC, Allison DB. Evidence for genetic influences on human energy intake: results from a twin study using measured observations. Behav Genet. 1999;29:145–154. doi: 10.1023/a:1021683716700. [DOI] [PubMed] [Google Scholar]
- 12.Farber CR, Medrano JF. Fine mapping reveals sex bias in quantitative trait loci affecting growth, skeletal muscle size and obesity-related traits on mouse chromosomes 2 and 11. Genetics. 2007;175:349–360. doi: 10.1534/genetics.106.063693. [DOI] [PMC free article] [PubMed] [Google Scholar]
- 13.Furuse T, Takano-Shimizu T, Moriwaki K, Shiroishi T, Koide T. QTL analyses of spontaneous activity by using mouse strains from Mishima battery. Mamm Genome. 2002;13:411–415. doi: 10.1007/s00335-002-2168-5. [DOI] [PubMed] [Google Scholar]
- 14.Harri M, Lindblom J, Malinen H, Hyttinen M, Lapvetelainen T, et al. Effect of access to a running wheel on behavior of C57BL/6J mice. Lab Anim Sci. 1999;49:401–405. [PubMed] [Google Scholar]
- 15.Hofstetter JR, Possidente B, Mayeda AR. Provisional QTL for circadian period of wheel running in laboratory mice: quantitative genetics of period in RI mice. Chronobiol Int. 1999;16:269–279. doi: 10.3109/07420529909116857. [DOI] [PubMed] [Google Scholar]
- 16.Ishimori N, Li R, Kelmenson PM, Korstanje R, Walsh KA, et al. Quantitative trait loci that determine plasma lipids and obesity in C57BL/6J and 129S1/SvImJ inbred mice. J Lipid Res. 2004;45:1624–1632. doi: 10.1194/jlr.M400098-JLR200. [DOI] [PubMed] [Google Scholar]
- 17.Jerez-Timaure NC, Eisen EJ, Pomp D. Fine mapping of a QTL region with large effects on growth and fatness on mouse chromosome 2. Physiol Genomics. 2005;21:411–422. doi: 10.1152/physiolgenomics.00256.2004. [DOI] [PubMed] [Google Scholar]
- 18.Kumar KG, Byerley L, Volaufova J, Drucker DJ, Churchill GA, et al. Genetic variation in Glp1r expression influences the rate of gastric emptying in mice. Am J Physiol Regul Integr Comp Physiol. 2008;294:R262–R371. doi: 10.1152/ajpregu.00640.2007. [DOI] [PubMed] [Google Scholar]
- 19.Kumar KG, Poole AC, York B, Volaufova J, Zuberi A, et al. Quantitative trait loci for carbohydrate and total energy intake on mouse chromosome 17: congenic strain confirmation and candidate gene analyses (Glo1, Glp1r) Am J Physiol Regul Integr Comp Physiol. 2007;292:R207–R216. doi: 10.1152/ajpregu.00491.2006. [DOI] [PubMed] [Google Scholar]
- 20.Kumar KG, Smith Richards BK. Transcriptional profiling of Chromosome 17 QTL for carbohydrate and total calorie intake in a mouse congenic strain reveals candidate genes and pathways. J Nutrigenetics and Nutrigenomics. 2008;1:155–171. doi: 10.1159/000113657. [DOI] [PMC free article] [PubMed] [Google Scholar]
- 21.Kumar KG, Zuberi A, Smith Richards BK. A unique genetic locus on mouse Chromosome 17 influences energy intake, carbohydrate preference, and spontaneous physical activity in a subcongenic strain. Obes Res. 2007;15:A183. [Google Scholar]
- 22.Leiter EH, Reifsnyder PC, Zhang W, Pan HJ, Xiao Q, et al. Differential endocrine responses to rosiglitazone therapy in new mouse models of type 2 diabetes. Endocrinol. 2006;147:919–926. doi: 10.1210/en.2005-0839. [DOI] [PubMed] [Google Scholar]
- 23.Levine AS, Winsky-Sommerer R, Huitron-Resendiz S, Grace MK, de Lecea L. Injection of neuropeptide W into paraventricular nucleus of hypothalamus increases food intake. Am J Physiol Regul Integr Comp Physiol. 2005;288:R1727–R1732. doi: 10.1152/ajpregu.00638.2003. [DOI] [PubMed] [Google Scholar]
- 24.Pavlidis P. Using ANOVA for gene selection from microarray studies of the nervous system. Methods. 2003;31:282–289. doi: 10.1016/s1046-2023(03)00157-9. [DOI] [PubMed] [Google Scholar]
- 25.Raber P, Del Canho S, Darvasi A, Devor M. Mice congenic for a locus that determines phenotype in the neuroma model of neuropathic pain. Exp Neurol. 2006;202:200–206. doi: 10.1016/j.expneurol.2006.05.030. [DOI] [PubMed] [Google Scholar]
- 26.Rankinen T, Bouchard C. Genetics of food intake and eating behavior phenotypes in humans. Annu Rev Nutr. 2006;26:413–434. doi: 10.1146/annurev.nutr.26.061505.111218. [DOI] [PubMed] [Google Scholar]
- 27.Reed DR, Bachmanov AA, Beauchamp GK, Tordoff MG, Price RA. Heritable variation in food preferences and their contribution to obesity. Behav Genet. 1997;27:373–387. doi: 10.1023/a:1025692031673. [DOI] [PMC free article] [PubMed] [Google Scholar]
- 28.Riachi M, Himms-Hagen J, Harper ME. Percent relative cumulative frequency analysis in indirect calorimetry: application to studies of transgenic mice. Can J Physiol Pharmacol. 2004;82:1075–1083. doi: 10.1139/y04-117. [DOI] [PubMed] [Google Scholar]
- 29.Sakkou M, Wiedmer P, Anlag K, Hamm A, Seuntjens E, et al. A role for brain-specific homeobox factor Bsx in the control of hyperphagia and locomotor behavior. Cell Metab. 2007;5:450–463. doi: 10.1016/j.cmet.2007.05.007. [DOI] [PubMed] [Google Scholar]
- 30.Sherwin CM. Voluntary wheel running: a review and novel interpretation. Anim Behav. 1998;56:11–27. doi: 10.1006/anbe.1998.0836. [DOI] [PubMed] [Google Scholar]
- 31.Shimomura Y, Harada M, Goto M, Sugo T, Matsumoto Y, et al. Identification of neuropeptide W as the endogenous ligand for orphan G-protein-coupled receptors GPR7 and GPR8. J Biol Chem. 2002;277:35826–35832. doi: 10.1074/jbc.M205337200. [DOI] [PubMed] [Google Scholar]
- 32.Singh G, Davenport AP. Neuropeptide B and W: neurotransmitters in an emerging G-protein-coupled receptor system. Br J Pharmacol. 2006;148:1011–1041. doi: 10.1038/sj.bjp.0706825. [DOI] [PMC free article] [PubMed] [Google Scholar]
- 33.Smith BK, Andrews PK, West DB. Macronutrient self-selection in thirteen mouse strains. Am J Physiol. 2000;278:R797–R805. doi: 10.1152/ajpregu.2000.278.4.R797. [DOI] [PubMed] [Google Scholar]
- 34.Smith Richards BK, Belton BN, Poole AC, Mancuso JJ, Churchill GA, et al. QTL analysis of self-selected macronutrient diet intake: fat, carbohydrate, and total kilocalories. Physiol Genomics. 2002;11:205–217. doi: 10.1152/physiolgenomics.00037.2002. [DOI] [PubMed] [Google Scholar]
- 35.Stylianou IM, Korstanje R, Li R, Sheehan S, Paigen B, et al. Quantitative trait locus analysis for obesity reveals multiple networks of interacting loci. Mamm Genome. 2006;17:22–36. doi: 10.1007/s00335-005-0091-2. [DOI] [PubMed] [Google Scholar]
- 36.Tafti M, Petit B, Chollet D, Neidhart E, de Bilbao F, et al. Deficiency in short-chain fatty acid beta-oxidation affects theta oscillations during sleep. Nat Genet. 2003;34:320–325. doi: 10.1038/ng1174. [DOI] [PubMed] [Google Scholar]
- 37.Tanaka H, Yoshida T, Miyamoto N, Motoike T, Kurosu H, et al. Characterization of a family of endogenous neuropeptide ligands for the G protein-coupled receptors GPR7 and GPR8. PNAS. 2003;100:6251–6256. doi: 10.1073/pnas.0837789100. [DOI] [PMC free article] [PubMed] [Google Scholar]
- 38.Thornalley PJ. Protein and nucleotide damage by glyoxal and methylglyoxal in physiological systems---role in ageing and disease. Drug Metabol Drug Interact. 2008;23:125–150. doi: 10.1515/dmdi.2008.23.1-2.125. [DOI] [PMC free article] [PubMed] [Google Scholar]
- 39.Thornalley PJ. Unease on the role of glyoxalase 1 in high-anxiety-related behaviour. TRENDS in Molecular Medicine. 2006;12:195–199. doi: 10.1016/j.molmed.2006.03.004. [DOI] [PubMed] [Google Scholar]
- 40.Warden CH, Stone S, Chiu S, Diament AL, Corva P, et al. Identification of a congenic mouse line with obesity and body length phenotypes. Mamm Genome. 2004;15:460–471. doi: 10.1007/s00335-004-2353-9. [DOI] [PubMed] [Google Scholar]
- 41.Wareham NJ, Young EH, Loos RJ. Epidemiological study designs to investigate gene-behavior interactions in the context of human obesity. Obesity (Silver Spring) 2008;16 Suppl 3:S66–S71. doi: 10.1038/oby.2008.521. [DOI] [PMC free article] [PubMed] [Google Scholar]