Abstract
We studied hypoxia-induced dynamic changes in the balance between PKA and PKA-counteracting phosphatases in the microfluidic environment in single cells using picosecond fluorescence spectroscopy and intramolecular fluorescence resonance energy transfer (FRET)-based sensors of PKA activity. First, we found that the apparent PKA activity in bone cells (MC3T3-E1 cells) and endothelial cells (bovine aortic endothelial cells) is rapidly and sensitively modulated by the level of O2 in the media. When the O2 concentration in the glucose-containing media was lowered due to O2 consumption by the cells in the microfluidic chamber, the apparent PKA activity increases; the reoxygenation of cells under hypoxia leads to a rapid (∼2 min) decrease of the apparent PKA activity. Second, lack of glucose in the media led to a lower apparent PKA activity and to a reversal of the response of the apparent PKA activity to hypoxia and reoxygenation. Third, the apparent PKA activity in cells under hypoxia was predominantly regulated via a cAMP-independent pathway since 1) changes in the cAMP level in the cells were not detected using a cAMP FRET sensor, 2) the decay of cAMP levels was too slow to account for the fast decrease in PKA activity levels in response to reoxygenation, and 3) the response of the apparent PKA activity due to hypoxia/reoxygenation was not affected by an adenylate cyclase inhibitior (MDL-12,330A) at 1 mM concentration. Fourth, the immediate onset of ROS accumulation in MC3T3-E1 cells subjected to hypoxia and the sensitivity of the apparent PKA acitivity to redox levels suggest that the apparent PKA activity change during hypoxia and reoxygenation in this study can be linked to a redox potential change in response to intermittent hypoxia through the regulation of activities of PKA-counteracting phosphatases such as protein phosphatase 1. Finally, our results suggest that the detection of PKA activity could be used to monitor responses of cells to hypoxia in real time.
Keywords: oxidative stress, phosphatase, ischemia, reperfusion, cAMP, protein kinase A
hypoxia is a cellular stress involved in many physiological and pathophysiological processes such as angiogenesis, tumor growth, apoptosis, and ischemic injury of the myocardium. Hypoxia, or, more specifically, ischemia, induces a range of pathogenic processes that are caused by cellular energy depletion, Ca2+ overload, mitochondrial dysfunction, and oxidative stress, although the exact molecular mechanisms are still under debate. It has been observed that lack of both O2 and glucose contributes to ischemia-reperfusion injury of the myocardium (28) and cerebral ischemia (9).
In addition to hypoxia-inducible factor (HIF) pathway activation (29), an acute reduction in O2 levels causes a variety of cellular responses in O2-sensitive cells, including depolarization of the plasma membrane (2) and inhibition of O2-sensitive K+ channels (2, 21) as well as the activation of many signal transduction pathways (e.g., Ca2+ levels, SAPKs, and MAPKs) (47) that lead to the regulation of gene expression (35, 45, 46, 58). cAMP response element-binding protein is a transcription factor that is also activated in the hypoxic response (31) and is known to be phosphorylated by PKA and multiple other kinases under normoxic conditions (31, 37). In rat pheochromocytoma (PC12) cells (45, 46), chronic hypoxia (3, 32) induced PKA activity and expression level changes, whereas acute hypoxia did not induce any PKA activity or expression level changes (3). Cells subjected to acute hypoxia and chronic hypoxia differ in the signal transduction pathways involved (57). Intermittent hypoxia (IH), a more potent stimulator of hypoxic responses than hypoxia alone, induces PKA-dependent phosphorylation of tyrosine hydroxylase in PC12 cells (33, 37). O2 sensing in carotid body type 1 cells involves multiple protein phosphorylation signaling mechanisms, including the participation of PKA (57). There are reports showing that hypoxia causes an increase in cAMP in carotid body type 1 cells (see Ref. 21 and the references within). Also, it has been found that PKA enhanced HIF signaling at the HIF DNA recognition site, the hypoxia response element (34). PKA is involved in the hypoxia response at both the mitochondrial and HIF-1α levels; PKA-mediated phosphorylation of cytochrome c oxidase augments hypoxia (41), and it has been suggested that PKA-dependent phosphorylation of HIF-1α during IH may be necessary for HIF activation (51). Although PKA mediates cAMP effects in an endocrine manner (43), its role in the cellular response to hypoxia has not been thoroughly investigated despite the importance of PKA in many cell type-specific functions, including cell survival (20, 23).
Bone cells use the HIF pathway to sense reduced levels of O2 to regulate the gene expression relevant for bone formation (56). It has been shown that O2 tension is an important mediator of the transformation of osteoblasts into osteocytes and that hypoxia is a physiological condition for bone formation and maintenance (22). Endothelial cells play a vitally important role in angiogenesis, and the HIF pathway is essential in mediating the hypoxic response of endothelial cells (39, 49); IH causes a significant reduction in PKA activity in brain endothelial cells (17) and microvascular endothelial cells (4). It is abrupt, rather than slow, reoxygenation that leads to the rapid activation of multiple kinases (64) and generation of ROS (16). PKA is involved in the hypoxic response in both types of cells in a way that has not been thoroughly investigated. Recently, it has been shown that the presence of reactive cysteine in the activation loop makes PKA highly sensitive to oxidative stress (26, 27). On the other hand, the potential of oxidative stress to function as a regulatory switch is gaining wider support (36).
The present study focused on elucidating the real-time dynamics of the PKA activity change in response to IH and reoxygenation in bone cells using picosecond fluorescence spectroscopy and intramolecular fluorescence resonance energy transfer (FRET)-based sensors. We also showed that endothelial cells exhibit similar response to hypoxia and reoxygenation as bone cells. Our experimental data suggest that redox potential, rather than cAMP, modulates PKA activity in these cells during IH. We present a model in which ROS generated in response to hypoxia modulate the redox potential in bone cells, which, in turn, modulates PKA activity indirectly by altering the oxidation/reduction status and, therefore, the activities of PKA-counteracting phosphatases. We also demonstrated that glucose deprivation inverts the sign of the PKA response, suggesting that glucose is involved in determining redox potential changes in response to hypoxia and reoxygenation.
MATERIALS AND METHODS
Chemicals and reagents.
Cis-N-(2-phenylcyclopentyl)azacyclotridedec-1-en-2-amine HCl (MDL-12,330A) and tautomycin were purchased from Alexis Biochemicals (San Diego, CA). CoCl2 and diamide (D3648) were from Sigma (St. Louis, MO). IBMX and isopreterenol (Iso) were from EMD Calbiochem (San Diego, CA). DMEM media, minimum essential media (α-MEM media), and other cell culture supplies were from Invitrogen (Carlsbad, CA). The Lab-Tek chambered coverglass was from Nalge Nunc. The O2 probe A65N was from Luxcel Biosciences (Cork, Ireland).
DNA constructs.
Mammalian cell expression vectors encoding PKA activity reporter AKAR3 and cAMP level reporter ICUE3 (1, 13) were kindly provided by M. D. Allen and L. M. DiPilato, respectively, from Dr. Zhang Jin's laboratory at The Johns Hopkins University. They were transformed into Esherichia coli strain TOP10 (Invitrogen) for amplification.
Measurement of the O2 consumption rate.
Cells were harvested before they reached 90% confluency by trypsinization and washed with and resuspended in Dulbecco's PBS (DPBS) buffer (supplemented with 5.5 mM glucose) at densities between 0.1 and 1 × 10⁶ cells/ml. The cell suspension (100 μl) was added into wells of a black 96-well plate. The O2-sensitive probe A65N was mixed with cells at a final concentration of 95 nM. Cells were prevented from exchanging O2 with the surroundings by covering the cell suspension with 100 μl of mineral oil. Cell suspension without the mineral oil seal was used as a control. The phosphorescence of A65N was measured as a function of time using a fluorescence plate reader (Victor II, Perkin-Elmer). The measurement settings were 340 and 642 nm for excitation and emission wavelengths, respectively.
ROS assay in cells.
Hypoxia-induced ROS accumulation in cells was monitored using the ROS-sensitive fluorescence probe 2′,7′-dichlorofluorescein diacetate (H2DCFDA; Invitrogen). ROS in the cells oxidize H2DCFDA into 2′,7′- dichlorofluorescein (DCF), which is highly fluorescent (8). Cells were washed and stained for 40 min with H2DCFDA at 10 μM concentration, washed again, and then resuspended in DPBS or DPBS + 5.5 mM glucose buffer at density of 3 million cells/ml. Hypoxia was induced as described above for the O2 consumption assay by sealing wells with 100 μl of mineral oil to inhibit O2 equilibration between the air and cell suspension. DCF fluorescence was excited at 480 nm and detected at 525 nm as a function of time using the SpectraMax M2 microoplater reader (Molecular Devices).
Measurement of Po2.
The Po2 in the media collected from the In-Line degasser (Waters) and in regularly oxygenated (air equilibrated) media was measured using an O2 electrode (Chiron Diagnostics).
Cell culture, transfection, and control of hypoxia/reoxygenation conditions.
MC3T3-E1 cells (American Type Tissue Collection, passages 2–6) were grown in α-MEM media (containing 10% FBS, 100 U/ml penicillin, and 100 μg/ml streptomycin and without vitamin C, Invitrogen). Bovine aortic endothelial cells (BAECs; passages 2–6, Cambrex, East Rutherford, NJ) were cultured in DMEM supplemented with 10% FBS, 100 U/ml penicillin, and 100 μg/ml streptomycin. All cell cultures were maintained in a humidified 5% CO2-95% air incubator at 37°C. The transfection of MT3T-E1 cells and BAECs was carried out using Targeting System (Santee, CA) reagents Targefect-F2 and Virofect enhancer when confluency was between 70% and 90%.
Cells were subjected to hypoxia in a parallel flow microfluidic chamber assembled from a coverglass (on which cells were cultured into a monolayer), a metal support (containing an inlet and outlet for flow), and a silicon gasket (thickness: 150 μm) with a 2.5-mm slit, which formed a flow channel when sandwiched between the coverglass and metal support. The construction of the chamber enabled microscopic observation of the cultured cells on the coverglass exposed to a controlled flow of fluid. Cells were seeded in a confined area of 2.5 × 20 mm on the coverglass (formed by a 2.5 × 20-mm silicon gasket) and transfected in situ. The fluid flow rate through the chamber was controlled by a syringe pump (model PHD2000, Harvard Apparatus). Induction of the hypoxia condition was achieved by stopping any flow of freshly oxygenated media into the flow chamber; in this case, the O2 depletion was rapidly established due to the metabolic consumption of O2 by cells (seeded on the coverglass) due to the very small volume of media in the flow chamber (the interior volume of the flow chamber was ∼9 μl). Temperatures of the chamber and media delivered into the chamber were maintained at 37°C. As an alternative to the induction of hypoxia by the cellular consumption of O2, cells were perfused with media of controlled O2 content. An in-line degasser was used to apply vacuum to the gas-permeable tubing to the lower O2 concentration of the media pumped through the chamber. Po2 in the media after passing through the degasser was determined to be <60 mmHg using an O2 electrode; the media at equilibrium with air had a Po2 of 160 mmHg. Hypoxia and reoxygenation were achieved by switching a valve in between degassed and air-equilibrated media.
Measurement of FRET signals.
To monitor FRET signals in single cells in real time under hypoxia, a time-resolved fluorescence microscopy method was used (7) in combination with a microfluidic parallel flow chamber, which allowed precise control of the flow of media with a syringe pump. The setup for FRET detection was as previously described (7). Briefly, time-resolved fluorescence emission kinetics and spectra were measured using a multichannel, time-correlated single-photon counting spectrograph (PML-16/SPC630, Becker & Hickl, Berlin, Germany) coupled to an inverted microscope (Axiovert 200 M, Zeiss, Thornwood, NY) via fiber optic link. A femtosecond Ti:sapphire oscillator (Spectra-Physics, Irvine, CA) was used as the excitation source. The repetition frequency of the light pulses from the oscillator was reduced to 8 MHz, and the light wavelength was doubled to 435 nm and coupled into the microscope. The excitation light (≈0.1 μW) was defocused to a spot size of 20–50 μm to enable spatially homogenous excitation of a single cell. A dichroic beamsplitter (455dclp, Chroma, Rockingham, VT) was used to separate excitation from fluorescence light. Our experimental setup enabled the detection of fluorescent transients from single cells with 16 independent wavelength channels and ∼20-ps time resolution. The photobleaching was 5–10% after 60-min illumination; it did not result in any noticeable changes of fluorescence spectra and kinetics on the time scale of our experiments. Fluorescence spectra were obtained by integrating time-resolved fluorescence data. The polarization of the detected fluorescence emission was selected using a polarizer. Presented data were obtained by detecting fluorescence emission polarized at 90° to the polarization of the excitation light at 435 nm, which enabled us to significantly increase the sensitivity of our measurements because yellow fluorescent protein emission is depolarized by the FRET process, whereas directly excited cyan fluorescent protein and yellow fluorescent protein emissions are polarized, resulting in a lower overall background signal. Isotropic fluorescence emission kinetics were measured under the magic angle condition (54.7° angle between excitation and detection polarizations).
RESULTS
Establishment of hypoxic conditions for spectroscopic experiments.
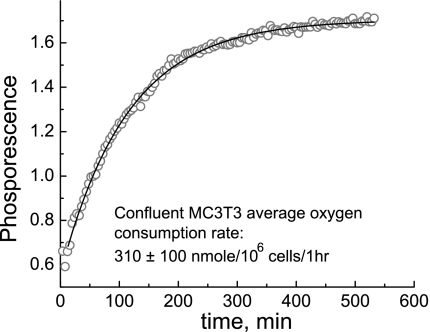
To characterize the establishment of the hypoxia condition in the microfluidic chamber induced by cellular O2 consumption, we determined the rate of O2 consumption by bone and endothelial cells. Cells were seeded in a 96-well plate and sealed in a well with a known volume of media with mineral oil, and phosphorescence intensity changes of the O2 probe A65N were recorded as a function of time (see the representative kinetics in Fig. 1). The kinetic data were analyzed using single-exponential rise model, which yielded the average rate of O2 consumption by the cells to be ∼310 ± 100 nmol·10−6 cells−1·h−1. The O2 consumption rate in BAECs has been reported in the literature to be ∼588 ± 48 nmol·10−6 cells·h−1 (30). The area of the flow chamber exposed to fluid flow was 0.625 cm2, which holds ∼1.3 × 10⁵ cells at full confluency (cell density was measured to be 2 × 10⁵/cm2 for MC3T3-E1 cells and BAECs). The interior volume of the chamber was measured to be 9 μl; therefore, the chamber contained ∼2 nmol of O2, assuming that the O2 concentration in the media equilibrated with the air is 220 mM. That amount of O2 should be consumed by the cells in the chamber in ∼3 min, based on the determined rate of O2 consumption. Since the available O2 supply in the chamber was limited to 3 min, turning off the flow of media through the chamber would induce nearly immediate hypoxia due to O2 consumption by the cells; conversely, turning on the flow of fresh media would have the effect of reoxygenation.
Fig. 1.
Dynamics of metabolic O2 consumption by cells. Quenching by O2 is reduced at lower concentrations, leading to stronger phosphorescence. O2 exchange between the media and outside environment was inhibited at time 0. The solid line is a monoexponential fit with a time constant of 114 ± 1 min.
Hypoxia and reoxygenation during IH modulate the apparent PKA activity.
AKAR3 is a well-characterized FRET sensor whose FRET ratio depends on its phosphorylation level in HEK-293 (1) and HeLa cells (27); a higher FRET ratio implies a higher phosphorylation level and, thus, higher apparent PKA activity. When expressed in living cells, the FRET ratio of AKAR3 in essence reflects the balance between the activities of PKA and PKA-counteracting phosphatases, such as protein phosphatase (PP)1 and PP2b (1, 27, 53). The response of AKAR3 to stimulation by Iso (see Supplemental Material, Supplemental Figs. 1 and 2) was identical to previous observations (1).1
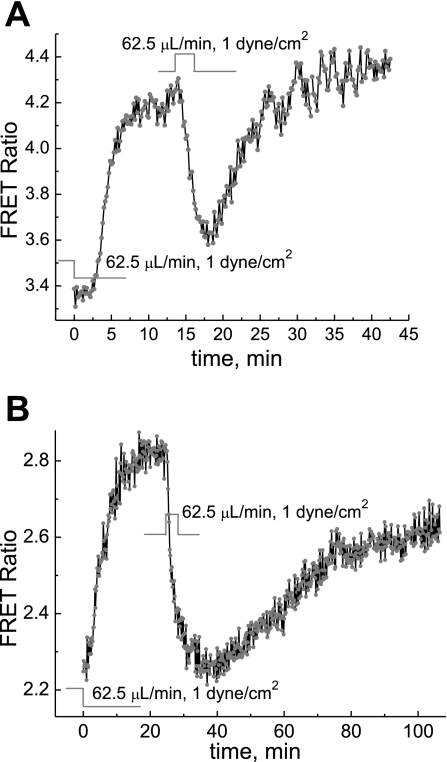
For experiments detecting the PKA response to hypoxia and reoxygenation, a coverglass with a monolayer of cells, 24–48 h after transfection with AKAR3, was assembled into the microfluidic chamber for microscopic fluorescence measurements of the AKAR3 FRET signal. During and after the assembly of the flow chamber, the syringe pump was kept on so that when the chamber was sealed, there was a flow of DMEM media at a controlled flow rate of 62.5 μl/min (shear stress of 1 dyn/cm2). Five to twenty minutes after the assembly of the chamber, when the temperature was stabilized at 37°C, the flow of DMEM media to the chamber was switched off to induce hypoxia in the cells in the chamber. Stop of the flow of oxygenated media and O2 consumption by cells in the chamber resulted in hypoxic conditions. As shown in Fig. 2, switching off the oxygenated flow of media resulted in a rapid increase in the apparent PKA activity, as indicated by the increase in FRET signals, which reached a maximum in <10 min. After the AKAR3 FRET signals leveled off, reoxygenation by switching on the flow of the oxygenated DMEM media caused a fast decrease of the FRET signal; the decay time constants were ∼90 s in MC3T3-E1 cells and ∼2 min in BAECs. When the flow was stopped for the second time, the PKA activity increased reproducibly, although the response was notably slower than the first time (Fig. 2).
Fig. 2.
Dynamics of PKA activity in cells in response to depletion of O2 and reoxygenation. The O2 depletion was due to natural cellular metabolism. Stopping the flow through the chamber induced a rapid increase in the AKAR3 fluorescence resonance energy transfer (FRET) signal in MC3T3-E1 cells (A) and bovine aortic endothelial cells (BAECs; B), respectively. Reoxygenation by resuming the flow induced a rapid decrease in the AKAR3 FRET signal. The increased AKAR3 FRET signal indicates increased apparent PKA activity. The perfusion media was DMEM. The initial normoxic condition was maintained by keeping the flow rate at 62.5 μl/min.
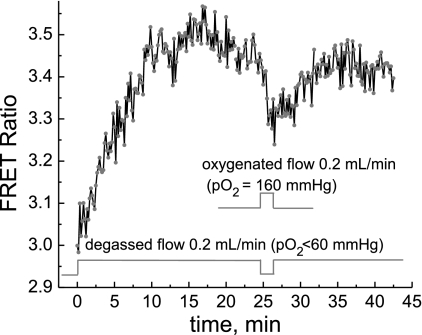
The above response of PKA activity to the level of O2 in the media was also studied using flow media with a controlled O2 content; this was achieved by switching the flow between degassed DMEM (or DPBS + 5.5 mM glucose buffer) with a Po2 of <60 mmHg and media equilibrated with air with a Po2 of 160 mmHg. Exposure of cells to degassed media at a constant flow rate of 0.2 ml/min to maintain Po2 at 60 mmHg caused the apparent PKA activity to increase (Fig. 3). The response was slower compared with that shown in Fig. 2A, indicating that the metabolic O2 consumption by cells was more efficient in reducing Po2. Reoxygenation by the flow of air-equilibrated media (Po2 of 160 mmHg) led to a rapid decrease of the apparent PKA activity, similar to the effect of switching on oxygenated media (also air equilibrated), as in Fig. 2. Repeated hypoxia could also induce increased PKA activity, which was slower than after first exposure, similar to that shown in Fig. 2. Identical results were obtained in DMEM and DPBS buffer supplemented with 5.5 mM glucose.
Fig. 3.
Dynamics of PKA activity in cells in response to depletion of O2 and reoxygenation. O2 depletion was achieved by perfusion of cells with media of controlled Po2. Perfusion with degassed media (DMEM, Po2 < 60 mmHg) increased the AKR3 FRET signal, whereas perfusion with air-equilibrated media (DMEM, Po2 = 160 mmHg) induced a rapid decrease in the AKAR3 FRET signal.
Since the induction of hypoxia by the cellular consumption of O2 was more efficient than perfusion with media of controlled Po2 and also because metabolic O2 consumption is possibly a closer mimic of the dynamics in the cellular environment in vivo, the rest of the hypoxia experiments in this study relied on metabolic O2 consumption by cells.
CoCl2 induces increases in PKA activity.
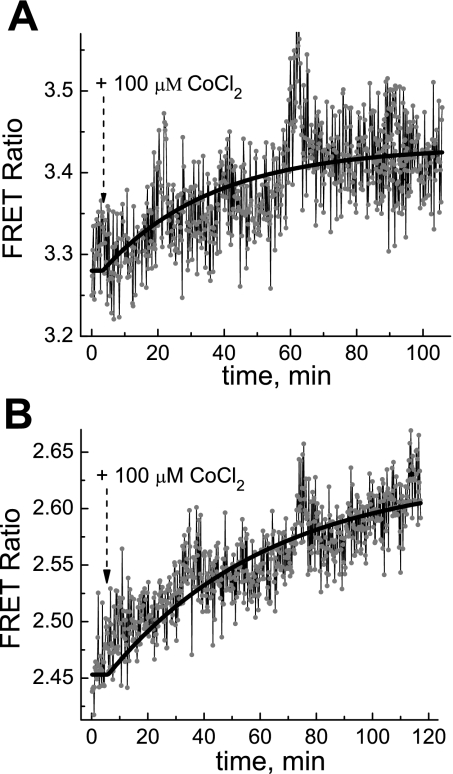
In this study, CoCl2 treatment under normoxic conditions was used to see if it would have similar effects on PKA activity as hypoxia, which induces increased PKA activity in MC3T3-E1 cells and BAECs. Figure 4, A and B, shows that CoCl2 at 100 μM indeed induced a slow yet apparent increase in PKA activity in both type of cells.
Fig. 4.
Dynamics of the apparent PKA activity in MC3T3-E1 cells (A) and BAECs (B) in response to 100 μM CoCl2 treatment in DMEM. The solid lines are monoexponential fits with time constants of 0.55 h (A) and 0.97 h (B).
Glucose reverses the PKA response to hypoxia and reoxygenation.
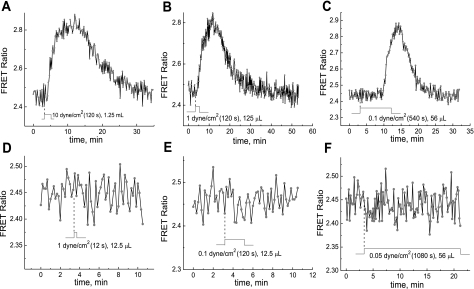
Figure 5 shows that the reoxygenation of MC3T3-E1 cells (under hypoxia due to O2 consumption by cells) incubated in DPBS buffer containing 5.5 mM of glucose caused decreased PKA activity, similarly to that observed in DMEM (Fig. 2A). In addition, repeated hypoxia (stop of flow of the oxygenated media) caused a slower yet apparent increase of PKA activity. In contrast, we observed that in the absence of glucose in the media, the sign of a response of PKA activity to hypoxia and reoxygenation was opposite (Fig. 6, A–C). Onset of the flow of the media (reoxygenation) caused an increase in PKA activity in MC3T3-E1 cells under hypoxia in DPBS buffer (with no glucose; Fig. 6, A–C); after stop of the flow of air-equilibrated media, the increased PKA activity returned to the initial level (Fig. 6, A–C). Thus, hypoxia and reoxygenation have opposite effects on PKA activity in MC3T3-E1 cells depending on the presence or absence of glucose in the media.
Fig. 5.
Dynamics of the apparent PKA response to reoxygenation in MC3T3-E1 cells in the presence of glucose. Dulbecco's PBS (DPBS) buffer with the addition of 5.5 mM glucose was used as the perfusion media.
Fig. 6.
Effect of fluid shear stress (FSS), magnitude of FSS, and flow volume on the PKA activity response to hypoxia and reoxygenation. DPBS buffer (without the addition of glucose) was used as the incubation media; cells were subjected to hypoxia by the metabolic consumption of O2. The time evolution of the AKAR3 FRET signal was detected during reoxygenation by reperfusion with air-equilibrated DPBS buffer under different flow rates and durations (A–F).
The PKA activity change in response to hypoxia is independent of fluid shear stress magnitude.
Experiments were performed to test if the PKA response is dependent on the strength of fluid shear stress (FSS), since the protein kinase response to FSS can be dependent on the strength of the mechanical stress (12).
MC3T3-E1 cells transfected with AKAR3 under hypoxia in DPBS (without glucose) were exposed to reoxygenation. Switching on the flow (reoxygenation) with a shear stress magnitude varied from 10 to 1 to 0.1 dyn/cm2 caused a rather similar increases in PKA activity, as shown in Fig. 6, A, B, and C, respectively.
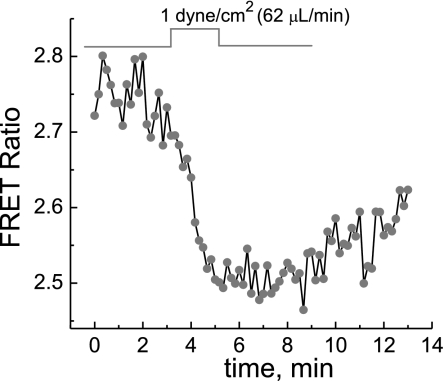
The shear stress dependence of the PKA response was further examined in greater detail. It was found that the flow of media with FSS of 1 or 0.1 dyn/cm2 for longer durations (120 s at 1 dyn/cm2 and 540 s at 0.1 dyn/cm2; Fig. 6, B and C, respectively) led to significant PKA activity changes, whereas the impulse flow of media with the same FSS but of shorter duration (12 s at 1 dyn/cm2 and 120 s at 0.1 dyn/cm2, respectively) failed to cause any PKA activity change (Fig. 6, D and E). Identical behavior was also noted when the flow medium with glucose (DMEM) was used.
The flow of media with shear stress of 0.05 dyn/cm2 for as long as 1,080 s (Fig. 6F) did not cause any PKA activity change.
The PKA activity change in response to hypoxia is cAMP independent.
The FRET sensor ICUE3 (1) was used to monitor the dynamics of cAMP concentration changes in MC3T3-E1 cells using the same experimental setup and conditions as used for monitoring PKA activity.
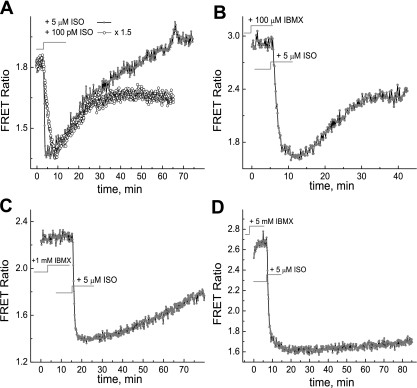
The kinetics of cAMP decay were measured by detecting the ICUE3 FRET signal as a function of time in response to stimulation with 5 μM Iso in cells under normoxia. This was done to 1) determine the rate of the cAMP concentration decay due to hydrolysis by phosphodiesterases (PDE) and 2) compare the rate of cAMP decay to the rate of PKA activity decay due to reoxygenation, which is on the order of ∼90 s. Figure 7A shows that the cAMP concentration rapidly increased to maximum in response to stimulation with 5 μM Iso and then returned to approximately the basal level in ∼60 min. In the presence of increased concentrations of IBMX at 100 μM, 1 mM, and up to 5 mM, PDE hydrolysis was increasingly inhibited (Fig. 7, B–D). Note that both the response and decay kinetics of the ICUE3 FRET signal were slower when cells were stimulated by lower concentrations of Iso (100 pM; see Fig. 7A).
Fig. 7.
Measurements of the decay rate of cAMP due to hydrolysis by phosphodiesterases at different concentrations of IBMX. A: no IBMX; B: 100 μM IBMX; C: 1 mM IBMX; D: 5 mM IBMX. The cAMP concentration was monitored using the ICUE3 FRET sensor. A lower FRET ratio indicates higher cAMP concentration. cAMP production was stimulated by 5 μM isoproterenol (Iso; A–D, shaded circles) and 100 pM Iso (A, open circles, normalized to the signal at the 5 μM level by 1.5 × upscaling factor).
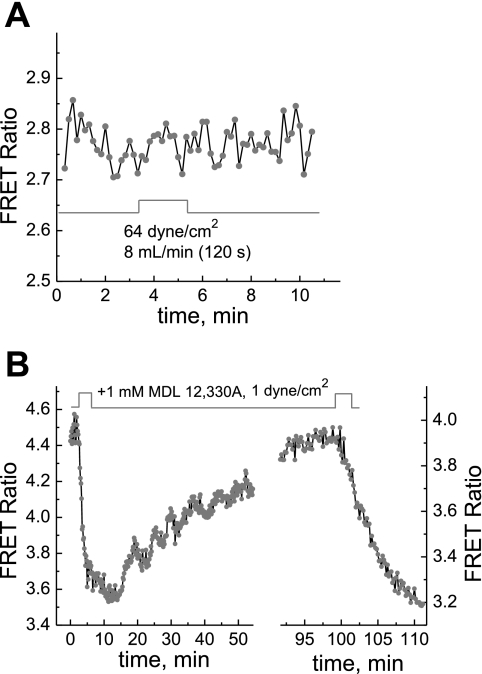
We found that hypoxia/reoxygenation did not have any detectable effect on cAMP levels in MC3T3-E1 cells transfected with the ICUE3 FRET sensor under the same conditions that had caused significant PKA responses (Fig. 8A).
Fig. 8.
A: dynamics of cAMP activity in cells in response to reoxygenation as detected by the ICUE3 FRET sensor. The O2 depletion was due to natural cellular metabolism. B: the PKA response to hypoxia in the presence of the adenylate cyclase inhibitor MDL-12,330A.
The relative sensitivity of ICUE3 and AKAR3 sensors in cultured MC3T3 cells was determined using Iso stimulation at subnanomolar concentrations at which adenylate cyclase activity and the FRET response are not saturated yet (see Supplemental Material, Supplemental Fig. 2).
We also tested the effect of the adenylate cyclase inhibitor MDL-12,330A (IC50 ∼ 250 μM) (19) on the PKA response to hypoxia/oxygenation. This experiment was performed under the same conditions as the experiment in Fig. 2A except in the presence of 1 mM MDL-12,330A in the media. Figure 8B shows that AKAR3-transfected MC3T3-E1 cells under hypoxia exhibited similar dynamics of the PKA activity response to reoxygenation (switching on the perfusion of DMEM media containing 1 mM MDL-12,330A) and to hypoxia, while cAMP generation by adenylate cyclase was suppressed. Note that MDL-12,330A completely blocks the response to stimulation by Iso, indicating that the adenylate cyclase/cAMP pathway is inhibited (see Supplemental Material, Supplemental Fig. 1).
PKA-counteracting phosphatases are involved in modulating the apparent PKA activity.
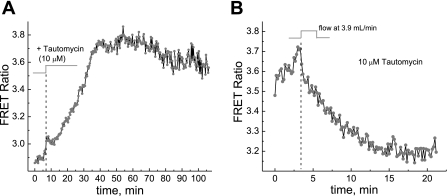
Figure 9A shows that the administration of 10 μM tautomycin (a potent inhibitor of PP1 and PP2a) caused an increase of AKAR3 FRET signals in MC3T3-E1 cells, whereas Fig. 9B shows that the response of the apparent PKA activity to reoxygenation in the presence of tautomycin was more than five times slower (∼20 vs. 2–3 min) even at a higher flow rate of 3.9 ml/min.
Fig. 9.
A and B: the PKA response to phosphatase inhibition (A) and effect of phosphatase inhibition on the apparent PKA response to hypoxia and reoxygenation (B). When MC3T3-E1 cells were treated with 10 μM tautomycin to inhibit PKA-counteracting phosphatases, the AKAR3 FRET signal increased, indicating an increase in the apparent PKA activity due to the inhibition of phosphatases (A). The normoxic condition was maintained by keeping the flow rate at 62.5 μl/min. In the presence of 10 μM tautomycin, reoxygenation by reperfusion caused a slower decrease in the AKAR3 FRET signal (B).
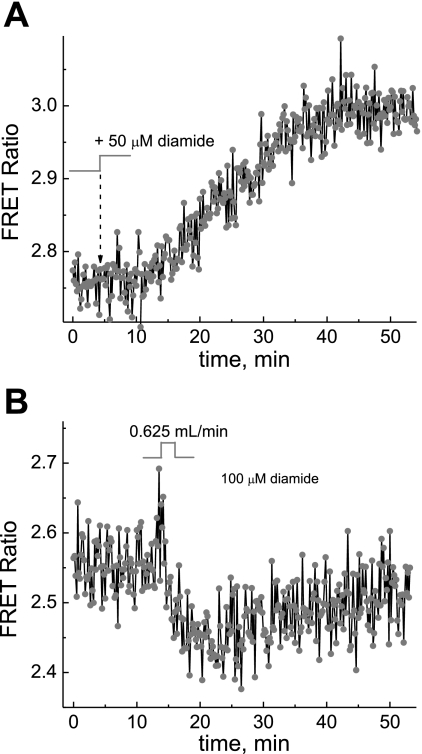
To test if redox potential plays a role in modulating PKA activity in the cells, we carried out an experiment to see what effect diamide, a mild oxidizing agent that oxidizes PP1 selectively at 50 μM and irreversibly at 100 μM (27), may have on PKA activity and its response to hypoxia. Figure 10A shows that selective oxidation of PP1 caused an increase in apparent PKA activity. The data in Fig. 10B indicate that the PKA response to reoxygenation and hypoxia (stopping of the flow) was severely attenuated in the presence of 100 μM diamide (compare with Fig. 2A).
Fig. 10.
A and B: dynamics of the PKA response to oxidation of the cellular environment (A) and effect of oxidation on the PKA response to hypoxia and reoxygenation (B). Treatment of MC3T3-E1 cells with 50 μM diamide selectively oxidized PKA-counteracting phosphatases, leading to an increase of the AKAR3 FRET signal (A). In the presence of 100 μM diamide, reoxygenation and hypoxia caused only small changes in the AKAR3 FRET signal (B).
ROS accumulate in cells under hypoxia.
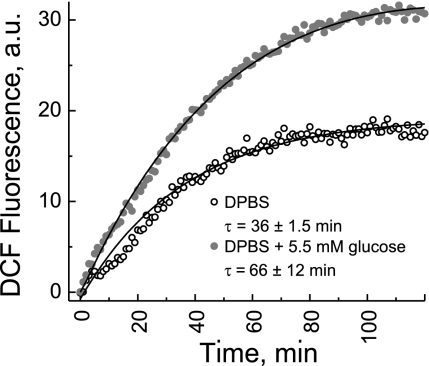
We investigated ROS accumulation in MC3T3-E1 cells in response to hypoxia due to the metabolic depletion of O2 in the media. Figure 11 shows the intensity of DCF fluorescence from MC3T3-E1 cells as a function of time in response to sealing off (at time 0) O2 exchange between cell suspension media in the well and the environment. The data showed that the ROS accumulation started immediately after O2 exchange was inhibited, providing additional evidence that redox potential in MC3T3-E1 cells responds rapidly to the depletion of O2. ROS were generated both in the presence and absence of glucose in suspension media, although in the absence of glucose the ROS accumulation rate was ∼80% faster.
Fig. 11.
Accumulation of ROS due to hypoxic conditions in response to the metabolic consumption of O2 by cells detected using 2′,7′-dichlorofluorescein (DCF) fluorescence. O2 exchange between the cell suspension and outside environment was inhibited at time 0. The solid lines are monoexponential fits with the time constants (τ) as indicated on the graph.
DISCUSSION
Below we present a detailed analysis of the experimental data. We show that the observed change in the apparent PKA activity in response to hypoxia and reoxygenation is cAMP independent and results from balancing of activities of PKA and PKA-counteracting phosphatases. Furthermore, we propose that this balance is modulated by the redox potential, which is affected by O2 concentration.
The O2 level regulates the apparent PKA activity.
According to the data shown in Fig. 3, when cells inside the chamber were perfused with media driven through the in-line degasser, the AKAR3 FRET ratio increased, indicating an increase in the apparent PKA activity when O2 is lowered. In contrast, upon a switch to air-equilibrated media with a higher O2 content, the AKAR3 FRET signal decreased. This demonstrates that PKA activity is closely regulated by the level of O2 in the media. Since AKAR3 is a substrate of both PKA and PKA-counteracting phosphatases, its FRET ratio indicates the phosphorylation level and reflects the balance between PKA and PKA-counteracting phosphatases. The O2 pressure range of 60–160 mmHg used in this study overlaps with the range of 40–100 mmHg, which is known to cause acute and sensitive responses by tissues specialized in O2 sensing (62). As shown in Fig. 2, A and B, switching off or on of the flow of media has the same effect as perfusion with degassed or air-equilibrated media, causing an increase or decrease in PKA activity, respectively. In this case, the O2 depletion is caused by metabolic O2 consumption by cells, but the resulting effect on the apparent PKA activity is the same. Thus, our experiments suggest that the hypoxic condition induces an increase, whereas reoxygenation induces a rapid decrease, in the apparent PKA activity (Figs. 2, A and B, and 3).
Although a study (52) has shown that CoCl2 and hypoxia are not identical in the molecular mechanisms underlining the cellular responses, such as HIF pathway activation, CoCl2 is commonly used as a mimetic of hypoxia under normoxia conditions. The experimental data shown in Fig. 4, A and B, clearly demonstrate that CoCl2 induces slow yet apparent increase in PKA activity in both type of cells, causing the same effect as lack of O2 as shown in Figs. 2 and 3. It has been reported in the literature that response times to CoCl2 are rather slow, on the time scale of 30–60 min, which is consistent with our observation of the dynamics of the PKA response (8).
Taken together, experiments shown in Figs. 2–4 suggest that the O2 level in the media closely regulates the apparent PKA activity. Low O2 induces increased PKA activity, and high O2 decreases PKA activity.
Importantly, we also found that glucose in the media plays a major role in the apparent PKA activity response to the O2 level. We observed that the effect of the O2 level on PKA activity in the absence of glucose in DPBS was opposite: hypoxia and reoxygenation caused a decrease and an increase in PKA activity, respectively, as shown in Fig. 6, A–C. This opposite response of PKA to O2 is attributed to glucose and not to any other components in DMEM, since, as the data shown in Fig. 5 demonstrate, reoxygenation deceases PKA activity, whereas hypoxia (stopping of the flow) increases PKA activity, in MC3T3-E1 cells incubated in DPBS with the addition of 5.5 mM glucose. We tentatively attribute the effect of glucose to the changes in redox potential since glucose is the substrate of the pentose phosphate (shunt) pathway, which is enhanced or dominant during cellular energy production; therefore, it is expected that the presence or absence of glucose in the media will affect NAD(P)H generation when cells switch from aerobic to anaerobic glucose metabolism induced by hypoxia conditions.
FSS does not affect apparent PKA activity in cells.
FSS activates multiple signal transduction pathways involving PKA in MC3T3-E1 cells (55) and endothelial cells (5, 6, 11, 14). Because the hypoxic and reoxygenation conditions in this study required the perfusion of cells with media, it is important to take into account the contribution of FSS, which is always associated with the flow of the media.
The added advantage of relying on cellular O2 consumption to achieve a lower O2 condition is that this method has no shear stress associated with it (unlike the case of the experiment shown in Fig. 3.). The experiments shown in Figs. 2A and B support the hypothesis that the FRET ratio increases shown in Fig. 3 are due to lowered or increased O2 content rather than shear stress. The effect or contribution of shear stress to the apparent PKA activity change in the experiment shown in Fig. 3 was addressed in experiments shown in Fig. 6, A–F, where control of the flow rate was used to separate the effect of FSS from the effect of changes in the O2 level in the media. Switching on the flow with varied shear stress from 10 to 1 to 0.1 dyn/cm2 caused a rather similar increase in PKA activity, as shown in Fig. 6, A, B, and C, respectively. Typically, shear stress of physiological significance is ∼15 dyn/cm2 for endothelial cells (42); in this study, however, shear stress as low as 0.1 dyn/cm2 was as effective as 10 dyn/cm2 in causing the PKA activity change. Apparently, our observed PKA activity change is shear stress magnitude independent. The shear stress dependence of the PKA response was further examined in greater detail, since it is possible that both the O2 content in the media and shear stress associated with the flow caused the PKA activity change. To separate the effect of shear stress from that of changes in the O2 content, cells were stimulated with either low FSS in the range of 0.1–1 dyn/cm2 or with a flow “impulse” of very short duration. The flow duration of such impulse was chosen to minimize exchange of the media in the microfluidic chamber so that the O2 content in the chamber would be minimally changed and to solely exert the effect of shear stress. As mentioned above, the flow of media of shear stress of 1 or 0.1 dyn/cm2 for longer durations (120 s at 1 dyn/cm2 and 540 s at 0.1 dyn/cm2; Fig. 6, B and C, respectively) led to significant PKA activity changes, whereas the impulse flow of media with the same shear stress but of shorter duration (12 s at 1 dyn/cm2 and 120 s at 0.1 dyn/cm2; Fig. 6, D and E, respectively) did not cause any PKA activity change. These results are consistent with our hypothesis that the FSS associated with the flow of the media does not contribute to the PKA activity change that we observed. We hypothesized that very slow flow of media, incapable of supplying enough O2 to the chamber, should fail to affect PKA activity. The data shown in Fig. 6F confirm that the flow of media with shear stress of 0.05 dyn/cm2 for as long as 1,080 s did not cause any PKA activity change.
Taken together, these results suggest that the effect of FSS on stimulating PKA activity is minimal. It is the O2 content and the rate of its supply that are relevant to the response of PKA.
The apparent PKA activity change is independent of cAMP.
Since PKA activity is primarily and directly regulated by cAMP, we hypothesized that the cAMP concentration inside cells may change depending on the level of O2 in the surroundings of cells. However, we found that hypoxia/reoxygenation did not have any detectable effect on cAMP levels in MC3T3-E1 cells expressing the ICUE3 FRET sensor when cells were subjected to the same conditions that had caused significant PKA responses (see Fig. 8A). This implies that the observed PKA response to hypoxia/oxygenation is not caused by changes in the cAMP concentration. However, there are two possible reasons why potential cAMP changes due to variations in O2 may not be detected by ICUE3 FRET sensors. First, ICUE sensors have been reported to be sensitive to the cAMP concentration in the micromolar range (38, 54, 63), whereas PKA responds to cAMP in the nanomolar range (63); if the cAMP concentration change in response to hypoxia/reoxygenation is in the submicromolar range, the ICUE3 response could be weak. Second, the PKA response is highly localized or compartmentalized (23, 40, 44), and, therefore, a very localized cAMP concentration change in the micromolar range may not be detected by ICUE3. In previous studies, the sensitivity of ICUE and AKAR3 sensors was estimated in vitro in cell lysates; it could be different in vivo due to different localization or compartmentalization of the sensors. Therefore, we performed experiments to quantify the sensitivity of ICUE3 and AKAR3 sensors to cAMP changes in cultured MC3T3-E1 cells (Supplemental Material, Supplemental Fig. 2). These data indicate that the sensitivity of AKAR3 and ICUE3 to stimulation through the cAMP pathway is rather similar because the stimulation of both sensors in MC3T3-E1 cells using Iso at subnanomolar concentrations (which are below the FRET saturation level of these sensors) led to a response down to 10 pM Iso for both sensors (see Supplemental Fig. 2). However, the magnitude of the FRET response of the AKAR3 sensor to hypoxia/reoxygenation (see, e.g., Fig. 2A) was larger than its response to 10 pM Iso (see Supplemental Fig. 2A). This indicates that if the cAMP pathway was responsible for the hypoxia/reoxygenation response, the cAMP levels due to hypoxia/reoxygenation would be high enough for the ICUE3 sensor to respond. Therefore, the absence of an ICUE3 response to hypoxia/reoxygenation (Fig. 8A) suggests that the cAMP pathway is not involved.
Two lines of experiments were carried out to further address the involvement of cAMP in regulating PKA activity during the cell's response to changes in the O2 level in the media. First, we examined the dynamics of a cAMP concentration change in cells to see if the rise and fall of cAMP concentration may account for the increase and rapid decrease of PKA activity, as shown in Fig. 2, A and B; note that the decay time constant of the FRET ratio (i.e., the apparent PKA activity) in response to reoxygenation is ∼90 s in MC3T3-E1 cells. The rate of cAMP decay was measured by detecting the ICUE3 FRET signal as a function of time in response to stimulation with 5 μM and 100 pM Iso in the cells under normoxia to compare the rate of cAMP concentration decay in cells due to hydrolysis by PDE to that of PKA activity decay due to reoxygenation. The data shown in Fig. 7A indicate that the decay of cAMP by PDE hydrolysis is a much slower process (decay time constant > 20 min at 100 pM Iso) compared with the decay of PKA activity due to reoxygenation (note that the low FRET ratio of ICUE3 corresponds to a high cAMP concentration). Since the kinetics of the decay of cAMP is affected by the rise of cAMP, the total dynamics of cAMP were obtained in the presence of increased concentrations of IBMX (an inhibitor of PDE) at 100 μM, 1 mM, and 5 mM, a concentration at which PDE hydrolysis is completely inhibited (Fig. 7, B–D). Figure 7D shows that when cAMP decay by PDE hydrolysis is fully inhibited, the rise in cAMP concentration is finished in ∼1 min, indicating that the decay kinetics of cAMP shown in Fig. 7A are not significantly affected by the rise of cAMP. The time scale of the response of the ICUE FRET reporter to both the increase and decrease in cAMP concentration has been characterized (15) and is on the order of <30 s, which would be more than sufficient to resolve the dynamics of the response to hypoxia/reoxygenation observed in our experiments. Thus, we conclude that the rapid decay of PKA activity due to reoxygenation, as shown in Fig. 2, A and B, cannot be explained by the decay of cAMP concentration. We also conclude that the increase of PKA activity due to a reduced O2 concentration is not due to the rise in cAMP, since apparently the decrease in PKA activity in response to reoxygenation is not caused by the fall in cAMP concentration in the first place.
Finally, since adenylate cyclase catalyzes the conversion of ATP into cAMP, one could expect that changes in adenylate cyclase activity in response to hypoxia or reoxygenation might affect cAMP levels. The data shown in Supplemental Fig. 1 demonstrate that adenylate cyclase is completely inhibited by MDL-12,330A. However, inhibition of adenylate cyclase by MDL-12,330A did not have any significant effect on the PKA activity response to hypoxia/reoxygenation (Fig. 8B), strongly suggesting that the adenylate cyclase/cAMP pathway is not involved in the hypoxia/reoxygenation response.
Based on the above results showning that 1) the ICUE3 FRET signal does not respond to O2 level changes (Fig. 8A), 2) the decay of cAMP is too slow to fully account for the fast decay of PKA activity due to oxygenation (Fig. 7A), 3) inhibition of adenylate cyclase has no effect on the apparent PKA activity response to O2 level changes (Fig. 8B and Supplemental Fig. 1), and 4) the magnitude of the AKAR3 response to hypoxia/reoxygeneation is similar to that caused by subnanomolar concentrations of Iso (corresponding to cAMP levels detectable by ICUE3; Figs. 2A and 8B and Supplemental Fig. 2, A and B), we conclude that the PKA activity response to the O2 level is independent of cAMP changes in these cells.
The redox potential in response to the O2 level affects the balance between PKA and PKA-counteracting phosphatases.
It has been shown that the phosphorylation level of AKAR3 can be altered by PKA and multiple PKA-counteracting phosphatases, including PP1, PP2a, PP2b, and PP2c (27). In HeLa cells, it has been shown that PP1 and possibly PP2c, but not PP2a and PP2b, act against PKA on AKAR3 in a redox potential-dependent manner (27). First, our experiments showed that phosphatases are indeed involved in counterbalancing PKA activities in the cells used in this study. As shown in Fig. 9A, tautomycin, a potent PP1 and PP2a inhibitor (Ki for PP1 is ∼5 nM, which is slightly more effective than for PP2a), caused an increased AKAR3 FRET signal in MC3T3-E1 cells. As shown in Fig. 10A, when PP1 was selectively oxidized with 50 mM diamide (27), the apparent PKA activity also increased, as evidenced by the FRET signal increase. Both results (Figs. 9A and 10A) provide support that PP1 and possibly PP2a act against PKA activities.
Second, our experiments indicated that these phosphatases are involved in acting against PKA activity in response to the change in O2 levels in the media. As shown in Fig. 9B, the PKA apparent activity response to reoxygenation in the presence of tautomycin was more than five times (∼20 min vs. a few minutes) slowed down, suggesting that PP1 and PP2a act against PKA activity when cells are reoxygenated. The data shown in Fig. 10B demonstrate that the amplitude of the PKA response to reoxygenation and hypoxia was strongly attenuated in the presence of 100 μM diamide, a condition in which diamide irreversibly oxidizes PP1 and possibly PP2c (27). This suggests that the observed PKA activity change in response to O2 levels is actually due to changes in the activities of phosphatases, whereas PKA itself does not respond to O2 level changes, i.e., the increase in the O2 concentration in the media causes an increase in the activities of PKA-counteracting phosphatases, whereas a reduction in O2 concentration inhibits phosphatase activities. This implies that the activities of these phosphatases are regulated by redox potentials, which are affected by the O2 level in the media.
There are numerous studies demonstrating the effect of hypoxia on redox potentials in cells (e.g., Ref. 60). The question of whether hypoxia leads to increased or decreased ROS production is still a matter of debate (59–61). However, there is mounting experimental evidence implying that hypoxia stimulates ROS generation (for reviews, see Refs. 10 and 60). Our results using a fluorescent ROS probe (H2DCFDA; see Fig. 11) confirm that indeed, in MC3T3-E1 cells, hypoxia leads to ROS generation. It has been shown that ROS affects redox potential and modulates PKA activities in cells (24, 25, 27, 48). Particularly, it has been demonstrated that PKA signaling is regulated by the redox potential in cells by altering PKA-counteracting phosphatases activites (27). Therefore, although the PKA itself mostly relies on cAMP for activation, the apparent PKA activity level can be modulated by the oxidative stress exerted by ROS.
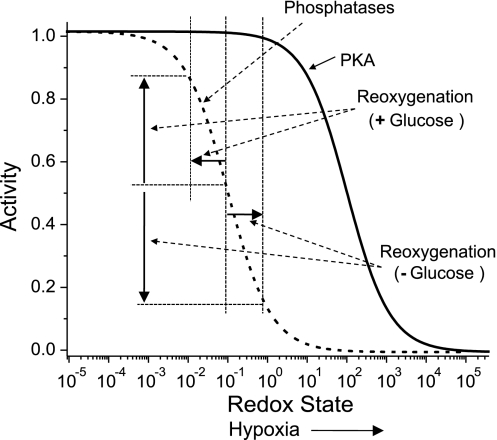
It is generally accepted that during hypoxia the cellular metabolism switches to glycolysis as mitochondria become starved for O2. It has been long suggested that ROS are essential mediators of hypoxia/reoxygenation injury (18). Recently, it has been directly confirmed that reoxygenation and glucose depletion causes ROS production (50). These findings in combination with our data described above enables us to propose a simplified model that explains the change in the sign of the FRET level in response to reoxygenation in MC3T3-E1 cells (see Fig. 12). Figure 12 shows the expected activity of PKA and phosphatases as a function of oxidative stress. Acute IH induces ROS (characterized by an increase in redox state; Fig. 12), which, in turn, inhibits PPs and PKA to a degree determined by the redox state (i.e., the position on the x-axis in Fig. 12). The response to reoxygenation depends on whether glucose is present in the medium. In the presence of glucose, reoxygenation reduces oxidative stress, leading to increase phosphatase activity, which manifests as decrease in the AKAR3 FRET ratio. In the absence of glucose, reoxygenation leads to an increase in oxidative stress (50), resulting in lower phosphatase activity and a higher AKAR3 FRET ratio.
Fig. 12.
Model explaining the activity responses of PKA and phosphatases to hypoxia and reoxygenation at different redox conditions.
Conclusions.
The main conclusion of this study is that the overall level of apparent PKA activity (i.e., phosporylation level of PKA substrate) in cells under hypoxia is regulated via a redox potential-dependent pathway rather than a cAMP-dependent pathway. This is consistent with growing number of publications suggesting that oxidants can also act as secondary messengers in cellular signal transduction pathways(e.g., Ref. 36). cAMP and PKA activity are not altered during acute hypoxia under our experimental conditions. The change in the overall level of apparent PKA activity in response to hypoxia and reoxygenation is mediated through changes in the redox potential, which regulates the activities of PKA-counteracting phosphatases such as PP1.
GRANTS
This work was funded by National Heart, Lung, and Blood Institute Grant HL-086943 (to M. Chachisvilis).
DISCLOSURES
No conflicts of interest, financial or otherwise, are declared by the author(s).
ACKNOWLEDGMENTS
The authors thank Dr. Zhang Jin's laboratory at Johns Hopkins University for providing the PKA FRET sensor AKAR3 (M. D. Allen) and cAMP FRET sensor ICUE3 (L. M. Dipilato). Helpful discussions with Dr. John A. Frangos are acknowledged. The authors also thank Dr. Pedro Cabrales for the measurements of Po2 in media.
Footnotes
Supplemental Material for this article is available online at the American Journal of Physiology-Heart and Circulatory Physiology website.
REFERENCES
- 1.Allen MD, Zhang J. Subcellular dynamics of protein kinase A activity visualized by FRET-based reporters. Biochem Biophys Res Commun 348: 716–721, 2006 [DOI] [PubMed] [Google Scholar]
- 2.Archer SL, Michelakis ED, Thebaud B, Bonnet S, Moudgil R, Wu XC, Weir EK. A central role for oxygen-sensitive K+ channels and mitochondria in the specialized oxygen-sensing system. Novartis Found Symp 272: 157–171, 2006 [PubMed] [Google Scholar]
- 3.Beitner-Johnson D, Leibold J, Millhorn DE. Hypoxia regulates the cAMP- and Ca2+/calmodulin signaling systems in PC12 cells. Biochem Biophys Res Commun 242: 61–66, 1998 [DOI] [PubMed] [Google Scholar]
- 4.Bolon ML, Ouellette Y, Li F, Tyml K. Abrupt reoxygenation following hypoxia reduces electrical coupling between endothelial cells of wild-type but not connexin40 null mice in oxidant- and PKA-dependent manner. FASEB J 19: 1725–1727, 2005 [DOI] [PubMed] [Google Scholar]
- 5.Boo YC, Jo H. Flow-dependent regulation of endothelial nitric oxide synthase: role of protein kinases. Am J Physiol Cell Physiol 285: C499–C508, 2003 [DOI] [PubMed] [Google Scholar]
- 6.Boo YC, Sorescu G, Boyd N, Shiojima I, Walsh K, Du J, Jo H. Shear stress stimulates phosphorylation of endothelial nitric-oxide synthase at Ser1179 by Akt-independent mechanisms: role of protein kinase A. J Biol Chem 277: 3388–3396, 2002 [DOI] [PubMed] [Google Scholar]
- 7.Chachisvilis M, Zhang YL, Frangos JA. G protein-coupled receptors sense fluid shear stress in endothelial cells. Proc Natl Acad Sci USA 103: 15463–15468, 2006 [DOI] [PMC free article] [PubMed] [Google Scholar]
- 8.Chandel NS, Maltepe E, Goldwasser E, Mathieu CE, Simon MC, Schumacker PT. Mitochondrial reactive oxygen species trigger hypoxia-induced transcription. Proc Natl Acad Sci USA 95: 11715–11720, 1998 [DOI] [PMC free article] [PubMed] [Google Scholar]
- 9.Cimarosti H, Henley JM. Investigating the mechanisms underlying neuronal death in ischemia using in vitro oxygen-glucose deprivation: potential involvement of protein SUMOylation. Neuroscientist 14: 626–636, 2008 [DOI] [PMC free article] [PubMed] [Google Scholar]
- 10.Clanton TL. Hypoxia-induced reactive oxygen species formation in skeletal muscle. J Appl Physiol 102: 2379–2388, 2007 [DOI] [PubMed] [Google Scholar]
- 11.Csiszar A, Labinskyy N, Smith KE, Rivera A, Bakker EN, Jo H, Gardner J, Orosz Z, Ungvari Z. Downregulation of bone morphogenetic protein 4 expression in coronary arterial endothelial cells: role of shear stress and the cAMP/protein kinase A pathway. Arterioscler Thromb Vasc Biol 27: 776–782, 2007 [DOI] [PubMed] [Google Scholar]
- 12.Dimmeler S, Fleming I, Fisslthaler B, Hermann C, Busse R, Zeiher AM. Activation of nitric oxide synthase in endothelial cells by Akt-dependent phosphorylation. Nature 399: 601–605, 1999 [DOI] [PubMed] [Google Scholar]
- 13.DiPilato LM, Cheng X, Zhang J. Fluorescent indicators of cAMP and Epac activation reveal differential dynamics of cAMP signaling within discrete subcellular compartments. Proc Natl Acad Sci USA 101: 16513–16518, 2004 [DOI] [PMC free article] [PubMed] [Google Scholar]
- 14.Dixit M, Loot AE, Mohamed A, Fisslthaler B, Boulanger CM, Ceacareanu B, Hassid A, Busse R, Fleming I. Gab1, SHP2, and protein kinase A are crucial for the activation of the endothelial NO synthase by fluid shear stress. Circ Res 97: 1236–1244, 2005 [DOI] [PubMed] [Google Scholar]
- 15.Dunn TA, Wang CT, Colicos MA, Zaccolo M, DiPilato LM, Zhang J, Tsien RY, Feller MB. Imaging of cAMP levels and protein kinase a activity reveals that retinal waves drive oscillations in second-messenger cascades. J Neurosci 26: 12807–12815, 2006 [DOI] [PMC free article] [PubMed] [Google Scholar]
- 16.Gasbarrini A, Grigolo B, Serra M, Baldini N, Scotlandi K, Gasbarrini A, Bernardi M, Facchini A. Generation of free radicals during anoxia and reoxygenation in perfused osteoblastlike cells. Clin Orthop Relat Res: 247–252, 1997 [DOI] [PubMed] [Google Scholar]
- 17.Grammas P, Moore P, Cashman RE, Floyd RA. Anoxic injury of endothelial cells causes divergent changes in protein kinase C and protein kinase A signaling pathways. Mol Chem Neuropathol 33: 113–124, 1998 [DOI] [PubMed] [Google Scholar]
- 18.Granger DN, Korthuis RJ. Physiologic mechanisms of postischemic tissue injury. Annu Rev Physiol 57: 311–332, 1995 [DOI] [PubMed] [Google Scholar]
- 19.Guellaen G, Mahu JL, Mavier P, Berthelot P, Hanoune J. RMI 12330 A, an inhibitor of adenylate cyclase in rat liver. Biochim Biophys Acta 484: 465–475, 1977 [DOI] [PubMed] [Google Scholar]
- 20.Harada H, Becknell B, Wilm M, Mann M, Huang LJ, Taylor SS, Scott JD, Korsmeyer SJ. Phosphorylation and inactivation of BAD by mitochondria-anchored protein kinase A. Mol Cell 3: 413–422, 1999 [DOI] [PubMed] [Google Scholar]
- 21.Hatton CJ, Peers C. Hypoxic inhibition of K+ currents in isolated rat type I carotid body cells: evidence against the involvement of cyclic nucleotides. Pflügers Arch 433: 129–135, 1996 [DOI] [PubMed] [Google Scholar]
- 22.Hirao M, Hashimoto J, Yamasaki N, Ando W, Tsuboi H, Myoui A, Yoshikawa H. Oxygen tension is an important mediator of the transformation of osteoblasts to osteocytes. J Bone Miner Metab 25: 266–276, 2007 [DOI] [PubMed] [Google Scholar]
- 23.Horbinski C, Chu CT. Kinase signaling cascades in the mitochondrion: a matter of life or death. Free Radic Biol Med 38: 2–11, 2005 [DOI] [PubMed] [Google Scholar]
- 24.Humphries KM, Deal MS, Taylor SS. Enhanced dephosphorylation of cAMP-dependent protein kinase by oxidation and thiol modification. J Biol Chem 280: 2750–2758, 2005 [DOI] [PubMed] [Google Scholar]
- 25.Humphries KM, Juliano C, Taylor SS. Regulation of cAMP-dependent protein kinase activity by glutathionylation. J Biol Chem 277: 43505–43511, 2002 [DOI] [PubMed] [Google Scholar]
- 26.Humphries KM, Juliano C, Taylor SS. Regulation of cAMP-dependent protein kinase activity by glutathionylation. J Biol Chem 277: 43505–43511, 2002 [DOI] [PubMed] [Google Scholar]
- 27.Humphries KM, Pennypacker JK, Taylor SS. Redox regulation of cAMP-dependent protein kinase signaling: kinase versus phosphatase inactivation. J Biol Chem 282: 22072–22079, 2007 [DOI] [PubMed] [Google Scholar]
- 28.Jennings RB, Reimer KA. The cell biology of acute myocardial ischemia. Annu Rev Med 42: 225–246, 1991 [DOI] [PubMed] [Google Scholar]
- 29.Jewell UR, Kvietikova I, Scheid A, Bauer C, Wenger RH, Gassmann M. Induction of HIF-1α in response to hypoxia is instantaneous. FASEB J 15: 1312–1314, 2001 [PubMed] [Google Scholar]
- 30.Jones CI, Han ZS, Presley T, Varadharaj S, Zweier JL, Ilangovan G, Alevriadou BR. Endothelial cell respiration is affected by the oxygen tension during shear exposure: role of mitochondrial peroxynitrite. Am J Physiol Cell Physiol 295: C180–C191, 2008 [DOI] [PMC free article] [PubMed] [Google Scholar]
- 31.Kitagawa K. CREB and cAMP response element-mediated gene expression in the ischemic brain. FEBS J 274: 3210–3217, 2007 [DOI] [PubMed] [Google Scholar]
- 32.Kobayashi S, Beitner-Johnson D, Conforti L, Millhorn DE. Chronic hypoxia reduces adenosine A2A receptor-mediated inhibition of calcium current in rat PC12 cells via downregulation of protein kinase A. J Physiol 512: 351–363, 1998 [DOI] [PMC free article] [PubMed] [Google Scholar]
- 33.Kumar GK, Kim DK, Lee MS, Ramachandran R, Prabhakar NR. Activation of tyrosine hydroxylase by intermittent hypoxia: involvement of serine phosphorylation. J Appl Physiol 95: 536–544, 2003 [DOI] [PubMed] [Google Scholar]
- 34.Kvietikova I, Wenger RH, Marti HH, Gassmann M. The hypoxia-inducible factor-1 DNA recognition site is cAMP-responsive. Kidney Int 51: 564–566, 1997 [DOI] [PubMed] [Google Scholar]
- 35.Lahiri S, Roy A, Baby SM, Hoshi T, Semenza GL, Prabhakar NR. Oxygen sensing in the body. Prog Biophys Mol Biol 91: 249–286, 2006 [DOI] [PubMed] [Google Scholar]
- 36.Leonard SE, Reddie KG, Carroll KS. Mining the thiol proteome for sulfenic acid modifications reveals new targets for oxidation in cells. ACS Chem Biol 4: 783–799, 2009 [DOI] [PubMed] [Google Scholar]
- 37.Nanduri J, Nanduri RP. Cellular mechanisms associated with intermittent hypoxia. Essays Biochem 43: 91–104, 2007 [DOI] [PubMed] [Google Scholar]
- 38.Nikolaev VO, Lohse MJ. Monitoring of cAMP synthesis and degradation in living cells. Physiology 21: 86–92, 2006 [DOI] [PubMed] [Google Scholar]
- 39.Ohneda O, Nagano M, Fujii-Kuriyama Y. Role of hypoxia-inducible factor-2alpha in endothelial development and hematopoiesis. Methods Enzymol 435: 199–218, 2007 [DOI] [PubMed] [Google Scholar]
- 40.Perkins GA, Wang L, Huang LJ, Humphries K, Yao VJ, Martone M, Deerinck TJ, Barraclough DM, Violin JD, Smith D, Newton A, Scott JD, Taylor SS, Ellisman MH. PKA, PKC, and AKAP localization in and around the neuromuscular junction. BMC Neurosci 2: 17, 2001 [DOI] [PMC free article] [PubMed] [Google Scholar]
- 41.Prabu SK, Anandatheerthavarada HK, Raza H, Srinivasan S, Spear JF, Avadhani NG. Protein kinase A-mediated phosphorylation modulates cytochrome c oxidase function and augments hypoxia and myocardial ischemia-related injury. J Biol Chem 281: 2061–2070, 2006 [DOI] [PMC free article] [PubMed] [Google Scholar]
- 42.Reneman RS, Arts T, Hoeks AP. Wall shear stress–an important determinant of endothelial cell function and structure–in the arterial system in vivo. Discrepancies with theory. J Vasc Res 43: 251–269, 2006 [DOI] [PubMed] [Google Scholar]
- 43.Robinson-White A, Stratakis CA. Protein kinase A signaling: “cross-talk” with other pathways in endocrine cells. Ann NY Acad Sci 968: 256–270, 2002 [DOI] [PubMed] [Google Scholar]
- 44.Sastri M, Barraclough DM, Carmichael PT, Taylor SS. A-kinase-interacting protein localizes protein kinase A in the nucleus. Proc Natl Acad Sci USA 102: 349–354, 2005 [DOI] [PMC free article] [PubMed] [Google Scholar]
- 45.Seta K, Kim HW, Ferguson T, Kim R, Pathrose P, Yuan Y, Lu G, Spicer Z, Millhorn DE. Genomic and physiological analysis of oxygen sensitivity and hypoxia tolerance in PC12 cells. Ann NY Acad Sci 971: 379–388, 2002 [DOI] [PubMed] [Google Scholar]
- 46.Seta KA, Spicer Z, Yuan Y, Lu G, Millhorn DE. Responding to hypoxia: lessons from a model cell line. Sci STKE: RE11, 2002 [DOI] [PubMed] [Google Scholar]
- 47.Spicer Z, Millhorn DE. Oxygen sensing in neuroendocrine cells and other cell types: pheochromocytoma (PC12) cells as an experimental model. Endocr Pathol 14: 277–291, 2003 [DOI] [PubMed] [Google Scholar]
- 48.Tan CM, Xenoyannis S, Feldman RD. Oxidant stress enhances adenylyl cyclase activation. Circ Res 77: 710–717, 1995 [DOI] [PubMed] [Google Scholar]
- 49.Ten VS, Pinsky DJ. Endothelial response to hypoxia: physiologic adaptation and pathologic dysfunction. Curr Opin Crit Care 8: 242–250, 2002 [DOI] [PubMed] [Google Scholar]
- 50.Therade-Matharan S, Laemmel E, Duranteau J, Vicaut E. Reoxygenation after hypoxia and glucose depletion causes reactive oxygen species production by mitochondria in HUVEC. Am J Physiol Regul Integr Comp Physiol 287: R1037–R1043, 2004 [DOI] [PubMed] [Google Scholar]
- 51.Toffoli S, Feron O, Raes M, Michiels C. Intermittent hypoxia changes HIF-1alpha phosphorylation pattern in endothelial cells: unravelling of a new PKA-dependent regulation of HIF-1alpha. Biochim Biophys Acta 1773: 1558–1571, 2007 [DOI] [PubMed] [Google Scholar]
- 52.Triantafyllou A, Liakos P, Tsakalof A, Georgatsou E, Simos G, Bonanou S. Cobalt induces hypoxia-inducible factor-1alpha (HIF-1alpha) in HeLa cells by an iron-independent, but ROS-, PI-3K- and MAPK-dependent mechanism. Free Radic Res 40: 847–856, 2006 [DOI] [PubMed] [Google Scholar]
- 53.Vincent P, Gervasi N, Zhang J. Real-time monitoring of cyclic nucleotide signaling in neurons using genetically encoded FRET probes. Brain Cell Biol 36: 3–17, 2008 [DOI] [PubMed] [Google Scholar]
- 54.Violin JD, DiPilato LM, Yildirim N, Elston TC, Zhang J, Lefkowitz RJ. β2-Adrenergic receptor signaling and desensitization elucidated by quantitative modeling of real time cAMP dynamics. J Biol Chem 283: 2949–2961, 2008 [DOI] [PubMed] [Google Scholar]
- 55.Wadhwa S, Choudhary S, Voznesensky M, Epstein M, Raisz L, Pilbeam C. Fluid flow induces COX-2 expression in MC3T3-E1 osteoblasts via a PKA signaling pathway. Biochem Biophys Res Commun 297: 46–51, 2002 [DOI] [PubMed] [Google Scholar]
- 56.Wang Y, Wan C, Gilbert SR, Clemens TL. Oxygen sensing and osteogenesis. Ann NY Acad Sci 1117: 1–11, 2007 [DOI] [PubMed] [Google Scholar]
- 57.Wang ZZ, He L, Chen J, Dinger B, Stensaas L, Fidone S. Protein phosphorylation signaling mechanisms in carotid body chemoreception. Biol Signals Recept 8: 366–374, 1999 [DOI] [PubMed] [Google Scholar]
- 58.Ward JP. Oxygen sensors in context. Biochim Biophys Acta 1777: 1–14, 2008 [DOI] [PubMed] [Google Scholar]
- 59.Ward JPT. Point:Counterpoint: Hypoxic pulmonary vasoconstriction is/is not mediated by increased production of reactive oxygen species. J Appl Physiol 101: 993–995, 2006 [DOI] [PubMed] [Google Scholar]
- 60.Waypa GB, Schumacker PT. Hypoxic pulmonary vasoconstriction: redox events in oxygen sensing. J Appl Physiol 98: 404–414, 2005 [DOI] [PubMed] [Google Scholar]
- 61.Weir EK, Archer SL. Counterpoint: Hypoxic pulmonary vasoconstriction is not mediated by increased production of reactive oxygen species. J Appl Physiol 101: 995–998, 2006 [DOI] [PubMed] [Google Scholar]
- 62.Weir EK, Lopez-Barneo J, Buckler KJ, Archer SL. Acute oxygen-sensing mechanisms. N Engl J Med 353: 2042–2055, 2005 [DOI] [PMC free article] [PubMed] [Google Scholar]
- 63.Willoughby D, Cooper DMF. Live-cell imaging of cAMP dynamics. Nature Methods 5: 29–36, 2008 [DOI] [PubMed] [Google Scholar]
- 64.Yu G, Peng T, Feng Q, Tyml K. Abrupt reoxygenation of microvascular endothelial cells after hypoxia activates ERK1/2 and JNK1, leading to NADPH oxidase-dependent oxidant production. Microcirculation 14: 125–136, 2007 [DOI] [PubMed] [Google Scholar]


