Abstract
The outer zone of the renal inner medulla (IM) is spatially partitioned into two distinct interstitial compartments in the transverse dimension. In one compartment (the intercluster region), collecting ducts (CDs) are absent and vascular bundles are present. Ascending vasa recta (AVR) that lie within and ascend through the intercluster region (intercluster AVR are designated AVR2) participate with descending vasa recta (DVR) in classic countercurrent exchange. Direct evidence from former studies suggests that vasopressin binds to V1 receptors on smooth muscle-like pericytes that regulate vessel diameter and blood flow rate in DVR in this compartment. In a second transverse compartment (the intracluster region), DVR are absent and CDs and AVR are present. Many AVR of the intracluster compartment exhibit multiple branching, with formation of many short interconnecting segments (intracluster AVR are designated AVR1). AVR1 are linked together and connect intercluster DVR to AVR2 by way of sparse networks. Vasopressin V2 receptors regulate multiple fluid and solute transport pathways in CDs in the intracluster compartment. Reabsorbate from IMCDs, ascending thin limbs, and prebend segments passes into AVR1 and is conveyed either upward toward DVR and AVR2 of the intercluster region, or is retained within the intracluster region and is conveyed toward higher levels of the intracluster region. Thus variable rates of fluid reabsorption by CDs potentially lead to variable blood flow rates in either compartment. Net flow between the two transverse compartments would be dependent on the degree of structural and functional coupling between intracluster vessels and intercluster vessels. In the outermost IM, AVR1 pass directly from the IM to the outer medulla, bypassing vascular bundles, the primary blood outflow route. Therefore, two defined vascular pathways exist for fluid outflow from the IM. Compartmental partitioning of V1 and V2 receptors may underlie vasopressin-regulated functional compartmentation of IM blood flow.
Keywords: computer-assisted reconstruction, concentrating mechanism, countercurrent system, hypertension, urea transport
descending vasa recta (DVR), which arise largely from juxtamedullary nephrons, descend alongside ascending vasa recta (AVR) in outer medullary (OM) vascular bundles that run parallel to the corticopapillary axis. These bundles form the organizing motif of OM histoarchitecture (5). Ascending vessels also lie in the interbundle region of the OM and these serve as interconnecting capillaries that link DVR to AVR.
In the outer zone of the IM [the first 3–3.5 mm below the OM-inner medullary (IM) boundary] (21), clusters of collecting ducts (CDs) form the organizing motif. Ascending thin limbs of Henle's loops (ATLs) and AVR are grouped with CDs in the intracluster region. DVR, AVR, ATLs, and aquaporin-1 (AQP1)-positive descending thin limbs of Henle's loops (DTLs) are arranged outside CD clusters in the intercluster region.
We characterized IM AVR2 as those AVR that do not abut CDs and that run parallel to DVR in loosely organized vascular bundles within the intercluster region (28). AVR2 exist with DVR in this intercluster compartment in a proportion of ∼2:1, although the AVR/DVR ratio for the total population of vessels is ∼4:1. Vascular elements not accounted for by the 2:1 ratio include AVR and fenestrated interconnecting capillaries (13, 16, 24) that lie in the intracluster region (intracluster fenestrated vessels are designated AVR1) (28).
Water reabsorbed from CDs passes into AVR1 in the intracluster region. At some axial level, AVR1 connect to AVR2, which ascend along the corticopapillary axis within the intercluster region (28). Water reabsorbed from DTLs in the intercluster region also enters AVR2. En route to the OM, AVR2 participate with DVR in countercurrent exchange, a system for recycling solutes to the IM. Water is simultaneously returned to general circulation (26, 30).
Regulation of medullary blood flow by way of vasopressin V1 and V2 receptors is believed to play a key dynamic role in processes of urine concentration, sodium and water balance, and the long-term control of arterial pressure (2, 12, 16). In the antidiuretic rat, vasopressin increases water reabsorption from cortical CDs, paradoxically leading to reduced water reabsorption in papillary CDs compared with diuresis, due to reduced tubular fluid reaching IMCDs. Medullary blood flow is thus subject to variation as a result of variable water reabsorption from IMCDs (7). Vasopressin also affects contractility of pericytes, the smooth muscle-like cells that surround DVR in the OM and outer zone of the IM (16, 22), with consequent reduction in lumen diameter and decreased blood flow in DVR (29). Additional regulatory mechanisms include sympathetic innervation of juxtamedullary nephrons and OM DVR (at least as far into the OM as where smooth muscle cells are replaced by pericytes) (9), ANG II, paracrine factors, nitric oxide, and prostaglandins (3, 14).
In this study, we show evidence for compartmentation of vascular elements that correlates in a number of ways with previously reported signaling pathways that are believed to regulate blood flow via vasopressin V1 and V2 receptors. This two-compartment model resembles that of the OM where DVR and AVR lie in bundle regions and interconnecting vessels lie in the interbundle region. This architecture may bear on future investigations into the multiple regulatory pathways that control IM blood flow.
METHODS
Animals.
Young male Munich-Wistar rats (average wt, 90 g) were purchased from Harlan (Indianapolis, IN). The animals were euthanized with pentobarbital sodium (0.2 ml/100 g body wt) or with CO2. All experiments were conducted in accordance with The Guide for the Care and Use of Laboratory Animals (Washington, DC: National Academy Press, 1996) and approved by the Institutional Animal Care and Use Committee.
Tissue preparation and immunohistochemistry.
Kidneys were prepared and immunohistochemistry was carried out as described previously (18, 19). Serial, transverse sections 1 μm thick and no greater than 5 μm apart were prepared for each kidney. Tissue sections were labeled as recently described (28) using the following primary antibodies: urea transporter B (UT-B) to label DVR, PV-1 to label fenestrated DVR and AVR, ClC-K to label ascending limbs, and AQP2 to label CDs. Sections were viewed with epifluorescence microscopy.
Image analysis.
Separate stacks of digitized, serial images were generated by capturing immunofluorescence from each tissue section. Partial three-dimensional reconstructions were created for some, but not all tissue. Quantitative analyses were carried out on two-dimensional images using PhotoShop (Adobe) and the Image Processing Toolkit (Reindeer Graphics).The volume shrinkage factor for ethanol dehydration of rat medullary tissue has been reported to be ∼20% (1), and the linear shrinkage factor has been reported to be ∼20–25% (4). Thus the linear distances that we report would underestimate the distances measured for fresh tissue by a maximum of ∼20–25%.
Statistical analyses.
Data combined from three or more samples are reported as means ± SE (n = number of replicates). The statistical significance of differences between means for each category of two data sets was determined with a two-sample t-test (P < 0.05), and the significance of differences between means for multiple data sets was determined with ANOVA and Duncan's post hoc test (P < 0.05). Transverse sections shown are representative of three or more kidneys.
RESULTS
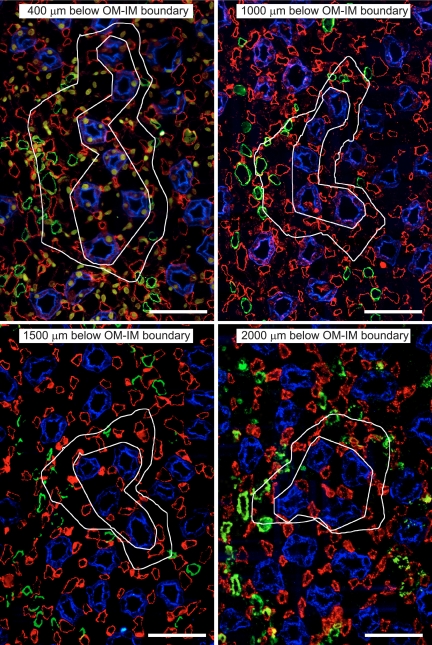
Clusters of CDs that coalesce as they descend the corticopapillary axis form the organizing motif in the outer zone of the IM (the first 3–3.5 mm of the IM). A transverse section depicting two sets of five primary CD clusters, each set forming a larger secondary cluster that terminates in a single CD near the tip of the papilla, is shown in Fig. 2A of Yuan and Pannabecker (28). In this image, two interstitial regions can be clearly defined in the transverse dimension; the intracluster and intercluster regions (20). Euclidean distance map (EDM) borders (28) outline the perimeter of each primary cluster in a quantitative fashion. The intracluster region of each primary cluster is defined by an irregular polygon that connects the perimeters of all CDs. An example of the intracluster and intercluster regions for one primary cluster is shown in Fig. 1. The intercluster region lies between the EDM border and the polygon that defines the intracluster region. In the outer zone of the IM, classic countercurrent exchange between DVR and AVR2 occurs primarily in the intercluster region at the outer perimeter of the secondary cluster (28).
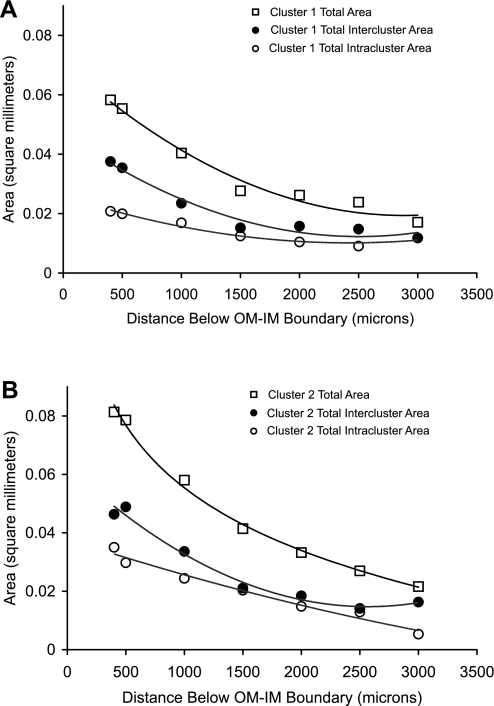
Fig. 2.
Cross-sectional areas of secondary clusters 1 (A) and 2 (B) at progressively deeper levels below the OM-IM boundary. Total area (□), intercluster area (●), and intracluster area (○).
Fig. 1.
Transverse sections showing one single primary collecting duct (CD) cluster (from Fig. 2A in Ref. 28) from four progressively deeper levels below the outer medullary (OM)-inner medullary (IM) boundary [CDs, aquaporin-2 (AQP2)/blue; descending vasa recta (DVR), urea transporter B (UT-B)/green; ascending vasa recta AVR1 and AVR2, PV-1/red]. The inner white irregular polygon of each image outlines the approximate intracluster region. The outer white boundary of each image is the intercluster Euclidean distance map (EDM) border; the EDM border delimits the intercluster region. Scale bars = 50 μm.
A key architectural feature of the intracluster region is the interstitial nodal space (INS). These arrays of interstitial microdomains are created from two adjacent, fenestrated capillaries that abut a CD (AVR1), with one or two ATLs or prebend segments opposite the CD (18). Accordingly, NaCl, urea, and water reabsorbed from prebend segments, ATLs, and CDs (17) flow directly into the INSs, which may function as solute-mixing chambers in support of a “solute-separation, solute-mixing” mechanism in urine concentration (10). AVR1 interact repeatedly with INSs as the vessels ascend the corticopapillary axis, and interact infrequently with DVR. The converse is true for AVR2. Structural studies described below support the view that AVR1 play a principal role in an intracluster countercurrent exchange system whereas AVR2 play a principal role in an intercluster countercurrent exchange system (20).
Cross-sectional area of intracluster and intercluster regions of two secondary CD clusters in the outer zone of the IM.
The total cross-sectional area of two reconstructed secondary CD clusters (as shown in Fig. 2A in Ref. 28) was determined at intervals along the corticopapillary axis between 400 μm and 3,000 μm below the OM-IM boundary (Fig. 2). The cross-sectional area of the intracluster regions was also determined, and this area was subtracted from the total area to obtain the intercluster area. The intracluster region accounts for roughly 35–40% of total cross-sectional area for both secondary CD clusters 1 and 2 at 500 μm below the OM-IM boundary. The fractional contribution of the intracluster region to the total area rises slightly at deeper levels. At levels 3,000 μm or more below the OM-IM boundary, each primary cluster consists of a single CD and the intracluster area equals the CD cross-sectional area. Thus the intracluster interstitial area becomes nil; however, INSs continue to exist as long as a single CD is present (19).
AVR1/CD ratios in the outer zone of the IM.
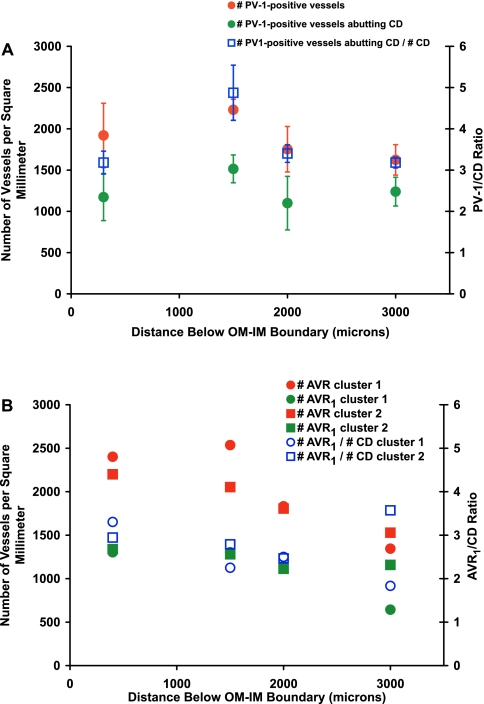
We determined the number density of PV-1-positive vessels that abut CDs in random transverse sections from three kidneys at various distances below the OM-IM boundary (Fig. 3A). The PV-1/CD ratio for these kidneys is ∼4:1 for the interval between 400 and 3,000 μm below the OM-IM boundary (Fig. 3A). These ratios are comparable to previously published values (18) and reflect the number of AVR1 that abut each CD. A reasonable confirmation of AVR1/CD ratios determined for random sections from multiple kidneys was achieved by analyzing vessels in two secondary CD clusters of a single kidney that have been reconstructed through the first 3,200 μm below the OM-IM boundary. These reconstructions make clear distinctions between AVR1 and AVR2 (28). Values comparable to those of random transverse sections were seen for AVR1/CD ratios for the reconstructed vessels and nephrons of secondary CD clusters 1 and 2 (Fig. 3B).
Fig. 3.
Number densities of IM blood vessels and vessel/CD ratios. A: number of PV-1-positive vessels, number of PV-1-positive vessels abutting CDs, and ratio of number of PV-1-positive vessels abutting CD/number of CDs for random cross-sectional areas of the IM from 3 kidneys. Values are means ± SE. Ratio means are not significantly different along the corticopapillary axis (ANOVA with Duncan's post hoc test; P < 0.05). B: vessel number densities and AVR1/CD ratios for CD clusters 1 and 2. Contrast with AVR2 of the same tissue in Fig. 4 in Ref. 28.
Spatial features of AVR1 and capillary networks in the intracluster region.
Two fenestrated capillary networks that reside within the two secondary CD cluster EDM boundaries in the transverse section lying 400 μm below the OM-IM boundary (as shown in Fig. 2A in Ref. 28), were reconstructed from this level to a depth of 3,200 μm below the OM-IM boundary. Nearly all capillaries that lie within the intracluster region express PV-1 and thus are fenestrated, whereas none express UT-B. Fenestrated vessels that lie within the intracluster region abut CDs repeatedly throughout most of their lengths (Fig. 1) (18). This is a key feature of intracluster AVR1, a feature that differs for AVR2 of the intercluster region which infrequently abut CDs (28).
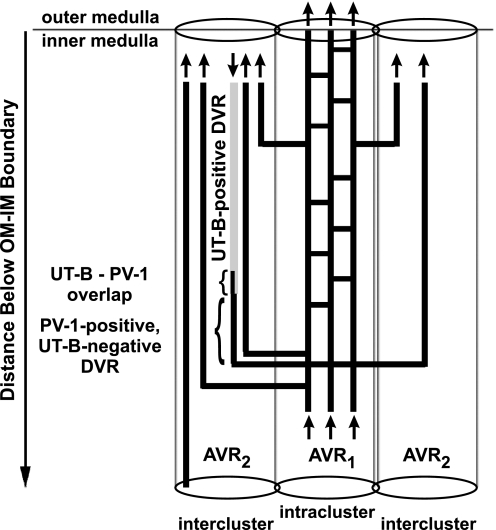
Fenestrated interconnecting capillaries arise from PV-1-positive, UT-B-negative DVR that lie within the intercluster region (summarized in Fig. 4) (28). Fenestrated DVR enter the intracluster region and are continuous with AVR1, which undergo various degrees of dividing and coalescing to form a capillary network that extends axially within the borders of the intracluster region of CD clusters. At various axial levels, these capillaries drain into AVR2 that ascend unbranched toward the OM. Each network includes the majority of AVR1 that exist within each CD cluster, and each network connects to multiple DVR and AVR2 that lie in the intercluster region.
Fig. 4.
Diagram of vasa recta architecture in the outer zone of the IM. The UT-B-positive (light shading, nonfenestrated) DVR descends along the corticopapillary axis. The UT-B-positive segment overlaps (small bracket) with PV-1 (dark shading, fenestrated) and is continuous with a descending PV-1-positive, UT-B-negative DVR (large bracket) (28). This PV-1-positive segment is continuous with AVR1, which lie within the CD cluster (intracluster region). AVR1 connect to AVR2 in vascular bundles of the intercluster region. A number of AVR1 also ascend directly from the outermost IM into the innermost inner stripe of the OM. Arrows denote blood flow direction. AVR1, PV-1-positive intracluster AVR and interconnecting capillaries that do abut CDs; AVR2, ascending, PV-1-positive intercluster vessels that do not abut CDs, and do or do not abut DVR.
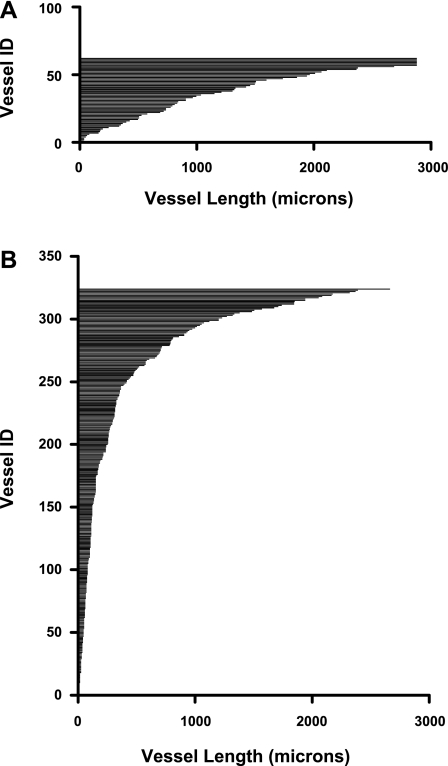
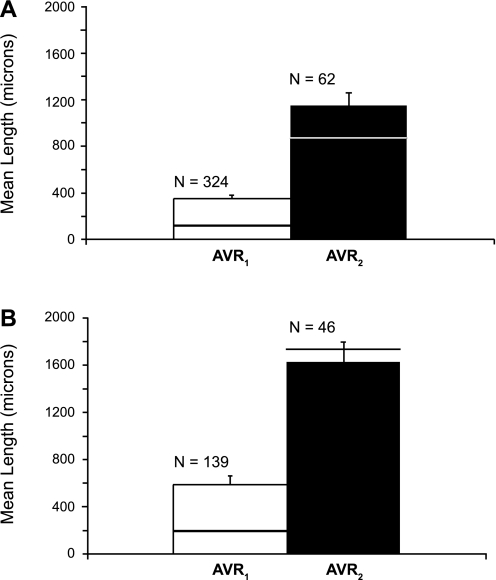
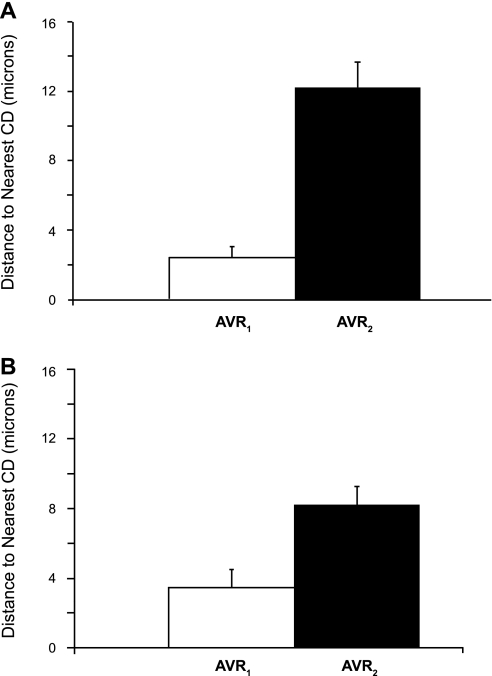
A length histogram of the 324 AVR1 that make up one of these networks is compared with a length histogram of the 62 AVR2 that exist within this secondary cluster. (Fig. 5). The mean lengths of AVR1 that constitute each of the two networks are markedly shorter than the mean lengths of AVR2 in each cluster (Fig. 6). We also determined the mean distances to the nearest CD for a random sample of AVR1 and AVR2 for each of the two networks throughout their entire ascents (at 5-μm intervals) along the corticopapillary axis. The mean distance to the nearest CD for AVR1 is significantly less than the mean distance to the nearest CD for AVR2 (Fig. 7).
Fig. 5.
Length histograms of fenestrated vessels in CD cluster 1 (as shown in Fig. 2A in Ref. 28). A: axial lengths of 62 AVR2 (intercluster AVR). B: axial lengths of 324 AVR1 that form an intracluster network.
Fig. 6.
Lengths of AVR1 and AVR2 in secondary CD clusters 1 (A) and 2 (B) (as shown in Fig. 2A in Ref. 28). Values are means + SE. Horizontal lines show median lengths of vessels for each category. Lengths of AVR1 are significantly shorter than AVR2. P < 0.05, Student's 2-sample t-test.
Fig. 7.
Mean distances to nearest CD for AVR1 and AVR2 in secondary CD clusters 1 (A) and 2 (B) (as shown in Fig. 2A in Ref. 28). Distances (means + SE, n = 10) were averaged for the entire ascent of a random selection of vessels from each cluster. Distances of AVR1 to nearest CD are significantly shorter than distances of AVR2 to nearest CD. P < 0.05, Student's 2-sample t-test.
Two defined vascular pathways for fluid outflow from the IM.
It is generally thought that all fenestrated vessels leave the IM by way of vascular bundles (16). Contrary to this notion, we found that a number of AVR1 ascend directly from the outermost IM into the innermost inner stripe of the OM. These vessels do not pass into the OM by way of vascular bundles, but pass directly from intracluster IM into the interbundle region of the OM. A typical section demonstrating this arrangement is shown in Fig. 8. In the IM these AVR1 abut CDs almost continuously, remaining components of INSs up to the level of the OM-IM boundary.
Fig. 8.
AVR1 ascending directly from the outermost IM into the innermost inner stripe of the OM [CDs, AQP2/blue; ascending thin limbs of Henle's loop (ATLs) in the IM and thick ascending limbs in the OM, ClC-K/green; DVR, UT-B/yellow; AVR1 and AVR2, PV-1/red]. In B autofluorescence in thick ascending limbs appears as light blue-gray. A: thick ascending limbs (OM) and ATLs (IM). B: fenestrated vessels at the OM-IM boundary (AVR). C and D: enlarged boxed areas. E: plane of tissue section through the OM-IM boundary. Scale bars = 40 μm.
DISCUSSION
Whereas vascular bundles dominate the histoarchitecture of the OM, CD clusters dominate the histoarchitecture of the outer zone of the IM. Nonetheless, in the outer zone of the IM vascular bundles exist as distinct entities consisting of a number of DVR intermixed with a somewhat larger number of AVR (AVR2) (28). These vasa recta are the primary conduits for blood flow into and out of the IM and engage in countercurrent exchange of fluid and solutes. The present studies add to our understanding of interconnecting capillary networks that link DVR and AVR2 (summarized in Fig. 4). These interconnecting capillaries reside in a defined interstitial compartment that clearly is spatially partitioned from the compartment containing countercurrent exchanging DVR and AVR2. The degree of functional partitioning between these two compartments remains to be determined; however, the near spatial isolation of blood flow pathways into and out of the IM from the fluid and solute flows into the IM by way of IMCD reabsorption suggests that regulation of blood flow may have a significant impact on fluid and solute compartmentation in the axial and transverse dimensions.
Smooth muscle pericytes that surround endothelial cells of DVR in the OM and IM are thought to regulate blood flow via vasoconstriction, and vasopressin is believed to regulate blood flow by way of direct effects on pericytes via V1 receptors (29). Thus vasopressin V1 receptor binding leads to a selective decrease in blood flow by acting directly on vessels in the intercluster region. Vasopressin V2 receptors are known to regulate fluid reabsorption by cortical and medullary CDs (23, 25) by altering AQP2 trafficking to the apical membrane and by altering AQP2 expression (15). Since in the antidiuretic kidney a higher proportion of total water reabsorption occurs from cortical CDs, vasopressin reduces fluid flow into the IM and consequently fluid reabsorption from IMCDs is reduced. Thus vasopressin also may indirectly elicit a change in blood flow through capillaries in the intracluster region, by way of hydrosmotic effects mediated by the V2 receptor (7). Owing to their architecture, intracluster AVR1 offer the most direct initial pathway for returning to general circulation the fluid reabsorbed from IMCDs. The influence of vasopressin on overall IM blood circulation mediated through dual effects, that is, direct vasoactive effects on DVR and indirect hydrosmotic effects on AVR1, will depend on the degree of coupling between the AVR1 and the intercluster DVR and AVR2. A more complete analysis of capillary networks along the entire IM is thus essential for better understanding vasopressin-regulated blood flow.
A recent mathematical model of the IM urine concentrating mechanism has proposed that NaCl and urea are sequestered within the intracluster region, possibly in INSs (11). Although this model remains to be confirmed experimentally, we have previously established that significant sites for NaCl and urea reabsorption from CDs, prebend segments, and ATLs are prominently positioned within the intracluster region (17, 21). An interstitial reabsorbate in the INSs, rich in NaCl and urea, could potentially be channeled by way of capillaries to INSs at higher axial levels (20), further driving fluid reabsorption from IMCDs. The degree to which bulk flow of fluid and solutes is either retained within the intracluster region or is distributed into the intercluster region again will depend on the degree of coupling between the AVR1 and the intercluster DVR and AVR2.
It is generally considered that all fenestrated vessels enter vascular bundles before leaving the IM (16). However, in their landmark studies, Moffat and Fourman (13) showed examples of IM capillaries lying away from vascular bundles that appear to ascend directly from the outer zone of the IM into the inner stripe of the OM (Fig. 6 in their Plate 2). In preliminary studies, we have found that AVR1 passing from the IM into the interbundle region of the OM (Fig. 8) do seem to become dispersed in a significant way beyond a few hundred micrometers above the OM-IM boundary (unpublished observations). These capillaries thus appear to exist within a narrow band that spans the OM-IM boundary; however, a more detailed analysis of these vessels is required to determine the extent of their ascent and the pathways they take.
These AVR1 that pass directly into the inner stripe interbundle region are elements of INSs in the IM. As noted above, urea may be sequestered within the intracluster region, possibly within these INSs (11), suggesting that capillaries rising into interbundle regions of the OM may carry significant amounts of urea into the interbundle region. Long DTLs, thick ascending limbs, and CDs lie in the OM interbundle region. The urea transporter UT-A2 is expressed in OM and IM long DTLs (8), and expression increases above normal levels in DTLs of the very outermost IM in the vasopressin-treated rat (27) and in the potassium-depleted mouse (6). Given that apparent concentration gradients would support urea secretion into long DTLs of the rat OM (11), we suggest that long DTLs possibly serve as countercurrent exchangers with these interbundle capillaries. Targeted delivery of urea to OM DTLs, via AVR that originate as AVR1 in the IM may represent a significant urea recycling pathway.
In summary, vasopressin regulates IM blood flow directly by acting on pericytes associated with DVR and perhaps indirectly through an influence on CD-to-capillary fluid flow dynamics. Compartmentation of DVR and AVR2 primarily within the intercluster region and compartmentation of AVR1 within the intracluster region may provide a structural basis for the existence of multiple, spatially distinct blood flow-regulatory mechanisms. Attempts to quantify the degrees of separation and coupling between these two compartments will require quantifying vessel fluid and solute permeabilities and the solute gradients that exist across the endothelium; these gradients likely vary between compartments (11). Although we have singled out the hormone vasopressin, one overall challenge is to consider how a two-compartment model of vasculature throughout the entire medulla has an impact on multiple effects for each of the wide host of factors believed to regulate medullary blood flow.
GRANTS
This study was supported in part by U. S. National Institutes of Health Research Grant DK16294.
DISCLOSURES
No conflicts of interest, financial or otherwise, are declared by the author(s).
ACKNOWLEDGMENTS
Insightful discussions about the dynamic urinary concentrating mechanism with long-time colleagues Harold and Anita Layton, and Bill Dantzler are gratefully acknowledged. We thank Radu Stan of Dartmouth College, and Drs. Jeff Sands and Janet Klein of Emory University for providing antibodies. Zeyad Sadideen contributed to image analysis as part of his undergraduate degree requirements at the University of Arizona.
REFERENCES
- 1.Bankir L, Fischer C, Fischer S, Jukkala K, Specht HC, Kriz W. Adaptation of the rat kidney to altered water intake and urine concentration. Pflügers Arch 412: 42–53, 1988 [DOI] [PubMed] [Google Scholar]
- 2.Cowley AW., Jr Role of the renal medulla in volume and arterial pressure regulation. Am J Physiol Regul Integr Comp Physiol 273: R1–R15, 1997 [DOI] [PubMed] [Google Scholar]
- 3.Cowley AW., Jr Control of the renal medullary circulation by vasopressin V1 and V2 receptors in the rat. Exp Physiol 85S: 223S–231S2000 [DOI] [PubMed] [Google Scholar]
- 4.Han JS, Thompson KA, Chou CL, Knepper MA. Experimental tests of three-dimensional model of urinary concentrating mechanism. J Am Soc Nephrol 2: 1677–1688, 1992 [DOI] [PubMed] [Google Scholar]
- 5.Jamison RL, Kriz W. Urinary Concentrating Mechanism New York: Oxford University Press, 1982 [Google Scholar]
- 6.Jung JY, Madsen KM, Han KH, Yang CW, Knepper MA, Sands JM, Kim J. Expression of urea transporters in potassium-depleted mouse kidney. Am J Physiol Renal Physiol 285: F1210–F1224, 2003 [DOI] [PubMed] [Google Scholar]
- 7.Kiberd BA, Robertson CR, Larson T, Jamison RL. Effect of V2-receptor-mediated changes on inner medullary blood flow induced by AVP. Am J Physiol Renal Fluid Electrolyte Physiol 253: F576–F581, 1987 [DOI] [PubMed] [Google Scholar]
- 8.Kim YH, Kim DU, Han KH, Jung JY, Sands JM, Knepper MA, Madsen KM, Kim J. Expression of urea transporters in the developing rat kidney. Am J Physiol Renal Physiol 282: F530–F540, 2002 [DOI] [PubMed] [Google Scholar]
- 9.Kriz W. Structural organization of the renal medulla: comparative and functional aspects. Am J Physiol Regul Integr Comp Physiol 241: R3–R16, 1981 [DOI] [PubMed] [Google Scholar]
- 10.Layton AT, Pannabecker TL, Dantzler WH, Layton HE. Two modes for concentrating urine in rat inner medulla. Am J Physiol Renal Physiol 287: F816–F839, 2004 [DOI] [PubMed] [Google Scholar]
- 11.Layton AT, Pannabecker TL, Dantzler WH, Layton HE. Functional implications of the three-dimensional architecture of the rat renal inner medulla. Am J Physiol Renal Physiol 298: F973–F987, 2010 [DOI] [PMC free article] [PubMed] [Google Scholar]
- 12.Mattson DL, Lu S, Roman RJ, Cowley AW., Jr Relationship between renal perfusion pressure and blood flow in different regions of the kidney. Am J Physiol Regul Integr Comp Physiol 264: R578–R583, 1993 [DOI] [PubMed] [Google Scholar]
- 13.Moffat DB, Fourman J. The vascular pattern of the rat kidney. J Anat 97: 543–553, 1963 [PMC free article] [PubMed] [Google Scholar]
- 14.Navar LG, Inscho EW, Majid DSA, Imig JD, Harrison-Bernard LM, Mitchell KD. Paracrine regulation of the renal microcirculation. Physiol Rev 76: 425–536, 1996 [DOI] [PubMed] [Google Scholar]
- 15.Nielsen S, Frokiaer J, Marples D, Kwon TH, Agre P, Knepper MA. Aquaporins in the kidney: from molecules to medicine. Physiol Rev 82: 205–244, 2002 [DOI] [PubMed] [Google Scholar]
- 16.Pallone TL, Turner MR, Edwards A, Jamison RL. Countercurrent exchange in the renal medulla. Am J Physiol Regul Integr Comp Physiol 284: R1153–R1175, 2003 [DOI] [PubMed] [Google Scholar]
- 17.Pannabecker TL. Loop of Henle interaction with interstitial nodal spaces in the renal inner medulla. Am J Physiol Renal Physiol 295: F1744–F1751, 2008 [DOI] [PMC free article] [PubMed] [Google Scholar]
- 18.Pannabecker TL, Dantzler WH. Three-dimensional architecture of inner medullary vasa recta. Am J Physiol Renal Physiol 290: F1355–F1366, 2006 [DOI] [PubMed] [Google Scholar]
- 19.Pannabecker TL, Dantzler WH. Three-dimensional architecture of collecting ducts, loops of Henle, and blood vessels in the renal papilla. Am J Physiol Renal Physiol 293: F696–F704, 2007 [DOI] [PubMed] [Google Scholar]
- 20.Pannabecker TL, Dantzler WH, Layton HE, Layton AT. Role of three-dimensional architecture in the urine concentrating mechanism of the rat renal inner medulla. Am J Physiol Renal Physiol 295: F1271–F1285, 2008 [DOI] [PMC free article] [PubMed] [Google Scholar]
- 21.Pannabecker TL, Henderson C, Dantzler WH. Quantitative analysis of functional reconstructions reveals lateral and axial zonation in the renal inner medulla. Am J Physiol Renal Physiol 294: F1306–F1314, 2008 [DOI] [PubMed] [Google Scholar]
- 22.Park F, Mattson DL, Roberts LA, Cowley AW., Jr Evidence for the presence of smooth muscle α-actin within pericytes of the renal medulla. Am J Physiol Regul Integr Comp Physiol 273: R1742–R1748, 1997 [DOI] [PubMed] [Google Scholar]
- 23.Rocha AS, Kokko JP. Permeability of medullary nephron segments to urea and water: effect of vasopressin. Kidney Int 6: 379–387, 1974 [DOI] [PubMed] [Google Scholar]
- 24.Rollhauser H, Kriz W, Heinke W. Das gefass-system der rattenniere. Z Zellforsch 64: 381–403, 1964 [PubMed] [Google Scholar]
- 25.Sands JM, Nonoguchi H, Knepper MA. Vasopressin effects on urea and H2O transport in inner medullary collecting duct subsegments. Am J Physiol Renal Fluid Electrolyte Physiol 253: F823–F832, 1987 [DOI] [PubMed] [Google Scholar]
- 26.Sanjana VM, Johnston PA, Robertson CR, Jamison RL. An examination of transcapillary water flux in renal inner medulla. Am J Physiol 231: 313–318, 1976 [DOI] [PubMed] [Google Scholar]
- 27.Wade JB, Lee AJ, Liu C, Ecelbarger C, Mitchell C, Bradford AD, Terris J, Kim GH, Knepper MA. UT-A2: a 55-kDa urea transporter in thin descending limb whose abundance is regulated by vasopressin. Am J Physiol Renal Physiol 278: F52–F62, 2000 [DOI] [PubMed] [Google Scholar]
- 28.Yuan J, Pannabecker TL. Architecture of inner medullary descending and ascending vasa recta: pathways for countercurrent exchange. Am J Physiol Renal Physiol (doi:10.1152/ajprenal.00072.2010). In press [DOI] [PMC free article] [PubMed] [Google Scholar]
- 29.Zimmerhackl B, Roberston CR, Jamison RL. Effect of arginine vasopressin on renal medullary blood flow. A videomicroscopic study in the rat. J Clin Invest 76: 770–778, 1985 [DOI] [PMC free article] [PubMed] [Google Scholar]
- 30.Zimmerhackl BL, Robertson CR, Jamison RL. The medullary microcirculation. Kidney Int 31: 641–647, 1987 [DOI] [PubMed] [Google Scholar]


