Abstract
We have previously reported that Dot1a is located in the cytoplasm and nucleus (Reisenauer MR, Anderson M, Huang L, Zhang Z, Zhou Q, Kone BC, Morris AP, Lesage GD, Dryer SE, Zhang W. J Biol Chem 284: 35659–35669, 2009), widely expressed in the kidney as detected by its histone H3K79 methyltransferase activity (Zhang W, Hayashizaki Y, Kone BC. Biochem J 377: 641–651, 2004), and involved in transcriptional control of the epithelial Na+ channel subunit-α gene (αENaC) (Zhang W, Xia X, Jalal DI, Kuncewicz T, Xu W, Lesage GD, Kone BC. Am J Physiol Cell Physiol 290: C936–C946, 2006). Aldosterone releases repression of αENaC by reducing expression of Dot1a and its partner AF9 (Zhang W, Xia X, Reisenauer MR, Hemenway CS, Kone BC. J Biol Chem 281: 18059–18068, 2006) and by impairing Dot1a-AF9 interaction via Sgk1-mediated AF9 phosphorylation (Zhang W, Xia X, Reisenauer MR, Rieg T, Lang F, Kuhl D, Vallon V, Kone BC. J Clin Invest 117: 773–783, 2007). This network also appears to regulate transcription of several other aldosterone target genes. Here, we provide evidence showing that Dot1a contains at least three potential nuclear localization signals (NLSs). Deletion of these NLSs causes green fluorescent protein-fused Dot1a fusions to localize almost exclusively in the cytoplasm of 293T cells as revealed by confocal microscopy. Deletion of NLSs abolished Dot1a-mediated repression of αENaC-promoter luciferase construct in M1 cells. AF9 is widely expressed in mouse kidney. Similar to αENaC, the mRNA levels of βENaC, γENaC, and Sgk1 are also downregulated by Dot1a and AF9 overexpression. Small interference RNA-mediated knockdown of Dot1a and AF9 or aldosterone treatment leads to an opposite effect. Using single-cell fluorescence imaging or equivalent short-circuit current in IMCD3 and M1 cells, we show that observed transcriptional alterations correspond to changes in ENaC and Sgk1 protein levels as well as benzamil-sensitive Na+ transport. In brief, Dot1a and AF9 downregulate Na+ transport, most likely by regulating ENaC mRNA and subsequent protein expression and ENaC activity.
Keywords: aldosterone, sodium-binding benzofuran isophthalate acetoxymethyl ester, intracellular Na+ concentration, equivalent short-circuit current
the urinary excretion of Na+ by the kidney needs to balance the daily Na+ intake. The distal nephron in the kidney serves as the site of fine regulation for Na+ absorption from the urine via the epithelial Na+ channel (ENaC). ENaC consists of three partially homologous subunits (α, β, and γ) and is subject to tight and complex regulation by aldosterone at both transcriptional and posttranscriptional levels. Numerous studies have been conducted to define the mechanisms controlling ENaC trafficking, cell surface expression, maturation, assembly, open probability, and degradation (5, 15, 21, 37, 38). In comparison, our understanding of the mechanisms governing ENaC transcription, especially in the context of chromatin, as well as the significance of ENaC transcriptional control in ENaC-mediated Na+ transport, is rudimentary.
Traditional models of aldosterone action on target genes, including αENaC, have emphasized the translocation of the ligand-bound mineralocorticoid receptor (MR) or glucocorticoid receptor (GR) from the cytoplasm into the nucleus and the subsequent interaction of the ligand-receptor complex with hormone response elements present in the 5′-flanking regions of target genes (42). Although many aldosterone-regulated genes have been identified in different systems including the renal collecting duct (20, 35, 40) and in IMCD3 cells (13), few aldosterone-regulated genes have been identified to have a known function in histone modifications or chromatin remodeling (48). Therefore, how aldosterone induces chromatin alteration and thus leads to gene activation or repression has been obscure.
Our previous studies in IMCD3 cells and kidneys isolated from Sgk1 WT and mutant mice suggest that αENaC transcription may be impeded by a repressor complex harboring a disruptor of telomeric-silencing alternative splice variant a (Dot1a) (48) and ALL-1 fused gene from chromosome 9 (AF9) (49). This complex associates with the αENaC gene promoter and is a substrate for Sgk1 (50). AF9 phosphorylation at Ser435 by Sgk1 allows Dot1a to dissociate from the promoter, leading to a reduction of histone H3K79 methylation at the promoter and relief of repression (50). In this regard, aldosterone-mediated transcriptional activation of αENaC can be partially attributed to induction of Sgk1 and downregulation of Dot1a and AF9 mRNA expression (48–50).
Recently, we found that the ALL-1 partner at 17q21 (AF17) competes with AF9 to bind the same domain of Dot1a and promotes Dot1a nuclear export in 293 cells. Cytoplasmic localization of Dot1 results in derepression of αENaC together with several other aldosterone target genes and enhancement of ENaC-mediated Na+ transport (33). While these studies imply the importance of Dot1a cellular distribution in regulating its methyltransferase activity, Dot1a-AF9 complex-mediated transcriptional control of ENaC genes, and ENaC-mediated Na+ transport, the data interpretation is complicated by multiple NLSs existing in Dot1a. The expression and cellular distribution of AF9 in kidney, and the downregulation of ENaC proteins by Dot1a and AF9, remain to be defined.
In this study, we first identified and characterized the potential NLSs regulating Dot1a nuclear expression in 293T cells, determined the functional significance of the NLSs in Dot1a-mediated repression in M1 cells, and examined the expression and cellular distribution of AF9 in mouse kidney. We then investigated more directly and strictly the role of Dot1a, AF9, and aldosterone in regulating expression of αENaC, βENaC, γENaC, Sgk1, and MR at mRNA and protein levels. We also measured ENaC activity by benzamil-sensitive Na+ transport using IMCD3 and M1 cells. We found that Dot1a harbors three potential NLSs, with NLS1 and NLS2 being more important. A Dot1a mutant harboring deletions of all three NLSs was almost exclusively cytoplasmic and failed to inhibit αENaC promoter activity. We also found that endogenous AF9 protein is widely expressed in mouse kidney and primarily located in the nuclei of the cells, consistent with its putative role as a transcription factor. Aldosterone increases and Dot1a and AF9 decrease expression of ENaC and Sgk1 at mRNA and protein levels. The changes in the expression of these genes are associated with changes in ENaC-mediated Na+ transport as examined by two different approaches.
MATERIALS AND METHODS
Reagents.
Benzamil, nigericin, monensin, and sodium-binding benzofuran isophthalate-acetoxymethyl ester (SBFI-AM) were purchased from Sigma (St. Louis, MO). Rabbit antibodies recognizing AF9, Sgk1, and MR were obtained from Bethyl Laboratory (Montgomery, TX), Millipore (Billerica, MA), and Santa Cruz Biotechnology (Santa Cruz, CA), respectively. Antibodies against α-, β-, or γENaC were kindly provided by Dr. Ryoichi Teruyama (Univ. of Tennessee Health Science Center, Memphis, TN), who purified these antibodies originally generated by Dr. Mark Knepper's group (National Heart, Lung, and Blood Institute, Bethesda, MD). The anti-aquaporin-2 (AQP2) antibody generated in chicken is a kind gift from Dr. James Wade (Univ. of Maryland, College Park, MD). The plasmids expressing untagged, green, or red fluorescence protein (GFP- or RFP)-tagged Dot1a and AF9 (pcDNA-Dot1a, pcDNA-AF9, pGFP-Dot1a, pGFP-Dot1a 2–478, pGFP-Dot1a 479–659, pRFP-Dot1a, and pRFP-AF9), RNAi constructs (pDot1aRNAi2 and pAF9RNAi2) for knockdown of Dot1a and AF9, and IMCD3 cells stably carrying these RNAi constructs have been described (33, 48–50). The full-length Dot1a coding region in pGFP-Dot1a was released by EcoRI-KpnI digestion and replaced by PCR fragments encoding Dot1a 479–972 or 417–1540. Internal deletions of NLSs were achieved by overlapping PCR. Briefly, a 1.7-kb fragment harboring internal deletion of amino acids 394–416 (NLS1) was cloned into pGFP-Dot1a at SalI-FseI to generate pGFP-Dot1a ΔNLS1 (ΔNLS1). pGFP-Dot1a ΔNLS3 (ΔNLS3) was constructed by replacing a 2.4-kb FseI-KpnI fragment of pGFP-Dot1a with the corresponding PCR fragment missing amino acids 1165–1172 (NLS3). This ΔNLS3 FseI-KpnI fragment was then used to substitute the corresponding sequence in pGFP-Dot1a ΔNLS1, generating double deletion mutant pGFP-Dot1a ΔNLS1, 3. Deletion of amino acids 1089–1112 (NLS2) was then finally introduced into the double mutant to create a triple mutant pGFP-Dot1a ΔNLS1, 2, 3. All inserts were verified by sequencing.
Cell culture and transient and stable transfection.
293T, IMCD3, and M1 cells were maintained with DMEM/F12 plus 10% FBS. For aldosterone studies, cells were cultured in DMEM/F12 plus 10% charcoal-stripped FBS for at least 50 h before addition of 1 μM aldosterone or 0.01% ethanol as a vehicle control for 4, 19, or 24 h. In some experiments, cells were pretreated with either actinomycin D (5 μg/ml) or cycloheximide (10 μg/ml) for 1 h, followed by aldosterone administration for 24 h. Transient transfection was carried out with Lipofectamine 2000 reagent (Invitrogen). To establish stable cell lines, IMCD3 or M1 cells were transfected with pcDNA3.1 vector as a negative control or its derivatives expressing Dot1a or AF9. Transfected cells were selected by neomycin (500 μg/ml) for 2 wk. Parent cells were treated with neomycin, similarly in parallel to determine selection efficiency. All neomycin-resistant colonies were pooled and expanded without clonal selection on the basis of Dot1a or AF9 mRNA expression. Cells were cultured on plates for real-time RT-quantitative (q) PCR, on coverslips for measurement of intracellular Na+ concentration ([Na+]i), or on Millicell inserts for real-time RT-qPCR and equivalent short circuit current (Isc) experiments.
[Na+]i measurement.
Na+ indicator SBFI-AM was used for single-cell fluorescence imaging to determine [Na+]i, as reported by others (6, 43, 44). Briefly, cells were plated onto collagen-coated glass coverslips with an appropriate medium described above for 18 h to reach ∼60% confluence. Coverslips were then mounted to experimental chambers. After incubation with 10 μM SBFI-AM plus 0.1% Pluronic F-127 in Na-HEPES physiological saline (140 mM NaCl, 4.7 mM KCl, 1.13 mM MgCl2, 10 mM HEPES, 10 mM glucose, and 1 mM CaCl2) for 2–4 h at room temperature, cells were continuously superperfused with fresh (dye-free) Na-HEPES containing 1 mM Ca2+ with or without benzamil (1 μM) at 37°C until the fluorescence recordings stabilized, ∼5–10 min. Light emitted from SBFI-AM-loaded cells at >510 nm was captured by a camera-based digital imaging system. Cellular SBFI fluorescence was captured following illumination at two excitation wavelengths (340 ± 15 and 380 ± 15 nm) by a Cascade digital camera coupled to a Nikon TE2000-U microscope. The fluorescence output of individual cells was recorded by placing measurement windows over cells within the ×40 objective field and emission ratio measurements performed offline on saved images using Molecular Devices MetaFluor imaging software.
Calibration of the intracellular SBFI-AM dye fluorescence was conducted using ionophores (5 μm nigericin+5 μM monensin) to permeabilize the cell membrane and equilibrate [Na+]i with bath [Na+] over a range of 0–140 mM (31). Sequential emission ratios (340/380-nm excitation wavelength) every 2 s were collected for ∼5 min/change in bath [Na+]. Postcapture, saved images were subtracted for background, and changes in cellular dye intensity ratio were plotted against [Na+]i to produce a calibration curve, using nonlinear least small squares regression as described (36).
Cells transiently expressing RFP, RFP-Dot1a, or RFP-AF9 fusion were first identified and marked by epifluorescence microscopy with a separate excitation and emission filter combination specific for RFP, which has an excitation maximum of 556 nm and an emission maximum of 586 nm. The same identification template on the same field of cells was then used for collecting SBFI image data.
In all cases, data from multiple cells in each experiment were averaged and counted as a single observation (n = 1). Throughout the experiment, the bath temperature was kept at 37°C by prewarming the extracellular solutions and by 37°C water-jacketing the oil-immersion lens of the inverted microscope.
Electrophysiological measurements.
Cells were grown on 12-mm filter units and fed on both apical and basolateral sides with culture medium (DMEM/F12 plus 10% FBS) and allowed to form monolayers. The medium was changed every 3 days. The transepithelial voltage (VTE) and transepithelial resistance (RTE) of each filter were determined regularly by using an Epithelial Volt-ohmmeter (EVOM) (World Precision Instruments) with a set of Ag:AgCl electrodes, under sterile conditions as reported (17, 19). When the resistance reached the threshold level of 900 Ω·cm2, the monolayers were considered confluent (17) and VTE was measured every 1 min for minimal 10 times. Benzamil (1 μM) was then added to the apical side. Five minutes later, VTE was recorded again similarly. The readings before or after benzamil administration from a single filter were averaged and counted as 1 (n = 1). The benzamil-sensitive equivalent Isc was determined as the current difference with and without 1 μM benzamil in the apical bathing solution.
Sequence analyses.
NLSs were identified using PSOFT II Prediction at http://psort.ims.u-tokyo.ac.jp/form2.html/. Alignment was performed with Protein Alignment in a MacVector package at http://www.macvector.com/.
Real-time RT-qPCR, immunoblotting, epifluorescence, and confocal microscopy.
These assays were conducted according to our published protocols (13, 14, 33, 48). For epifluorescence and confocal microscopy, 293T cells were cultured in four-well glass chamber slides and transfected with various constructs expressing GFP-Dot1a fusions. Twenty-four hours after transfection, cells were rinsed briefly in PBS, fixed with 1% fresh prepared paraformaldehyde for 30 min, and stained with 300 nM 4′,6-diamidino-2-phenylindole (DAPI; Sigma) for 15 min. After mounting with Vectashield mounting medium (Vector Labs), cells were examined by epifluorescence microscopy and counted as cytoplasmic [C], nuclear [N], or both [C/N], depending on the primary location of the fusion proteins. It should be stressed that cells considered as C do not necessarily mean that the fusion proteins are exclusively located in the cytoplasm. However, it does indicate that the vast majority of the fusion proteins reside in the cytoplasm. This principle is also applied to N. We then randomly selected multiple fields of each transfection and took images with a confocal microscope (510 Meta, Zeiss LSM) to confirm the distribution pattern. In most cases, the results of the confocal microscopy are consistent with those of the epifluorescence microscopy. This may explain why epifluorescence microscopy has been widely used by many other groups for similar experiments (2, 22, 29).
Statistical analysis.
All quantitative data are presented as means ± SE. The statistical significance was determined by Student's t-test for all comparisons, with a significant level set at P < 0.05.
RESULTS
Dot1a harbors three potential NLSs.
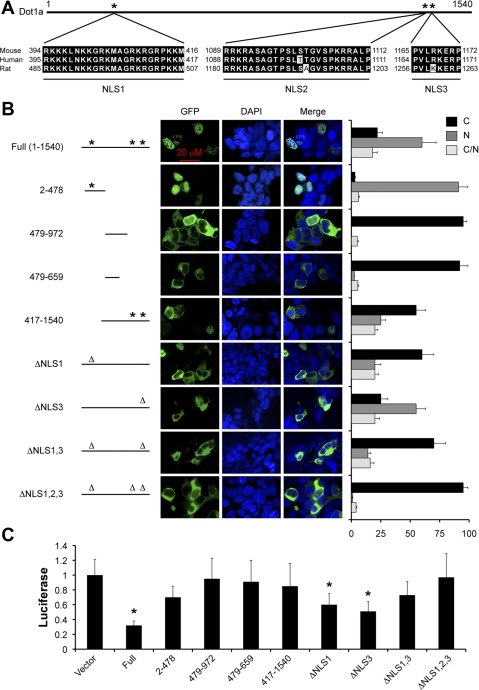
When Dot1a was transiently expressed as a GFP fusion in 293T cells, the GFP signals were primarily located in the cytoplasm, nucleus, or both. The cellular distribution of Dot1a apparently regulates histone H3K79 methylation and thus Dot1a-AF9-mediated repression of ENaC genes and their key regulators in these cells (33). However, no NLSs within Dot1a sequence have been previously identified and characterized. Therefore, we performed sequence analysis and identified three potential NLSs spanning amino acids 394–416 (NLS1), 1089–1112 (NLS2), and 1165–1172 (NLS3). These NLSs are highly conserved in rat and human with identical NLS1 sequences, one mismatch in human NLS2, rat NLS2, and rat NLS3, respectively (Fig. 1A).
Fig. 1.
Dot1a has 3 potential nuclear localization signals (NLSs). The potential NLSs of Dot1 proteins from mouse, human, and rat (GenBank nos.AY196089, AF50950, and XP_343160, respectively) were identified using PSOFTII Prediction and aligned by MacVector software, with amino acid positions as indicated (A). Wild-type (WT) and various Dot1a mutants were transiently expressed as green fluorescent protein (GFP) fusions in 293T cells and analyzed by epifluorescence and confocal microscopy. DAPI, 4′,6-diamidino-2-phenylindole. Cells were categorized as cytoplasmic [C], nuclear [N], or both [C/N], depending on the predominant location of the fusion proteins. The presence (*) or absence (Δ) of a NLS was indicated. The graphed value (percentage) is the number of cells of each localization type divided by the total number of cells examined. At least 240 transfected cells/transfection were examined from 5 independent experiments (n = 5). M1 cells were transiently transfected with an α-subunit of the epithelial Na channel (αENaC) promoter-luciferase reporter along with a GFP vector (vector) or one of the GFP-Dot1a constructs as in B, followed by luciferase reporter assays (C); n = 3. *P < 0.05 vs. vector.
To evaluate the biological significance of these putative NLSs in regulating Dot1a cellular distribution, nine GFP fusion constructs containing various Dot1a fragments were generated, transiently transfected into 293T cells, and analyzed by epifluorescence and confocal microscopy. As shown in Fig. 1B, under the conditions tested, GFP-WT Dot1a was present in the nucleus in 60% of cells, with only 22% in the cytoplasm and 18% in both compartments. The percentage of cells with nuclear GFP-Dot1a fusion was elevated to 91% when the construct contained the N-terminal fragment 2–478 only. This observation, along with the data from NLS1 deletion mutant (see below), suggests that NLS1 is a very strong NLS. The internal fragments (479–659 and 479–972) lack an obvious NLS, and these fusions almost exclusively resided in the cytoplasm, with 0 or 2.5% of cells showing GFP signal dominantly in the nucleus. Thus it is very unlikely that a functional NLS exists within these sequences. The C-terminal sequence 417–1540 that possesses NLS2 and NLS3, but lacks NLS1, was detected in the cytoplasm in 55% of cells and in the nucleus in 25% of cells, suggesting that either one or both NLSs are important for regulating Dot1a nuclear distribution.
To more directly assess the role of each NLS, mutants with deletion of these NLSs were created and examined similarly. Only 20% of cells expressed a NLS1 deletion mutant (ΔNLS1) in the nucleus, compared with 60% in cells expressing WT Dot1a. In contrast, cells expressing cytoplasmic ΔNLS1 mutant rose by 38%. The percentage of cells with nuclear GFP-Dot1a was decreased from 60 to 55% when NLS3 was deleted. Consistently, a double mutant in which both NLS1 and NLS3 are removed (ΔNLS1,3) decreased nuclear expression from 20 to 14% and increased cytoplasmic distribution from 60 to 70% compared with the ΔNLS1 mutant. The triple mutant (ΔNLS1,2,3) was found in the nucleus in only 1% of cells, and in the cytoplasm in ∼95% of cells. The other 4% of cells expressed the mutant protein in both nucleus and cytoplasm. In aggregate, our data suggest that NLS1, NLS2, and NLS3 most likely play a role in directing Dot1a nuclear expression, with NLS1 and NLS2 being more important than NLS3. It should be stressed that Fig. 1B only shows a small portion of the representative confocal images of each transfection. Each of these images was selected to show the three types of cells ([C], [N], and [C/N]) whenever possible. Since limited numbers of cells can be shown, these images are not intended to indicate the relative percentage of each cell type.
Removal of Dot1a NLSs abolished Dot1a-mediated repression of the αENaC promoter.
Using 293T and IMCD3 cells, we previously demonstrated that Dot1a represses αENaC expression in a methyltransferase-dependent manner (47). AF9 binds the AF9/AF17-interacting domain of Dot1a and targets Dot1a to the αENaC promoter for H3K79 methylation (49). AF17 partially relieves Dot1a-mediated repression, possibly by competing with AF9 to bind Dot1a and by facilitating Dot1a nuclear export (33). Therefore, Dot1a-mediated repression apparently requires Dot1a nuclear expression, its methyltransferase activity, and AF9-mediated, targeted H3K79 methylation. To further test this hypothesis and extend our studies to a more appropriate cell line, we cotransfected M1 cells with the αENaC promoter-luciferase reporter (48–50) along with each nine constructs encoding GFP-Dot1a fusions and performed luciferase assays. Overexpression of WT Dot1a decreased the luciferase activity to 32% of the vector control, as we previously reported for IMCD3 cells (49). This repression was largely relieved by mutations that impede Dot1a nuclear expression, remove the AF9/AF17 interaction domain, or remove the methyltransferase domain. For example, the luciferase activity of the cells expressing Dot1a 479–972, 479–659, or ΔNLS1,2,3 was virtually indistinguishable from that of the vector-transfected cells likely because all of these mutants were predominantly expressed in the cytoplasm. Dot1a 2–478 contains the methyltransferase domain (27, 47), but lacks the AF9/AF17-interacting domain (33, 49), while Dot1a 417–1540 misses the former and harbors the latter. Luciferase activity was reduced to 70 or 85% of control in cells overexpressing these two mutants, respectively, compared with 32% in WT Dot1a-expressing cells (Fig. 1C). These results suggest that nuclear expression is essential for Dot1a to repress the αENaC promoter.
AF9 is expressed primarily in the nuclei of IMCD3 cells and mouse kidney collecting duct cells.
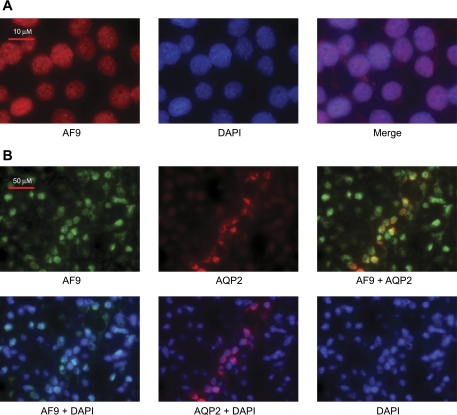
In the absence of an antibody that can detect endogenous Dot1a in immunohistochemistry analysis, we used H3 K79 methylation as an indicator of Dot1a methyltransferase activity and defined the ubiquitous expression of H3 dimethylated K79 in mouse kidney (48). We also reported that the vast majority of transiently expressed RFP-tagged AF9 was located in the nuclei of IMCD3 and 293T cells, where it colocalized with GFP fusions harboring Dot1a or Sgk1 (33, 49). The cellular distribution of endogenous AF9 in IMCD3 cells or mouse kidney, however, has not been addressed. Accordingly, we first performed indirect immunofluorescence microscopy with a purified antibody recognizing AF9 on IMCD3 cells. The specificity of the antibody remains to be tested in future studies. DAPI was applied to stain the nuclei. As shown in Fig. 2A, IMCD3 cells express endogenous AF9 robustly in the nuclei and at very low levels in the cytoplasm, reminiscent of what we observed for transfected RFP-AF9 (33, 49). Most recently, Lin and Hemenway (24) performed immunoblotting and immunofluorescence microscopic analyses with a similar AF9 antibody (Hemenway CS, personal communication) and found that AF9 was primarily expressed in the nuclei of IMCD3 cells. To determine whether AF9 is expressed in aldosterone target cells of the adult mouse kidney, similar experiments were conducted using mouse kidney sections. An anti-AQP2 antibody was used as a marker of collecting duct principal cells, in which ENaC is expressed and regulated by aldosterone in the kidney. AF9 was detected in all collecting duct epithelial cells, regardless of the presence or absence of AQP2 expression. Similar to its primarily nuclear expression in IMCD3 cells, most AF9 staining was apparently nuclear, as evidenced by the merged images with DAPI-stained nuclei of the kidney cells (Fig. 2B). In all cases, no immunofluorescence was observed when either primary antibody was omitted (data not shown).
Fig. 2.
AF9 is expressed and primarily located in the nuclei of kidney collecting duct cells. A: representative immunofluorescence images of AF9 expression in IMCD3 cells. Cells were fixed, and indirect immunofluorescence performed with a rabbit polyclonal antiserum against AF9 as the primary antibody and Alexa Fluor 488 goat anti-rabbit IgG as the secondary antibody. DAPI was applied to stain the nuclei; n = 3. B: representative immunofluorescence images of AF9 expression in mouse kidney collecting duct cells. The procedure was as in A, except that tissue sections of the mouse kidney were used, and an anti-aquaporin-2 antibody raised in chicken and Alexa Fluor 594 goat anti-chicken IgG were included to locate the principal cells; n = 3. AQP2, aquaporin-2.
Aldosterone regulates expression of ENaC genes and their key regulator Sgk1 at both mRNA and protein levels.
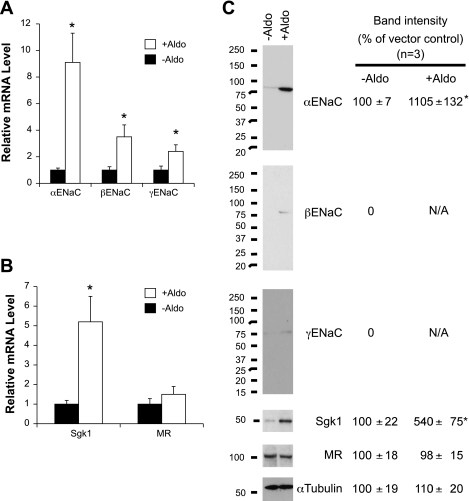
We and others have demonstrated that aldosterone differentially regulates a panel of genes including αENaC and its transcriptional regulators Dot1a and AF9 in IMCD3 cells (13, 14, 48). This regulatory mechanism is largely conserved in 293T cells and can be extended to other target genes (33). However, the effects of aldosterone on the expression of β- and γENaC and their regulatory factors such as Sgk1, and MR have not been documented in IMCD3 cells. Furthermore, the effect of aldosterone on their protein levels remains largely unknown. To this end, total RNA and whole cell lysates were isolated from IMCD3 cells treated with either vehicle as control or aldosterone (1 μM for 24 h) and analyzed for expression of these genes by real-time RT-qPCR and immunoblotting. The positive control αENaC increased in mRNA abundance to over 800% of the control level in aldosterone-treated cells. Aldosterone treatment also significantly induced mRNA expression of β- and γENaC, as indicated by the elevation of their levels to 240 and 140%, respectively, compared with vehicle-treated cells (Fig. 3A).
Fig. 3.
ENaC and Sgk1 are regulated by aldosterone in IMCD3 cells. A and B: total RNA was isolated from IMCD3 cells cultured in DMEM plus 10% charcoal-stripped FBS for at least 50 h and then treated with vehicle (ethanol, −Aldo) or 1 μM aldosterone (+Aldo) for 24 h and analyzed by real-time RT-quantitative PCR for expression of ENaC subunits (A), and ENaC transcriptional regulators Sgk1 and MR (B). The mRNA level of each gene was first normalized against β-actin mRNA in the same sample and set to 1 in the vehicle-treated cells. *P < 0.05 vs. −Aldo; n = 3. C: as in A, whole cell lysates were analyzed by immunoblotting with antibodies specific for the proteins as indicated. For each protein, the relative band intensity in vehicle-treated cells was set to 100 for comparison. MR, mineralocorticoid receptor. *P < 0.05 vs. −Aldo; n = 3.
Sgk1 is a well-characterized aldosterone target and regulator of ENaC (7, 8, 23, 30, 45). In particular, aldosterone enhances Sgk1 expression at mRNA and protein levels in IMCD3 cells, as previously reported by others (13, 14) and ourselves (50), respectively. In agreement with these observations, the amount of Sgk1 transcript was fourfold higher in the aldosterone-treated cells than in control cells. Although MR was upregulated by aldosterone in 293T cells (33), this observation was not replicated in IMCD3 cells. MR mRNA levels were indistinguishable in the IMCD3 cells treated with vehicle or aldosterone (Fig. 3B).
As shown in Fig. 3C, the basal level of αENaC protein in IMCD3 cells cultured with charcoal-stripped serum was very low but increased over 10-fold by aldosterone. β- and γENaC subunits were barely detectable in the absence of the hormone and became discernable after aldosterone induction. Consistent with our previous report, Sgk1 abundance was fourfold higher in the aldosterone-treated cells vs. control. However, no significant changes in MR abundance were observed. Comparable levels of α-tubulin confirmed equal loading. In brief, these observations indicate that aldosterone significantly increases expression of the three ENaC genes and their critical regulator Sgk1 at mRNA and protein levels, but has little impact on MR expression.
Dot1a and AF9 downregulate expression of ENaC genes and Sgk1 at mRNA and protein levels.
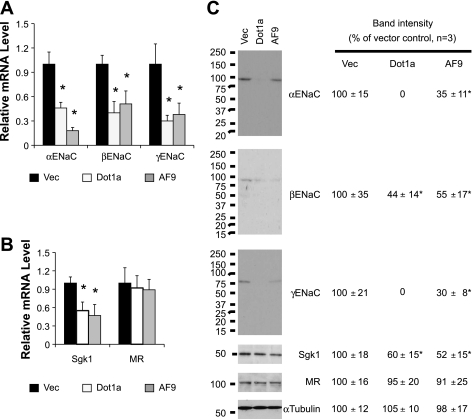
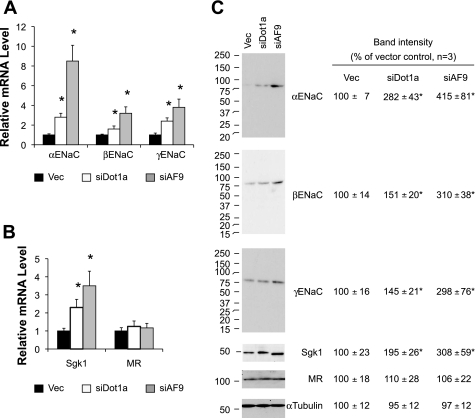
Dot1a-AF9 complex represses αENaC and three aldosterone-regulated genes: connecting tissue growth factor (CTGF), preproendothelin-1, and period-1 in IMCD3 cells (48–50). However, the role of the Dot1-AF9 complex in controlling mRNA and protein expression of βENaC, γENaC, MR, and Sgk1 has not been explored previously. Accordingly, IMCD3 cells were transiently transfected with the vector plasmid pcDNA3.1 or its derivatives encoding Dot1a or AF9 and investigated as above. As reported before, overexpression of Dot1a or AF9 impaired mRNA expression of αENaC as a positive control. A similar pattern was also observed for βENaC, γENaC (Fig. 4A), and Sgk1 (Fig. 4B). In all cases, MR expression was relatively constant for all transfections (Fig. 4B).
Fig. 4.
Overexpression of Dot1a and AF9 downregulates mRNA and protein expression of ENaC and Sgk1. IMCD3 cells were transiently transfected with pcDNA3.1 (Vec) or its derivatives expressing Dot1a or AF9. Twenty-four hours after transfection, total RNA and whole cell lysates were prepared and analyzed as in Fig. 3. Shown are ENaC mRNAs (A), ENaC regulators Sgk1 and MR mRNA (B), and their protein abundance (C). The relative abundance of mRNA or protein of each gene was set to 1 or 100 in vector-transfected cells and used for comparison; n = 3. *P < 0.05 vs. vector for each gene.
Unlike the aldosterone experiment, the basal levels of ENaC and Sgk1 proteins in IMCD3 cells transfected with the vector plasmid were all reliably detected, possibly due to different culture conditions including the use of regular instead of charcoal-stripped serum. Such basal levels became undetectable or were significantly decreased by 55–70% in Dot1a- or AF9-overexpressing cells, respectively. Again, the abundance of MR protein was not significantly different among the three transfections (Fig. 4C).
We previously reported that IMCD3 cells stably transfected with pDot1RNAi2 (siDot1a) reduced Dot1a mRNA by 41%, compared with control cells (48). RT-qPCR analyses revealed that Dot1a knockdown significantly increased α-, β-, γENaC, and Sgk1 mRNA levels to 280, 160, 240, and 230% of control levels, respectively (Fig. 5, A and B). The increases in mRNA levels of these genes were accompanied with equivalent changes in their protein abundance (Fig. 5C). Similarly, stable transfection of pAF9RNAi2 (siAF9) inhibited AF9 protein to 12% of the vector-transfected cell level (50), which led to a more dramatic effect on expression of ENaC and Sgk1, with mRNA abundance being elevated by over two- to sevenfold and protein levels by two- to threefold vs. the vector-transfected cells. In all cases, no significant changes in MR expression were observed at both mRNA and protein levels (Fig. 5).
Fig. 5.
Knockdown of Dot1a and AF9 upregulates mRNA and protein expression of ENaC and Sgk1. A–C: IMCD3 cells stably transfected with an empty vector (Vec), pDot1aRNAi2 (siDot1a) (48), or pAF9RNAi2 (siAF9) (49) were examined by real-time RT-PCR (A and B) or immunoblotting (C) for expression of the genes indicated as in Fig. 4; n = 3. *P < 0.05 vs. vector for each gene.
Taken together, our data not only suggest that Dot1a and AF9 repress mRNA expression of βENaC, γENaC, and Sgk1 but also for the first time demonstrate that the Dot1a-AF9 complex downregulates the protein abundance of these genes and thus ENaC-mediated Na+ transport (see below) and has little effect on MR expression in IMCD3 cells.
Na+ transport is primarily mediated by ENaC in IMCD3 cells.
Previous studies revealed that the apical-to-basal flux of Na+ in IMCD3 cells was largely amiloride sensitive (32), suggesting that ENaC is the major contributor to this process. To confirm this observation independently, single-cell fluorescence imagining with SBFI-AM was employed to measure benzamil-sensitive [Na+]i as an index of ENaC activity. Measurement of SBFI-AM-based [Na+]i has been described in various settings such as isolated rat and rabbit ventricular myocytes (9, 43), rabbit cortical collecting duct (31), Jurkat tumor lymphocytes (16), rat cardiomyocyte (28), and mouse cortical collecting duct mpkCCDcl4 cells (6).
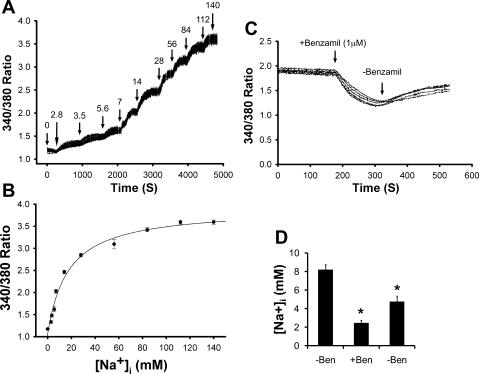
To calibrate the intracellular SBFI-AM dye fluorescence, IMCD3 cells were made permeable to Na+ with ionophores (5 μm nigericin+5 μM monensin). Representative calibration recordings of 28 simultaneously monitored cells are shown in Fig. 6A. Rapid, sustained elevations in the ratio of fluorescence signals at 340 over 380 nm were observed when a stepwise increase in the bath [Na+] over a range of 0–140 mM (31) was applied. Three independent experiments were performed in this fashion to construct the calibration curve (Fig. 6B) as detailed in materials and methods.
Fig. 6.
Na+ transport in IMCD3 cells is primarily mediated by ENaC. A: representative calibration recordings of 28 simultaneously monitored cells. Cells loaded with SBFI were superfused with Na-HEPES physiological saline as detailed in materials and methods (rest) and then with calibration solution containing ionophores (5 μm nigericin+5 μM monensin) to permeabilize the cell membrane and equilibrate the intracellular environment [intracellular Na+ concentration ([Na+]i)] with the external solution over a range of 0 to 140 mM as indicated above the trace. B. plots of [Na+]i vs. 340/380 ratio. Data points from 3 experiments of the type shown in A were fitted using nonlinear least squares regression as described (36). C. representative tracings in the absence or presence of ENaC-specific inhibitor benzamil (Ben). The procedure was as in A except that the cells were superfused with Na-HEPES physiological saline with addition and removal of benzamil (1 μM) as indicated. D: [Na+]i from 3 independent experiments (n = 3) of the type shown. The calibration curve shown in B was used to calculate [Na+]i. *P < 0.05 vs. −Ben (before addition of the inhibitor).
To evaluate ENaC activity in IMCD3 cells, fluorescence ratios were recorded before and after addition of the ENaC-specific inhibitor benzamil (1 μM) to the solution bathing the IMCD3 cells. A representative tracing is given in Fig. 6C. The fluorescence ratios were significantly decreased by the addition of the inhibitor and partially recovered following its removal (Fig. 6C). Using the calibration curve shown in Fig. 6B, the fluorescence ratios were converted into [Na+]i. In this way, the estimated basal [Na+]i value (in mM, hereafter) in IMCD3 cells was found to be 8.3, which is very close to the 9.4 of Jurkat tumor lymphocytes (16) and was gradually decreased to 1.2 in the presence of benzamil. Removal of benzamil partially restored [Na+]i to 4.7 (Fig. 6D). These data demonstrate the feasibility of the [Na+]i assay and suggest that ENaC is largely responsible for Na+ uptake in IMCD3 cells under the conditions tested.
ENaC-mediated Na+ transport is regulated by aldosterone in a transcription and translation dependent manner in IMCD3 cells.
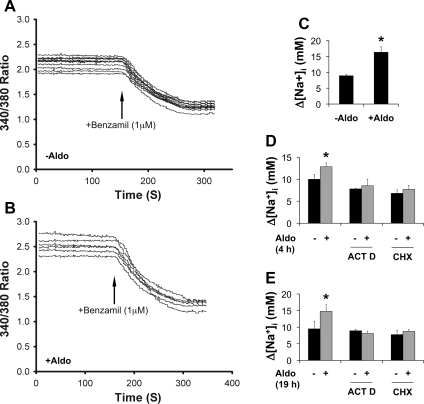
To determine whether aldosterone-stimulated ENaC mRNA expression is coupled to increased ENaC activity, benzamil-sensitive [Na+]i was estimated in IMCD3 cells treated with ethanol as a vehicle control or aldosterone (1 μM) for 24 h. Representative recordings in the absence or presence of benzamil from these experiments are shown in Fig. 7, A and B. Consistent with the findings in RT-qPCR, aldosterone significantly increased ENaC activity as seen by the increase in the benzamil-sensitive [Na+]i from 8.9 to 16.3 (Fig. 7C). Similar results were obtained when aldosterone treatment was performed for 4 and 19 h (Fig. 7, D and E). However, such an effect was largely abolished by 1-h pretreatment with either transcription inhibitor actinomycin D (5 μg/ml) (1, 3, 11) or translation inhibitor cycloheximide (10 μg/ml) (12, 18), as shown in Fig. 7, D and E, respectively. These results indicate that new mRNA and protein synthesis is required for aldosterone-induced ENaC-mediated Na+ uptake in IMCD3 cells under the conditions tested.
Fig. 7.
Aldosterone upregulates ENaC-mediated Na+ transport in a transcription- and translation-dependent manner. A and B: representative sodium-binding benzofuran isophthalate (SBFI) recordings. IMCD3 cells treated with ethanol as vehicle control or aldosterone (1 μM) for 24 h were loaded with SBFI and superfused with Na-HEPES physiological saline before and after addition of benzamil (1 μM) as indicated. C. benzamil-sensitive [Na+]i (Δ[Na+]i) of IMCD3 cells from 3 independent experiments of the type shown in A and B. *P < 0.05 vs. −Aldo. D: as in C except that cells were treated with vehicle or aldosterone for 4 h. Alternatively, cells were pretreated with actinomycin D (ACT D; 5 μg/ml) or cycloheximide (CHX; 10 μg/ml) for 1 h before aldosterone treatment. *P < 0.05 vs. −Aldo; n = 3. E: as in D except that cells were treated with aldosterone for 19 h. *P < 0.05 vs. −Aldo; n = 3.
Dot1a and AF9 attenuate Na+ transport in IMCD3 cells.
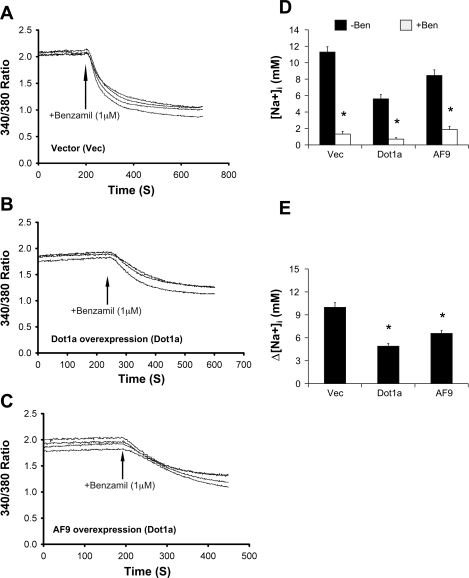
To determine whether the effects of Dot1a or AF9 overexpression on mRNA and protein expression of ENaC subunit genes result in a physiologically significant alternation of ENaC activity, IMCD3 cells were transiently transfected with RFP as a vector control or RFP fusions harboring Dot1a or AF9. The RFP tag allows easy identification of the transfected cells and has little overlap with the spectral profile of SBFI-AM. Representative tracings from each of these transfections are given in Fig. 8, A–C, respectively. In agreement with the observations in RT-qPCR and immunoblotting analyses, the basal level of [Na+]i was decreased from 11.3 in control cells to 5.6 and 8.5 in Dot1a- or AF9-overexpressing cells, respectively (Fig. 8D). The corresponding estimates of [Na]i were significantly reduced to 1.3, 0.7, and 1.9 after benzamil addition (Fig. 8D). As a result, the benzamil-sensitive [Na+]i was significantly decreased from 9.9 to 4.9 and 6.6 by Dot1a and AF9 overexpression, respectively (Fig. 8E).
Fig. 8.
Overexpression of Dot1a and AF9 inhibit ENaC-mediated Na+ transport in IMCD3 cells. A–C: representative SBFI recordings of IMCD3 cells transiently transfected with red fluorescence protein (RFP) vector or its derivatives encoding Dot1a or AF9 fusions. The cells were analyzed for Na+ transport as in Fig. 7. Transfected cells were first identified and marked by epifluorescence microscopy with an RFP-specific filter. The same field of cells was then switched to SBFI-specific filters for [Na+]i imaging. D and E: averages of [Na+]i before (−Ben) and after (+Ben) 1 μM benzamil addition (D) and benzamil-sensitive [Na+]i (E) from at least 20 transfected cells/transfection from 3 independent experiments. Readings of nontransfected cells were excluded from analysis. *P < 0.05 vs. vector; n = 3.
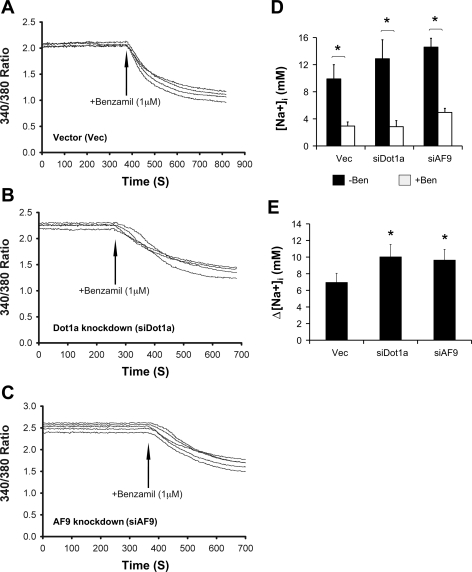
In reciprocal experiments, knockdown of Dot1a and AF9 elicited an opposite effect on Na+ transport. Representative tracings are given in Fig. 9, A–C. In the absence of benzamil, [Na]i was increased from 9.9 to 12.9 and 14.6 by impaired Dot1a and AF9 expression. After benzamil addition, these values were dramatically decreased to 2.9, 2.8, and 4.9 (Fig. 9D). In other words, separate knockdown of Dot1 and AF9 enhanced benzamil-sensitive [Na+]i by 45 and 39% (Fig. 9E).
Fig. 9.
Knockdown of Dot1 and AF9 enhance ENaC-mediated Na+ transport in IMCD3 cells. The procedure was the same as Fig. 8 except that IMCD3 cells stably transfected as in Fig. 5 were used. *P < 0.05 vs. vector; n = 3.
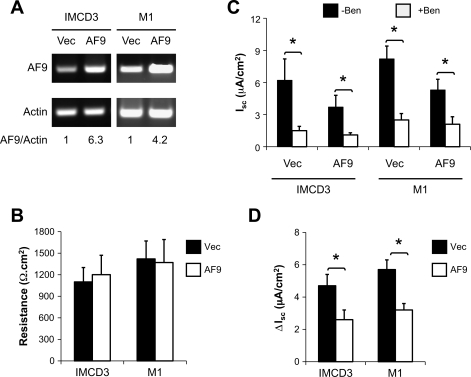
Measurement of the equivalent Isc was carried out to independently verify and extend these observations. IMCD3 and mouse cortical collecting duct M1 cells were transfected with pcDNA3.1 (Vec), pcDNA-Dot1a (Dot1a), or pcDNA-AF9 (AF9) and selected for stable transfection as detailed in materials and methods. While Dot1a-transfected cells were able to transiently overexpress Dot1a, they failed to maintain this overexpression during the formation of confluent monolayers on permeable supports and were excluded from further analyses. In contrast, AF9 mRNA levels were five- and threefold higher in AF9-transfected IMCD3 and M1 cells than those in the corresponding vector-transfected cells, as evidenced by real-time RT-qPCR of the total RNAs isolated from the monolayers of these stable cell lines (Fig. 10A). Nevertheless, all of them displayed comparably high resistance (Fig. 10B).
Fig. 10.
AF9 attenuates benzamil-sensitive equivalent short-circuit current (Isc) in IMCD3 and M1 cells. A: representative agarose gel analyses of AF9 expression in IMCD3 and M1 cells stably transfected with pCDNA3.1 (Vec) or pcDNA-AF9 (AF9). Cells were cultured on permeable filters and allowed to form confluent monolayers. Total RNA was prepared and examined for AF9 expression by real-time RT-qPCR (bottom) and agarose gel analysis, with β-actin as an internal control. B–D. As in A, shown are averages of transepithelial resistance (B), Isc before (−Ben) and after (+Ben) addition of 1 μM benzamil (C), or benzamil-sensitive Isc (ΔIsc; D). *P < 0.05; n = 10 or 13 for each cell population, respectively.
In IMCD3 cells, the basal Isc (in μA/cm2) was 6.2 in the vector-transfected cells, which was decreased to 3.7 in the AF9-overexpressing cells. Addition of benzamil significantly decreased Isc to 1.5 and 1.1, respectively (Fig. 10C). Therefore, the benzamil-sensitive Isc (ΔIsc) was significantly lessened from 4.7 to 2.6 μA/cm2, a 45% reduction, by AF9 overexpression (Fig. 10D). Similarly, the baseline Isc in M1 cells was diminished from 8.2 to 5.3 by AF9 overexpression. Addition of benzamil significantly reduced Isc to 2.5 and 2.1, respectively, in these two M1-derived cell lines, yielding a 45% decrease in benzamil-sensitive Isc (from 5.7 to 3.2) due to AF9 overexpression. We intended to verify these results using whole cell patch clamping. Unfortunately, this approach proved to be inappropriate due to the fragility of IMCD3 and M1 cells (data not shown).
In summary, these observations consistently suggest that the Dot1a-AF9 complex downregulates ENaC expression at the mRNA and protein levels and thus ENaC-mediated Na+ transport in the two mouse collecting duct cell lines examined.
DISCUSSION
Our earlier work with IMCD3 cells defined an aldosterone-signaling network controlling the transcription of the αENaC gene (48–50). Most recently, we demonstrated that this pathway is largely conserved, regulated by Dot1a cellular distribution, and involved in the control of multiple regulators of basal and aldosterone-induced ENaC-mediated Na+ transport in human embryonic kidney HEK 293T cells (33).
In this paper, we confirm and extend these observations with multiple approaches in various systems. Our major findings include 1) there are at least three functional NLSs regulating Dot1a nuclear expression in 293T cells. To our knowledge, this is the first report regarding the characterization of Dot1a NLSs; 2) the expression profile of endogenous AF9 in mouse kidney is determined for the first time. AF9 protein is widely expressed in mouse kidney and primarily located in the nuclei of IMCD3 cells and mouse kidney epithelial cells, consistent with its putative role as a transcriptional regulator; 3) similar to αENaC, β- and γENaC genes and their regulator Sgk1 are also differentially regulated by aldosterone, Dot1a, and AF9 at the mRNA and protein expression levels in IMCD3 cells. This is the first report demonstrating that the protein levels of these target genes are regulated by Dot1a and AF9; and 4) the physiological significance of Dot1a and AF9 in regulating basal ENaC-mediated Na+ transport as measured by benzamil-sensitive [Na+]i and equivalent Isc was evaluated for the first time in IMCD3 and M1 cells.
Together with our recent work on AF17 (33), these studies consistently suggest that the Dot1a-AF9-AF17 network-mediated transcriptional control of ENaC plays a pivotal role in the regulation of ENaC-mediated Na+ transport in vitro in three different kidney cell lines (293T, IMCD3, and M1 cells) and in vivo in mouse kidney. More specifically, the nuclear distribution and wide expression pattern of H3 dimethylated K79 (presumably catalyzed by Dot1a) (48) and AF9 in mouse kidney support the hypotheses that 1) Dot1a-AF9-mediated repression occurs in most, if not all, of renal collecting duct epithelial cells; 2) such repression is relieved by aldosterone presumably only in its target cells, or by AF17 in yet unidentified AF17-expressing cells; 3) such transcriptional control of ENaC is coupled to regulation of ENaC-mediated Na+ transport; and 4) in non-principal (intercalated) cells, Dot1a-AF9-mediated repression may be constitutively maintained, contributing to silencing of ENaC genes in these cells.
The terminal inner medullary collecting duct (IMCD) is important in the control of the final urinary composition because major physiological processes including regulation of urinary concentration, acid secretion, and final sodium composition of urine take place in this nephron segment (32). IMCD3 cells are derived from the terminal IMCD and share many of the phenotypic properties of the IMCD in vivo (32). For example, IMCD3 cells are known to facilitate transepithelial Na+ transport via an amiloride-inhibitable pathway (39, 46). IMCD3 cells display amiloride sensitivity in the transepithelial Na+ transport assay, with 40% of apical-to-basal 22Na+ flux inhibited by amiloride addition, suggesting that ENaC is a major component of Na+ transport in these cells (32). However, in the presence of the specific amiloride analog benzamil in a concentration (1 μM) that has no effect on either intercalated cell Na+/H+ exchange or basolateral Na+-K+-ATPase activity (25), Na+ transport was inhibited by 70% as measured by SBFI-based single cell fluorescence imaging (Fig. 6D) or 75% as measured by Isc in vector-transfected cells (Fig. 10D). The differences in the magnitude of inhibition between our studies and the previous report may be due to the differences in the specificity of the inhibitors and/or the sensitivity of the assays used.
Although not thoroughly tested, the Dot1a-AF9 regulatory network may operate in M1 cells as well as in IMCD3 and 293T cells. In support of this hypothesis, all Dot1a mutants primarily expressed in the cytoplasm of 293T cells lost the ability to repress the αENaC promoter in M1 cells (Fig. 1C), implying that these mutants may also display similar cellular distribution patterns in M1 cells. Overexpression of AF9 decreased benzamil-sensitive Isc by comparable degrees in both M1 and IMCD3 cells (Fig. 10D). Based on these observations, we speculate that the Dot1a-AF9 system may function in a similar way in IMCD and the cortical collecting duct in vivo.
It has been known for decades that aldosterone requires ongoing transcription in its target epithelia to exert a physiological action. The major physiological role of aldosterone is the regulation of Na+, K+, and acid-base balance and control of blood pressure. In response to volume depletion, it stimulates Na+ reabsorption in the renal collecting duct to restore extracellular volume, in large part via activation of ENaCs (41). Aldosterone executes complex and temporally distinct actions on ENaC expression and activity, with both early (<3 h) effects attributed to enhanced trafficking and activity of the preexisting channel in the cell surface, and late actions (>3 h) that involve the synthesis of new ENaC subunits. The early phase is exclusively mediated by a primary effect on gene expression (41). In contrast, the later phase results from both primary and secondary effects on gene expression. Therefore, it is proposed that the signaling factors induced by aldosterone in the early phase lead to activation via posttranslational control of existing proteins involved in transport and allow a second round of gene expression to guarantee a sustained increase in transport. However, very little is known about how aldosterone-induced proteins specifically interact and regulate the transcription of ENaC subunit genes. We previously demonstrated that aldosterone decreases mRNA expression of Dot1a at 2 h (48) and AF9 at 1.5 h (49), the earliest time points examined in IMCD3 cells. At the protein level, decreased Dot1a mRNA expression is associated with a delayed reduction of histone H3K79 methylation in bulk histones at 7 h (48). Sgk1 protein was significantly induced 1 h later after aldosterone administration, which is accompanied by elevated AF9 phosphorylation at Ser435. The induction of Sgk1 and AF9 phosphorylation lasted at least 2 h as examined (50). These observations are compatible with our current results showing that transcription and translation inhibitors can block the effect of aldosterone treatment on ENaC-mediated Na+ transport as early as 4 h and as late as 24 h (Fig. 4, D and E).
It has been shown that the transcriptional control of ENaC gene expression occurs in a subunit- and tissue-specific manner. For instance, aldosterone increases αENaC subunit mRNA without affecting the mRNAs encoding the two other subunits in the kidney cortical collecting duct (26). A different situation occurs in the colon, where β- and γ-subunit mRNAs are upregulated by aldosterone or dexamethasone, but α-subunit mRNA is expressed constitutively (4, 10, 34). We saw an induction of the three subunits at both mRNA and protein levels by aldosterone (Fig. 3). It is possible that the discrepancy arises from the heterogeneous cell population in studies involving whole kidney or colon, compared with the relatively homogeneous population in the IMCD3 cell line.
Our data suggest that the Dot1a-AF9 complex represses transcription of Sgk1 as well as the ENaC subunits and Sgk1 phosphorylates AF9 to impair Dot1a-AF9-mediated transcriptional control. These observations raise the possibility that Sgk1 derepresses its own expression in a positive-feedback fashion. If this is true, it may contribute to the rapid and significant induction of Sgk1 upon aldosterone treatment. However, how Sgk1 expression is attenuated is unknown.
In conclusion, Dot1a and AF9 apparently regulate ENaC at multiple levels (mRNA, protein, and activity). Although the regulation of ENaC protein expression and ENaC activity can be largely attributed to a transcriptional effect, other mechanisms involving ENaC trafficking and degradation cannot be completely ruled out, particularly in the light of the Dot1a, AF9, and AF17 localization and interaction with Sgk1 in the cytoplasm (Fig. 1 and Ref. 33). In addition, it remains obscure whether and how aldosterone regulates Dot1a cellular distribution and whether H3K79 hypomethylation is also associated with the derepression of the promoters of β- and γENaC and Sgk1 under specific physiological conditions as it does with the αENaC promoter.
GRANTS
This work was funded by American Society of Nephrology Carl W. Gottschalk Research Scholar Grant (to W. Zhang), American Heart Association Beginning Grant-in-Aid 0865271F (to W. Zhang), and National Institute of Diabetes and Digestive and Kidney Diseases Grant R01 DK080236 (to W. Zhang).
DISCLOSURES
No conflicts of interest, financial or otherwise, are declared by the authors.
ACKNOWLEDGMENTS
We thank Dr. Mark Knepper and Dr. Ryoichi Teruyama for sharing the ENaC antibodies and Dr. James Wade for providing the anti-aquaporin-2 antibody (LC54).
REFERENCES
- 1.Abelson HT, Penman S. Selective inhibition of 4-S and 5-S RNA synthesis and nucleolar processing by the adenosine analogue formycin. Biochim Biophys Acta 312: 292–296, 1973 [DOI] [PubMed] [Google Scholar]
- 2.Akkiprik M, Hu L, Sahin A, Hao X, Zhang W. The subcellular localization of IGFBP5 affects its cell growth and migration functions in breast cancer. BMC Cancer 9: 103, 2009 [DOI] [PMC free article] [PubMed] [Google Scholar]
- 3.Al-Ahmadi W, Al-Haj L, Al-Mohanna FA, Silverman RH, Khabar KS. RNase L downmodulation of the RNA-binding protein, HuR, and cellular growth. Oncogene 28: 1782–1791, 2009 [DOI] [PMC free article] [PubMed] [Google Scholar]
- 4.Asher C, Wald H, Rossier BC, Garty H. Aldosterone-induced increase in the abundance of Na+ channel subunits. Am J Physiol Cell Physiol 271: C605–C611, 1996 [DOI] [PubMed] [Google Scholar]
- 5.Butterworth MB, Edinger RS, Frizzell RA, Johnson JP. Regulation of the epithelial sodium channel by membrane trafficking. Am J Physiol Renal Physiol 296: F10–F24, 2009 [DOI] [PMC free article] [PubMed] [Google Scholar]
- 6.Chang CT, Wu MS, Tian YC, Chen KH, Yu CC, Liao CH, Hung CC, Yang CW. Enhancement of epithelial sodium channel expression in renal cortical collecting ducts cells by advanced glycation end products. Nephrol Dial Transplant 22: 722–731, 2007 [DOI] [PubMed] [Google Scholar]
- 7.Chen SY, Bhargava A, Mastroberardino L, Meijer OC, Wang J, Buse P, Firestone GL, Verrey F, Pearce D. Epithelial sodium channel regulated by aldosterone-induced protein sgk. Proc Natl Acad Sci USA 96: 2514–2519, 1999 [DOI] [PMC free article] [PubMed] [Google Scholar]
- 8.Debonneville C, Flores SY, Kamynina E, Plant PJ, Tauxe C, Thomas MA, Munster C, Chraibi A, Pratt JH, Horisberger JD, Pearce D, Loffing J, Staub O. Phosphorylation of Nedd4–2 by Sgk1 regulates epithelial Na+ channel cell surface expression. EMBO J 20: 7052–7059, 2001 [DOI] [PMC free article] [PubMed] [Google Scholar]
- 9.Donoso P, Mill JG, O'Neill SC, Eisner DA. Fluorescence measurements of cytoplasmic and mitochondrial sodium concentration in rat ventricular myocytes. J Physiol 448: 493–509, 1992 [DOI] [PMC free article] [PubMed] [Google Scholar]
- 10.Escoubet B, Coureau C, Bonvalet JP, Farman N. Noncoordinate regulation of epithelial Na channel and Na pump subunit mRNAs in kidney and colon by aldosterone. Am J Physiol Cell Physiol 272: C1482–C1491, 1997 [DOI] [PubMed] [Google Scholar]
- 11.Fernandes RS, Cotter TG. Apoptosis or necrosis: intracellular levels of glutathione influence mode of cell death. Biochem Pharmacol 48: 675–681, 1994 [DOI] [PubMed] [Google Scholar]
- 12.Finlay D, Ruiz-Alcaraz AJ, Lipina C, Perrier S, Sutherland C. A temporal switch in the insulin-signalling pathway that regulates hepatic IGF-binding protein-1 gene expression. J Mol Endocrinol 37: 227–237, 2006 [DOI] [PubMed] [Google Scholar]
- 13.Gumz ML, Popp MP, Wingo CS, Cain BD. Early transcriptional effects of aldosterone in a mouse inner medullary collecting duct cell line. Am J Physiol Renal Physiol 285: F664–F673, 2003 [DOI] [PubMed] [Google Scholar]
- 14.Gumz ML, Stow LR, Lynch IJ, Greenlee MM, Rudin A, Cain BD, Weaver DR, Wingo CS. The circadian clock protein Period 1 regulates expression of the renal epithelial sodium channel in mice. J Clin Invest 119: 2423–2434, 2009 [DOI] [PMC free article] [PubMed] [Google Scholar]
- 15.Hamm LL, Feng Z, Hering-Smith KS. Regulation of sodium transport by ENaC in the kidney. Curr Opin Nephrol Hypertens 19: 98–105, 2010 [DOI] [PMC free article] [PubMed] [Google Scholar]
- 16.Harootunian AT, Kao JP, Eckert BK, Tsien RY. Fluorescence ratio imaging of cytosolic free Na+ in individual fibroblasts and lymphocytes. J Biol Chem 264: 19458–19467, 1989 [PubMed] [Google Scholar]
- 17.Helms MN, Fejes-Toth G, Naray-Fejes-Toth A. Hormone-regulated transepithelial Na+ transport in mammalian CCD cells requires SGK1 expression. Am J Physiol Renal Physiol 284: F480–F487, 2003 [DOI] [PubMed] [Google Scholar]
- 18.Jin Z, El-Deiry WS. Distinct signaling pathways in TRAIL- versus tumor necrosis factor-induced apoptosis. Mol Cell Biol 26: 8136–8148, 2006 [DOI] [PMC free article] [PubMed] [Google Scholar]
- 19.Jovov B, Orlando GS, Tobey NA, Brown KL, Djukic Z, Carson JL, Brighton LE, Orlando RC. Ion transport and barrier function in a telomerase-immortalized human nondysplastic, Barrett's cell line (BAR-T). Dis Esophagus 22: 386–395, 2009 [DOI] [PubMed] [Google Scholar]
- 20.Kellner M, Peiter A, Hafner M, Feuring M, Christ M, Wehling M, Falkenstein E, Losel R. Early aldosterone up-regulated genes: new pathways for renal disease? Kidney Int 64: 1199–1207, 2003 [DOI] [PubMed] [Google Scholar]
- 21.Kleyman TR, Carattino MD, Hughey RP. ENaC at the cutting edge: regulation of epithelial sodium channels by proteases. J Biol Chem 284: 20447–20451, 2009 [DOI] [PMC free article] [PubMed] [Google Scholar]
- 22.Knapp AA, McManus PM, Bockstall K, Moroianu J. Identification of the nuclear localization and export signals of high risk HPV16 E7 oncoprotein. Virology 383: 60–68, 2009 [DOI] [PMC free article] [PubMed] [Google Scholar]
- 23.Lang F, Cohen P. Regulation and physiological roles of serum- and glucocorticoid-induced protein kinase isoforms. Sci STKE 2001: RE17, 2001 [DOI] [PubMed] [Google Scholar]
- 24.Lin JJ, Hemenway CS. HSP90 directly modulates the spatial distribution of AF9/MLLT3 and affects target gene expression. J Biol Chem [DOI] [PMC free article] [PubMed] [Google Scholar]
- 25.Lu M, Giebisch G, Wang W. Nitric oxide links the apical Na+ transport to the basolateral K+ conductance in the rat cortical collecting duct. J Gen Physiol 110: 717–726, 1997 [DOI] [PMC free article] [PubMed] [Google Scholar]
- 26.Masilamani S, Kim GH, Mitchell C, Wade JB, Knepper MA. Aldosterone-mediated regulation of ENaC alpha, beta, and gamma subunit proteins in rat kidney. J Clin Invest 104: R19–R23, 1999 [DOI] [PMC free article] [PubMed] [Google Scholar]
- 27.Min J, Feng Q, Li Z, Zhang Y, Xu RM. Structure of the catalytic domain of human DOT1L, a non-SET domain nucleosomal histone methyltransferase. Cell 112: 711–723, 2003 [DOI] [PubMed] [Google Scholar]
- 28.Most P, Pleger ST, Volkers M, Heidt B, Boerries M, Weichenhan D, Loffler E, Janssen PM, Eckhart AD, Martini J, Williams ML, Katus HA, Remppis A, Koch WJ. Cardiac adenoviral S100A1 gene delivery rescues failing myocardium. J Clin Invest 114: 1550–1563, 2004 [DOI] [PMC free article] [PubMed] [Google Scholar]
- 29.Nishi M, Ogawa H, Ito T, Matsuda KI, Kawata M. Dynamic changes in subcellular localization of mineralocorticoid receptor in living cells: in comparison with glucocorticoid receptor using dual-color labeling with green fluorescent protein spectral variants. Mol Endocrinol 15: 1077–1092, 2001 [DOI] [PubMed] [Google Scholar]
- 30.Pearce D. SGK1 regulation of epithelial sodium transport. Cell Physiol Biochem 13: 13–20, 2003 [DOI] [PubMed] [Google Scholar]
- 31.Peti-Peterdi J, Warnock DG, Bell PD. Angiotensin II directly stimulates ENaC activity in the cortical collecting duct via AT1 receptors. J Am Soc Nephrol 13: 1131–1135, 2002 [DOI] [PubMed] [Google Scholar]
- 32.Rauchman MI, Nigam SK, Delpire E, Gullans SR. An osmotically tolerant inner medullary collecting duct cell line from an SV40 transgenic mouse. Am J Physiol Renal Fluid Electrolyte Physiol 265: F416–F424, 1993 [DOI] [PubMed] [Google Scholar]
- 33.Reisenauer MR, Anderson M, Huang L, Zhang Z, Zhou Q, Kone BC, Morris AP, Lesage GD, Dryer SE, Zhang W. AF17 competes with AF9 for binding to Dot1a to up-regulate transcription of epithelial Na+ channel α. J Biol Chem 284: 35659–35669, 2009 [DOI] [PMC free article] [PubMed] [Google Scholar]
- 34.Renard S, Voilley N, Bassilana F, Lazdunski M, Barbry P. Localization and regulation by steroids of the alpha, beta and gamma subunits of the amiloride-sensitive Na+ channel in colon, lung and kidney. Pflügers Arch 430: 299–307, 1995 [DOI] [PubMed] [Google Scholar]
- 35.Robert-Nicoud M, Flahaut M, Elalouf JM, Nicod M, Salinas M, Bens M, Doucet A, Wincker P, Artiguenave F, Horisberger JD, Vandewalle A, Rossier BC, Firsov D. Transcriptome of a mouse kidney cortical collecting duct cell line: effects of aldosterone and vasopressin. Proc Natl Acad Sci USA 98: 2712–2716, 2001 [DOI] [PMC free article] [PubMed] [Google Scholar]
- 36.Sheldon C, Cheng YM, Church J. Concurrent measurements of the free cytosolic concentrations of H+ and Na+ ions with fluorescent indicators. Pflügers Arch 449: 307–318, 2004 [DOI] [PubMed] [Google Scholar]
- 37.Snyder PM. Down-regulating destruction: phosphorylation regulates the E3 ubiquitin ligase Nedd4–2. Sci Signal 2: pe41, 2009 [DOI] [PubMed] [Google Scholar]
- 38.Snyder PM. Minireview: regulation of epithelial Na+ channel trafficking. Endocrinology 146: 5079–5085, 2005 [DOI] [PubMed] [Google Scholar]
- 39.Sonnenberg H, Honrath U, Wilson DR. In vivo microperfusion of inner medullary collecting duct in rats: effect of amiloride and ANF. Am J Physiol Renal Fluid Electrolyte Physiol 259: F222–F226, 1990 [DOI] [PubMed] [Google Scholar]
- 40.Spindler B, Verrey F. Aldosterone action: induction of p21ras and fra-2 and transcription-independent decrease in myc, jun, and fos. Am J Physiol Cell Physiol 276: C1154–C1161, 1999 [DOI] [PubMed] [Google Scholar]
- 41.Stockand JD. New ideas about aldosterone signaling in epithelia. Am J Physiol Renal Physiol 282: F559–F576, 2002 [DOI] [PubMed] [Google Scholar]
- 42.Viengchareun S, Le Menuet D, Martinerie L, Munier M, Pascual-Le Tallec L, Lombes M. The mineralocorticoid receptor: insights into its molecular and (patho)physiological biology. Nucl Recept Signal 5: e012, 2007 [DOI] [PMC free article] [PubMed] [Google Scholar]
- 43.Wagner S, Dybkova N, Rasenack EC, Jacobshagen C, Fabritz L, Kirchhof P, Maier SK, Zhang T, Hasenfuss G, Brown JH, Bers DM, Maier LS. Ca2+/calmodulin-dependent protein kinase II regulates cardiac Na+ channels. J Clin Invest 116: 3127–3138, 2006 [DOI] [PMC free article] [PubMed] [Google Scholar]
- 44.Waseem TV, Kolos VA, Lapatsina LP, Fedorovich SV. Hypertonic shrinking but not hypotonic swelling increases sodium concentration in rat brain synaptosomes. Brain Res Bull 73: 135–142, 2007 [DOI] [PubMed] [Google Scholar]
- 45.Wulff P, Vallon V, Huang DY, Volkl H, Yu F, Richter K, Jansen M, Schlunz M, Klingel K, Loffing J, Kauselmann G, Bosl MR, Lang F, Kuhl D. Impaired renal Na+ retention in the sgk1-knockout mouse. J Clin Invest 110: 1263–1268, 2002 [DOI] [PMC free article] [PubMed] [Google Scholar]
- 46.Zeidel ML, Kikeri D, Silva P, Burrowes M, Brenner BM. Atrial natriuretic peptides inhibit conductive sodium uptake by rabbit inner medullary collecting duct cells. J Clin Invest 82: 1067–1074, 1988 [DOI] [PMC free article] [PubMed] [Google Scholar]
- 47.Zhang W, Hayashizaki Y, Kone BC. Structure and regulation of the mDot1 gene, a mouse histone H3 methyltransferase. Biochem J 377: 641–651, 2004 [DOI] [PMC free article] [PubMed] [Google Scholar]
- 48.Zhang W, Xia X, Jalal DI, Kuncewicz T, Xu W, Lesage GD, Kone BC. Aldosterone-sensitive repression of ENaCα transcription by a histone H3 lysine-79 methyltransferase. Am J Physiol Cell Physiol 290: C936–C946, 2006 [DOI] [PMC free article] [PubMed] [Google Scholar]
- 49.Zhang W, Xia X, Reisenauer MR, Hemenway CS, Kone BC. Dot1a-AF9 complex mediates histone H3 Lys-79 hypermethylation and repression of ENaCα in an aldosterone-sensitive manner. J Biol Chem 281: 18059–18068, 2006 [DOI] [PMC free article] [PubMed] [Google Scholar]
- 50.Zhang W, Xia X, Reisenauer MR, Rieg T, Lang F, Kuhl D, Vallon V, Kone BC. Aldosterone-induced Sgk1 relieves Dot1a-Af9-mediated transcriptional repression of epithelial Na+ channel alpha. J Clin Invest 117: 773–783, 2007 [DOI] [PMC free article] [PubMed] [Google Scholar]


