Abstract
The volume-sensitive chloride current (IClVol) exhibit a time-dependent decay presumably due to channel inactivation. In this work, we studied the effects of Cl- and H+ ions on IClVol decay recorded in HEK-293 and HL-60 cells using the whole-cell patch clamp technique. Under control conditions ([Cl-]e = [Cl-]i = 140 mM and pHi = pHe = 7.3), IClVol in HEK cells shows a large decay at positive voltages but in HL-60 cells IClVol remained constant independently of time. In HEK-293 cells, simultaneously raising the [Cl-]e and [Cl-]i from 25 to 140 mM (with pHe = pHi = 7.3) increased the fraction of inactivated channels (FIC). This effect was reproduced by elevating [Cl-]i while keeping the [Cl-]e constant. Furthermore, a decrease in pHe from 7.3 to 5.5 accelerated current decay and increased FIC when [Cl-] was 140 mM but not 25 mM. In HL-60 cells a slight IClVol decay was seen when the pHe was reduced from 7.3 to 5.5. Our data show that inactivation of IClVol can be controlled by changing either the Cl- or H+ concentration or both. Based on our results and previously published data we have built a model that explains VRAC inactivation. In the model the H+ binding site is located outside the electrical field near the extracellular entry whilst the Cl- binding site is intracellular. The model depicts inactivation as a pore constriction that happens by simultaneous binding of H+ and Cl- ions to the channel followed by a voltage-dependent conformational change that ultimately causes inactivation.
Keywords: Volume regulation, Cl- channels, Inactivation, pH dependence, Chloride
Introduction
In mammalian cells, volume-regulated anion channels (VRAC) serve as an exit pathway for chloride ions (Cl-) during regulatory volume decrease [9, 15, 18]. In addition VRAC play a role in physiological processes such as cell proliferation, differentiation and cell migration as well as apoptosis. In patho-physiological processes VRAC is responsible for the acquisition of cisplatin resistance by cancer cells, the death of cardiomyocytes and hippocampal neurons induced by ischaemia–reperfusion and the necrosis of glial and neuronal cells [19].
The chloride current (IClVol) generated by activation of intermediate conductance VRAC show little voltage dependence, however, with strong depolarisations IClVol rapidly decays to nearly zero in BC3H1 cells [26]. It is thought that such decay is due to a mechanism similar to a classical inactivation process present in voltage gated cation channels [11]. However, in blood cells such as macrophages, lymphocytes and neutrophils, IClVol is generated by activation of small conductance VRAC and displays almost no decay at any voltage [3, 12, 18, 20, 25]. The bases for such differences remain undetermined.
It has been reported that IClVol decay is subject to regulation by different external ions including, Ca2+, Mg2+, H+ and permeant anions. For example, increasing concentrations of Ca2+, Mg2+ and H+ in the extracellular media resulted in enhancement of channel inactivation [16, 23, 26]. Furthermore, lowering [Cl-]e accelerates inactivation and decreases the rate of recovery from inactivation whilst replacing extracellular Cl- with SCN-, I- or Br- decreases the rate of VRAC inactivation in M-1 duct cells [13, 26]. The effects of cations on inactivation cannot be explained by invoking an alteration in surface potential since this would cause the inactivation-voltage curve to be shifted towards positive voltages as the cation concentration increase. Yet, it has been demonstrated that a decrease in extracellular pH or increase in Mg2+ concentration results in either a negative shift or no change [26]. Interestingly, both cations and anions affect inactivation only at positive voltages. This could be due to a voltage-dependent interaction between the ions and the channel protein; however, in the case of cations this mechanism would require an enormous amount of energy since the cations will have to overcome a positive field in order to interact with the channel inside the membrane electrical field.
Therefore, it seems H+, Mg2+, and Cl- ions all affect IClVol inactivation through different mechanisms. One possibility is that those mechanisms are different because the ions involved bind to distinct sites on the channel. Thus, to understand how H+ and Cl- regulate the inactivation process in IClVol we studied IClVol decay in two different mammalian cell lines that display distinct degree of inactivation. Our data show that in HEK-293 cells, IClVol decay is facilitated by external acidification and by an increase in the intracellular [Cl-]. The enhancement of inactivation by acidification of the external media was largely attenuated by decreasing the [Cl-]. In contrast, IClVol from human promyelocitic HL-60 cells did not show decay in the presence of 140 mM Cl- even at +120 mV, instead a slight inactivation was induced by external acidification. Our experimental and analytical results indicate that the mechanism of IClVol decay is not solely voltage-dependent but includes the concerted action of anions and protons.
Material and Methods
Cell Culture
HEK-293H cells obtained from Invitrogen (Carlsbad, CA) were maintained at 37°C in a 95% O2/5% CO2 atmosphere in Dulbecco's Modified Eagle Medium (DMEM from GIBCO; Carlsbad, CA), supplemented with 10% Fetal Bovine Serum (FBS), 5.5mM Sodium Piruvate and 500 μl gentamicin (GIBCO; 10 mg/ml). Cells were grown to 80-90% confluence and later detached using 0.1% Trypsin (GIBCO) in a Ca2+ and Mg2+-free Hank's balanced salt solution (HBSS 1X from GIBCO). The HBSS contained (in mM): 137.9 NaCl, 5.3 KCl, 0.4 KH2PO4, 4.2 NaHCO3, 0.3 Na2HPO4, 5.5 D-Glucose and pH= 7.0-7.4. After trypsin treatment, cells were plated onto 5 mm diameter ethanol-washed coverslips and allowed to attach for the next 16 hr. A single coverslip was placed into the recording chamber (∼300 μl volume) and cells were washed with isotonic external media before patch clamping.
Human promyelocytic leukemia HL-60 cells (Invitrogen, Carlsbad, CA) were cultured in suspension using 25 or 75 cm2 flasks. The cells were maintained at 37°C in a 95% O2/5% CO2 atmosphere using RPMI 1640 medium (GIBCO) supplemented with 10% Fetal Bovine Serum (FBS; Hyclone, Logan, UT, USA) and 500 μl gentamicin (10 mg/ml, GIBCO). A cell sample was dropped onto a 5 mm diameter ethanol-washed coverslip previously placed in the recording chamber. Cells were allowed to attach to the glass for 10-20 minutes before they were washed with isotonic external media and used for the experiment.
Reverse transcription polymerase chain reaction (RT-PCR) analysis of TMEM16A and ClC-3
Total RNA was isolated from HL-60 and HEK-293 cells using the Trizol reagent (Invitrogen). RNA samples were quantified using UV spectroscopy. Total RNA was treated with DNase I to remove trace amounts of genomic DNA and subsequently used in the reverse transcription reaction. The cDNA obtained was used as template for a PCR reaction carried out using the GeneAmp PCR system 9700 (Applied Biosystems). Primers for ClC-3 (AF172729.1) were 5′ 1691TCGGGGCTGATTGCATTACACCT1713 3′ (sense) and 5′ 2198CACACCCGAGAACTGCCAACGATA2175 3′ (antisense) and for TMEM16A (NM_018043.4) were 5′ 2194GTTTGGCTTCGTCACCCTGTTTGT2217 3′ (sense) and 5′ 2603ACGGCGGCTCTCGGTAGTCTTTA2581 3′ (antisense). Expression of the housekeeping gene transcript glyceraldehyde 3-phosphate dehydrogenase (GAPDH) was used as positive control. The predicted length for each PCR product was 508 bp for ClC3, 410 bp for TMEM16A, and 457 bp for GAPDH.
Recording solutions
External hypotonic solution contained (in mM): 139 TEACl, 0.5 CaCl2, 20 HEPES; pH=7.3 with TEA-OH (292 ± 5 mOsm/kg). This hypotonic solution was used to prepare both isotonic and hypertonic solutions by adding D-mannitol. Acidic and alkaline external solutions were prepared using 20 mM MES or Bicine as pH buffers, respectively. The standard internal solution contained (in mM): 140 TEACl, 20 EGTA, 20 HEPES; pH=7.3 with TEA-OH (364 mOsm/kg). These solutions were modified by adding 20 mM MOPS or 20 mM TES instead of 20 mM HEPES to test the effects of pH buffers on channel kinetics and inactivation. Table 1 shows the composition, pH, [Cl-] and tonicity of all solutions used in this study. Tonicity values were determined using the freezing point method (VAPRO, Wescor). All chemical were purchased from Sigma-Aldrich Co., St. Louis, MO, USA.
Table 1. Composition, pH and osmolarities of internal and external solutions.
Internal solutions are labeled with subscript i. External solutions are labeled with subscript e1, e2 and e3 that stand for hypotonic, isotonic and hypertonic bathing solutions, respectively.
| Solution | Composition (mM) | pH | Osmolality (mOsm/Kg) | ||||
|---|---|---|---|---|---|---|---|
| TEACl | EGTA | CaCl2·2H2O | D- Mannitol | Buffer (20 mM) | |||
| Ai | 140 | 20 | 0.0 | 0.0 | HEPES | 7.3 | 355.0 ± 5.0 |
| Ae1 | 139 | 0.0 | 0.5 | 0.0 | HEPES | 7.3 | 292± 5.0 |
| Ae2 | 139 | 0.0 | 0.5 | 90 | HEPES | 7.3 | 375± 5.0 |
| Ae3 | 139 | 0.0 | 0.5 | 110 | HEPES | 7.3 | 393± 5.0 |
| Bi | 140 | 20 | 0.0 | 0.0 | MOPS | 7.3 | 353 |
| Be1 | 139 | 0.0 | 0.5 | 0.0 | MOPS | 7.3 | 287 |
| Be2 | 139 | 0.0 | 0.5 | 90 | MOPS | 7.3 | 387 |
| Be3 | 139 | 0.0 | 0.5 | 110 | MOPS | 7.3 | 401 |
| Ci | 140 | 20 | 0.0 | 0.0 | TES | 7.3 | 361 |
| Ce1 | 139 | 0.0 | 0.5 | 0.0 | TES | 7.3 | 286 |
| Ce2 | 139 | 0.0 | 0.5 | 90 | TES | 7.3 | 377 |
| Ce3 | 139 | 0.0 | 0.5 | 110 | TES | 7.3 | 406 |
| Di | 140 | 20 | 0.0 | 0.0 | MES | 5.5 | 355 |
| De1 | 139 | 0.0 | 0.5 | 0.0 | MES | 5.5 | 283 |
| De2 | 139 | 0.0 | 0.5 | 90 | MES | 5.5 | 370 |
| De3 | 139 | 0.0 | 0.5 | 110 | MES | 5.5 | 390 |
| Ei | 140 | 20 | 0.0 | 0.0 | BICINE | 9.0 | 355 |
| Ee1 | 139 | 0.0 | 0.5 | 0.0 | BICINE | 9.0 | 283 |
| Ee2 | 139 | 0.0 | 0.5 | 90 | BICINE | 9.0 | 370 |
| Ee3 | 139 | 0.0 | 0.5 | 110 | BICINE | 9.0 | 390 |
| Fi | 70 | 20 | 0.0 | 0.0 | HEPES | 7.3 | 217 |
| Fe1 | 69 | 0.0 | 0.5 | 0.0 | HEPES | 7.3 | 119 |
| Fe2 | 69 | 0.0 | 0.5 | 90 | HEPES | 7.3 | 228 |
| Fe3 | 69 | 0.0 | 0.5 | 110 | HEPES | 7.3 | 245 |
| Gi | 25 | 20 | 0.0 | 0.0 | HEPES | 7.3 | 133 |
| Ge1 | 24 | 0.0 | 0.5 | 0.0 | HEPES | 7.3 | 64 |
| Ge2 | 24 | 0.0 | 0.5 | 90 | HEPES | 7.3 | 139 |
| Ge3 | 24 | 0.0 | 0.5 | 110 | HEPES | 7.3 | 162 |
| Ge4 | 24 | 0.0 | 0.5 | 0.0 | MES | 5.5 | 67 |
| Ge5 | 24 | 0.0 | 0.5 | 0.0 | BICINE | 9.0 | 65 |
| Hi | 200 | 20 | 0.0 | 0.0 | HEPES | 7.3 | 419 |
| He1 | 199 | 0.0 | 0.5 | 0.0 | HEPES | 7.3 | 470 |
| He2 | 199 | 0.0 | 0.5 | 90 | HEPES | 7.3 | 556 |
| He3 | 199 | 0.0 | 0.5 | 110 | HEPES | 7.3 | 568 |
| Ie1 | 24 | 0.0 | 0.5 | 200 | MES | 5.5 | 285±5.0 |
| Ie2 | 24 | 0.0 | 0.5 | 200 | HEPES | 7.3 | 287±5.0 |
| Ie3 | 24 | 0.0 | 0.5 | 200 | BICINE | 9.0 | 285±5.0 |
| Ji | 69 | 20 | 0.0 | 200 | HEPES | 7.3 | 361 |
| Ki | 25 | 20 | 0.0 | 270 | HEPES | 7.3 | 352 |
Electrophysiological Recordings
Whole-cell currents were recorded using an Axopatch 200B amplifier and the pClamp 8 software (Molecular Devices; Sunnyvale, CA, USA). Cells were patched using glass electrodes fabricated with Corning 8161 glass (Warner Instruments, Hamdem, CT) which had a resistance of 2-4 MΩ when filled with standard internal solution. The recording chamber was grounded using an agar bridge filled with 3 M KCl. VRAC were activated by cell swelling induced after exposure to a hypotonic solution. IClVol was recorded from −80 to +120 mV in 20 mV increments using voltage clamp steps delivered every 6 s from a the holding potential of 0 mV. Currents were filtered at 2 KHz using a built-in 8 db/decade Bessel filter and then sampled at 5 KHz. Off-line analysis was done using Clampfit (Molecular Devices) as well as Origin software (OriginLab Corporation, Northampton, MA). All experiments were performed at room temperature (21-23°C).
Analysis
The absolute IClVol magnitude at the end of the voltage steps was normalized using the current magnitude measured at −80 mV, a voltage where the current-voltage relationship (I-V) was linear. Individual I-V curves were averaged and then plotted. The fraction of current decay due to H+ or Cl- ions is referred to as the fraction of inactivated channels (FIC) and was computed as follows:
| Equation 1 |
where Ipeak and Isust are current magnitudes measured at the beginning and at the end of the test pulse, respectively. FIC versus Vm curves were fit using a Boltzmann function (Equation 2)
| Equation 2 |
where FICmax and FICmin are the maximum and minimum FIC values, respectively, z is the apparent charge, F the Faraday constant, R the gas constant, T the temperature and V0.5 is the Vm needed to reach (FICmax+FICmin)/2. Macroscopic time constants of current decay were calculated by fitting raw current traces with a bi-exponential function:
| Equation 3 |
were τ1 and τ2 are the time constants, A, B and C are relative contributions of each component to the current decay. Current simulations were performed using the program IonChannelLab (http://www.jadesantiago.com/Electrophysiology/IonChannelLab/) developed in our laboratory.
Data are presented as mean ± SEM and n represents the number of cells tested.
Results
Volume-Regulated Chloride Currents in HEK-293 and HL-60 Cells
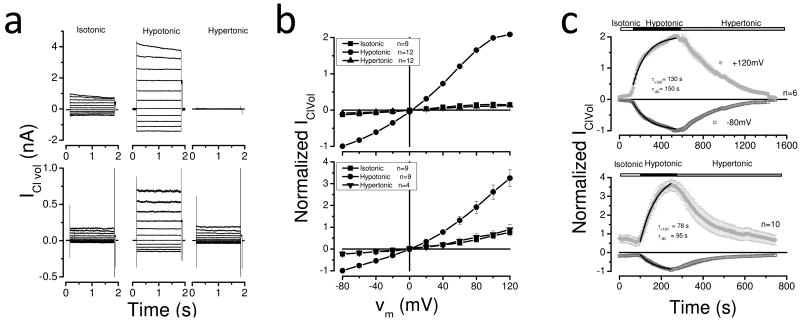
To characterize the effects of Cl- and H+ ions on the decay of whole cell chloride current (IClVol) through volume regulated anion channels (VRAC) we used HEK-293 cells (a human embryonic kidney cell line widely used for heterologous expression of ion channels) representative of non-blood cells, and HL-60 cells (a promyelocytic human leukemic cell line) as model for blood cells. In both cell types VRAC were activated by a hypotonic challenge. Fig. 1a shows IClVol from HEK-293 cells (upper panel) or HL-60 cells (lower panel) dialyzed and bathed with standard solutions containing 140 mM Cl- and pH adjusted to 7.3. Throughout this study, we will refer to these conditions as control conditions. Raw currents recorded from the same cells under isotonic (left), hypotonic (center) and hypertonic (right) conditions are displayed. Currents were quite small under isotonic conditions (365 mosm/kg). Upon exposure to a hypotonic media (286 mosm/kg) the current increased at all membrane potentials (Vm). At negative Vm, currents from both cell types were time-independent. In contrast, at positive Vm the current rapidly decayed in HEK-293 cells but not in HL-60 cells. The IClVol decay has been referred to as inactivation and is the focus of this study. Subsequent exposure to a hypertonic media (385-392 mosm/kg) reversed the current to levels comparable to or below those observed under isotonic conditions. Current-voltage (I-V) relationships obtained under these conditions are depicted in Fig. 1b. To compare different cells, we normalized IClVol using the current magnitude obtained at -80 mV under hypotonic condition and then averaged those values. The data show that IClVol increased 2-3-fold under hypotonic condition and that this enhancement was abolished under hypertonic conditions. Furthermore, I-V curves from both cells show the characteristic slight outward rectification previously described in other preparations [3-5, 15, 20, 21]. In addition, the I-V curve from HEK-293 cells under hypotonic condition plateaus at positive Vm. Fig. 1c shows time courses for channel activation at +120 or -80 mV. VRAC from HEK-293 cells (upper panel) activated slower than those from HL-60 cells (lower panel). Time courses were fit with a mono-exponential function to estimate the corresponding time constant of channel activation. At +120 mV, VRAC were activated with time constants of 130 and 78 s in HEK-293 and HL-60 cells, respectively. Similar results were obtained at -80 mV (see insets).
Fig. 1. Activation of volume-regulated chloride channels in HEK-293 and HL-60 cells by a hypotonic solution.
a Raw traces obtained from individual HEK-293 (upper raw) and HL-60 (lower raw) cells sequentially exposed to isotonic (left), hypotonic (middle) and hypertonic (right) media. Voltage steps between -80 and +120 mV in 20 mV increments delivered from a holding voltage of 0 mV were used to elicit currents. b I-V relationships from HEK-293 (upper) or HL-60 (lower) cells under isotonic (black boxes), hypotonic (black circles) and hypertonic (black triangles) conditions. c Time course of IClVol activation in HEK-293 cells (upper; n=6) or HL-60 (lower, n=10) cells at +120 or -80 mV. The sequential order of perifused solutions is indicated by upper bars. Continuous black lines on top of symbols are mono-exponential fits used to estimate activation time constants (inserted). In b and c, IClVol amplitude was normalized using the current measured at -80 mV under hypotonic conditions. Experimental conditions included [Cl-]i = [Cl-]e =140 mM and pHi = pHe = 7.3 (solutions Ai, Ae1, Ae2 and Ae3).
Although the molecular identity of VRAC remains unknown several candidates have been proposed, among those TMEM16A (a Ca2+-activated Cl- channel also known as anoctacmin 1) and the ClC-3 protein [1,6-8]. Thus, we looked for the expression of both TMEM16A and ClC-3 transcripts in HEK-293 and HL-60 cells. In Fig. 2, RT-PCR experiments show that mRNA for ClC-3 is present in HEK-293 and HL-60 cells (lanes 2 and 6). Interestingly, mRNA for TMEM16A was only detected in HEK-293 cells (lane 1) as previously shown (see reference 1 for further details on characterization of TMEM16A in HEK cells). This suggests that TMEM16A is not related to VRAC in HL-60 cells.
Fig. 2. RT-PCR analysis of TMEM16A (NM_018043.4) and ClC-3 (AF172729.1) transcripts in HEK-293 (lanes 1-3) and in HL-60 (lanes 5-7) cells.
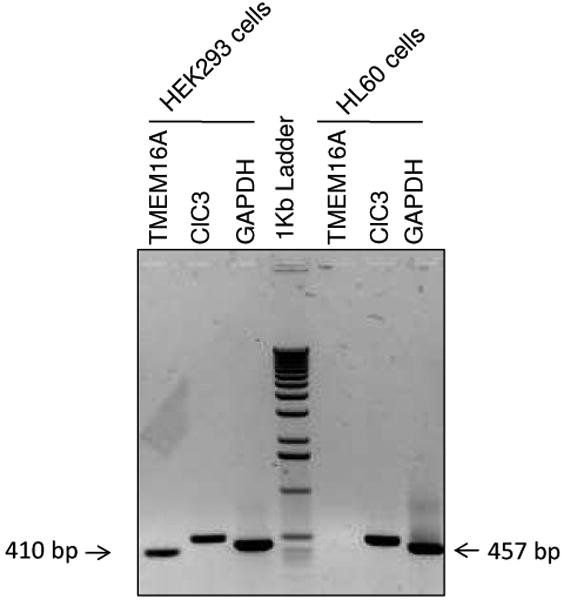
Lanes 1 and 5: TMEM16A. Lanes 2 and 6: ClC-3. Lane 3 and 7: GAPDH, positive control. Lane 4: 1Kb DNA ladder. The expected length of the PCR products was 410 bp for TMEM16A, 508 bp for ClC3 and 457 bp for GAPDH. Experiments were carried out by triplicate.
Cl--Dependent IClVol Decay
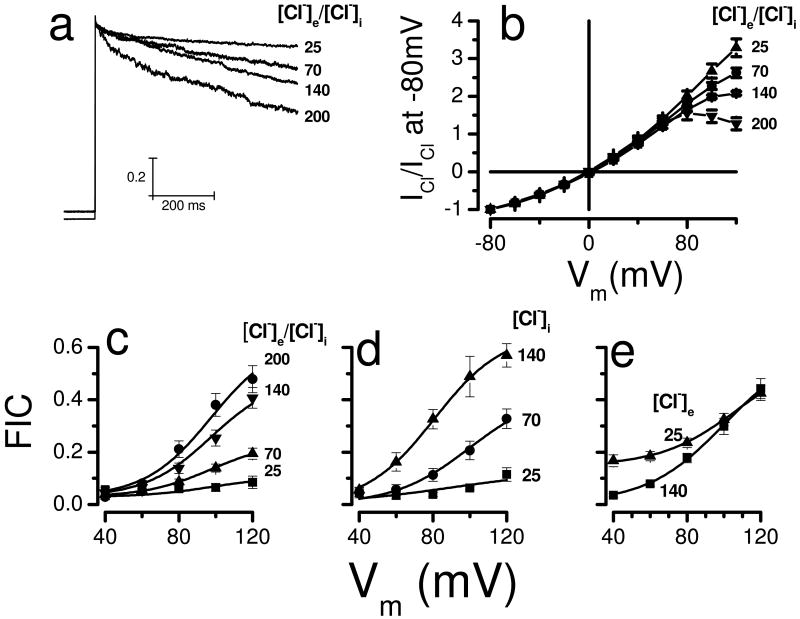
To understand how chloride induces IClVol decay in HEK-293 cells we carried out experiments changing the intracellular and extracellular [Cl-]. Fig. 3a shows IClVol recordings at +120 mV obtained from four different cells dialyzed and bathed with solutions containing 25, 70, 140 or 200 mM [Cl-]. A larger IClVol decay was observed when the [Cl-] was higher. As the [Cl-] increased the I-V curves became less linear (Fig. 3b) and the fraction of inactivated channels (FIC) increased at positive Vm (Fig. 3c). In consequence, at +120 mV the FIC value was 0.48±0.05 with 200 mM Cl- but decreased to 0.08±0.02 when [Cl-] was reduced to 25 mM. Next, we determined the relative contribution of internal and external Cl- to IClVol decay by separately changing the [Cl-] while keeping the pH= 7.3 on both sides of the membrane. When [Cl-]i was decreased from 140 mM to 70 and then to 25 mM in separate cells (Fig. 3d), the FIC at +120 mV decreased in a similar manner from 0.57±0.04 to 0.33±0.04 to 0.11±0.03, respectively. This result resembled that obtained when [Cl-] was decreased in a symmetric fashion (Fig. 3c). In contrast, reducing [Cl-]e from 140 to 25 mM slightly increased FIC at potentials between +40 to +60 mV but not between +80 to +120 mV (Fig. 3e). The FIC data were analyzed using a Boltzmann equation (Equation 2). Data shown in Fig. 3c were fit using an apparent gating charge z=1.4 and a V0.5=97 mV (continuous lines), where V0.5 is the voltage needed to reach half FIC. Similarly, data show in Fig. 3d were fit with z=1.4 and V0.5 value that ranged between 80 to 100 mV (continuous lines).
Fig. 3. Effect of [Cl-] on ICl,Vol decay in HEK-293 cells.
a Normalized IClVol recorded at +120 mV from 4 different cells bathed and dialyzed with solutions containing 25, 70, 140 and 200 mM Cl-. Hypotonic solutions used to activate IClVol were prepared by removing D-mannitol from the corresponding isotonic solutions. b Normalized I-V relationships at the indicated [Cl]. IClVol magnitudes were measured at the end of each voltage step and normalized to the IClVol magnitude measured at -80 mV. c FIC vs Vm curves as a function of [Cl-]i = [Cl-]e = 200 (black circles, n=6), 140 (down triangles, n=12), 70 (up triangles, n=10) and 25 mM (black boxes, n=4). Solutions used in panels a, b and c were Ai, Ae1, Ae2, Ae3, Fi, Fe1, Fe2, Fe3, Gi, Ge1, Ge2, Ge3, Hi, He1, He2 and He3. d FIC vs Vm curves as a function of [Cl-]i (140mM, up triangles, n=15; 70 mM, black circles, n=9, or 25 mM, black boxes, n=6) when [Cl-]e was 140 mM. Continuous lines are fits with equation 2. Solutions used: Ai, Ae1,Ji and Ki. e Curves of FIC vs Vm at [Cl-]e of 140 (black boxes, n=12) or 25 mM (up triangles, n=9). In all cases [Cl-]i was 140 mM while pHi = pHe = 7.3 (solutions Ai, Ae1 and Ie2).
H+-Dependent IClVol Decay
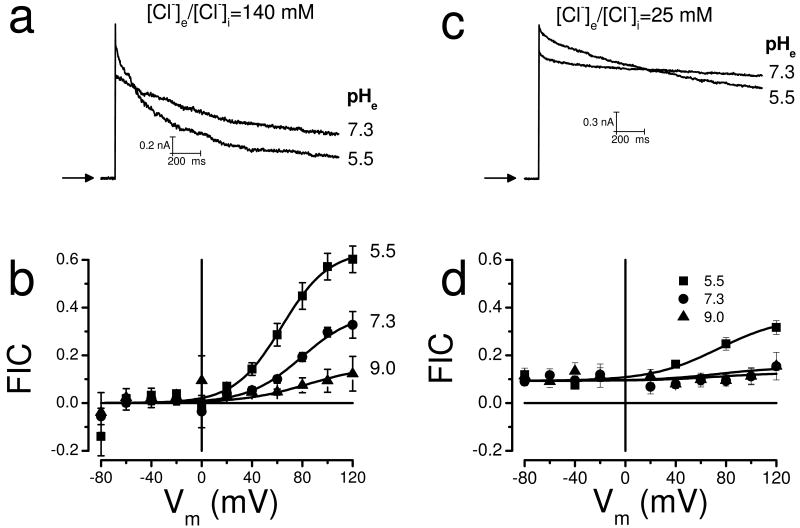
Previous work on cultured cells reported that external H+ modulates IClVol decay [23, 26]. To further understand the modulatory effect of H+ ions, we assayed the effect of H+ on IClVol decay by varying the external pH between 5.5 and 9. Fig. 4a shows raw IClVol traces recorded at +120 mV from a HEK-293 cell dialyzed with the standard internal solution containing 140 mM Cl- and bathed in a hypotonic solution containing 140 mM Cl- whose pH was adjusted to 7.3 or 5.5. In this experiment FIC increased from 0.57 to 0.84 but on average the FIC increased from 0.33±0.05 when pHe was 7.3 (n=58) to 0.60±0.05 when pHe was 5.5 (n=13). In addition, IClVol decayed faster in cells bathed in an acidic media. Fitting IClVol with a double exponential function (equation 3) gave fast and slow time constants whose values were 134±44 and 2197±457 ms at pH= 7.3, while at pH= 5.5 these values became 104±31 and 534±55 ms. Fig. 4b depicts FIC as a function of Vm at pH 5.5, 7.3 and 9. Therefore, FIC increased as the Vm became positive and as the pHe became acidic. At pHe 9.0, the inactivation was nearly abolished. The Vm-dependent effects of H+ on IClVol decay were fit with equation 2 (continuous lines in Fig. 4b) using z=1.25 and V0.5= 78 or 65 mV for pH=7.3 or 5.5 and 9.0.
Fig. 4. pHe effects on ICl,Vol decay in HEK-293 cells show [Cl-]-dependence.
a Raw IClVol traces recorded at +120 mV from the same cell dialyzed and bathed in solutions containing 140 mM Cl- whose pHe was adjusted to 7.3 or to 5.5 (solutions Ai,Ae1,De1). pHi was 7.3. b Curves of FIC vs Vm as a function of pHe (5.5, n=13; 7.3, n=23 and 9.0, n=10). Continuous lines are fits with equation 2. Solutions used: Ai, Ae1, De1, Ee1. c Raw IClVol traces recorded at +120 mV from the same cell bathed and dialyzed with solutions containing 25 mM Cl- whose pHe was adjusted to 7.3 or to 5.5 (solutions Gi, Ge1 and Ge4). d FIC vs Vm curves as a function of pHe of 5.5 (black boxes, n=14), 7.3 (black circles, n=21) and 9.0 (black triangles, n=7). Solutions used: Gi, Ge1, Ge4 and Ge5.
It is known that HEPES buffer but not TES, inhibits the outwardly rectifying anion channel [10]. Since the pH of our experimental solutions was buffered with HEPES, we tested whether the IClVol decay could be related to channel block by HEPES. To this end we prepared internal and external solutions (isotonic, hypotonic and hypertonic) containing 140 mM Cl- and pH buffered to 7.3 with either 20 mM HEPES, 20 mM MOPS or 20 mM TES (solutions Ai, Ae1, Ae2, Ae3, Bi, Be1, Be2, Be3, Ci, Ce1, Ce2 and Ce3; see Table 1). IClVol was recorded at +120 mV from HEK-293 cells consecutively bathed in isotonic, hypotonic and hypertonic solutions. FIC values determined as described above were 0.55±0.05, 0.53±0.04 and 0.52±0.06 with HEPES (n=6), MOPS (n=7) and TES (n=7), respectively. The corresponding fast/slow time constants of inactivation were 315±70/1571±225, 225±66/1329±139 and 126±18/1510±179 ms. Thus, IClVol decay in HEK cells was not affected by the pH buffer used.
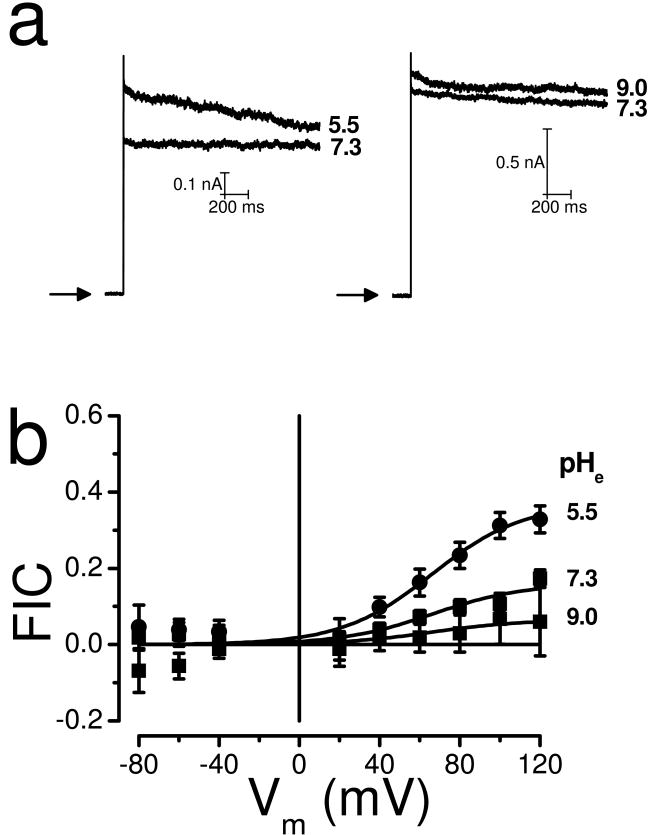
In other Cl- channels, such as ClC-type channels the H+ effect on gating is influenced by the [Cl-] [17]. To determine whether or not the H+ effects on IClVol decay were also dependent on [Cl-], the cells were dialyzed and bathed in solutions containing only 25 mM Cl-. This condition blunts the Cl--dependent inactivation (Fig. 3c) and should unmask the H+-dependent inactivation. Fig. 4c shows raw IClVol obtained at +120 mV from a cell bathed in a solution containing 25 mM [Cl-] with pH 7.3 that was changed to a solution with pH 5.5. IClVol showed little decay at pHe= 7.3, however, a larger decay was apparent at pHe= 5.5. The results are summarized in Fig. 4d, where FIC values obtained at pHe= 5.5, 7.3 and 9.0 are plotted as a function of Vm. The maximum FIC value at pHe 5.5 was 0.36 while no difference was observed when pHe was 7.3 or 9.0. From fitting the data with equation 2, a z value of 0.95 was estimated. Therefore in HEK-293 cells increasing the [H+]e under low [Cl-] enhances VRAC inactivation. Since in HL-60 cells IClVol did not decay with 140 mM Cl- (Fig. 1a) we used this condition to further analyze the effects of external H+ on IClVol decay. Fig. 5a shows raw current traces recorded at +120 mV from HL-60 cells exposed to pH 7.3 and then pH 5.5 (left) or 7.3 and then 9.0 (right). Low pHe induced slight inactivation while pH 9.0 did not. Fig. 5b summarizes our findings. Fitting the data with equation 2 we estimated an apparent gating charge of z=1.1 and a maximum FIC value of 0.37. Comparatively, pHe 5.5 induced less inactivation in HL-60 cells than in HEK-293 cells.
Fig. 5. Effect of pHe on IClVol from HL-60 cells.
a Raw IClVol traces obtained at +120 mV from two different cells sequentially bathed with solutions whose pH were 7.3 and 5.5 (left) or 7.3 and 9.0 (right). b Curves of FIC vs Vm at the indicated pHe. In all cases [Cl-]i= [Cl-]e= 140 mM and pHi= 7.3 (solutions Ai, Ae1, De1 and Ee1). The total number of experiments was 9, 20 and 8 for solutions with pHe 5.5, 7.3 and 9.0, respectively. Continuous lines are fits with equation 2
Effect of external Cl- ions on IClVol at pHe 9.0
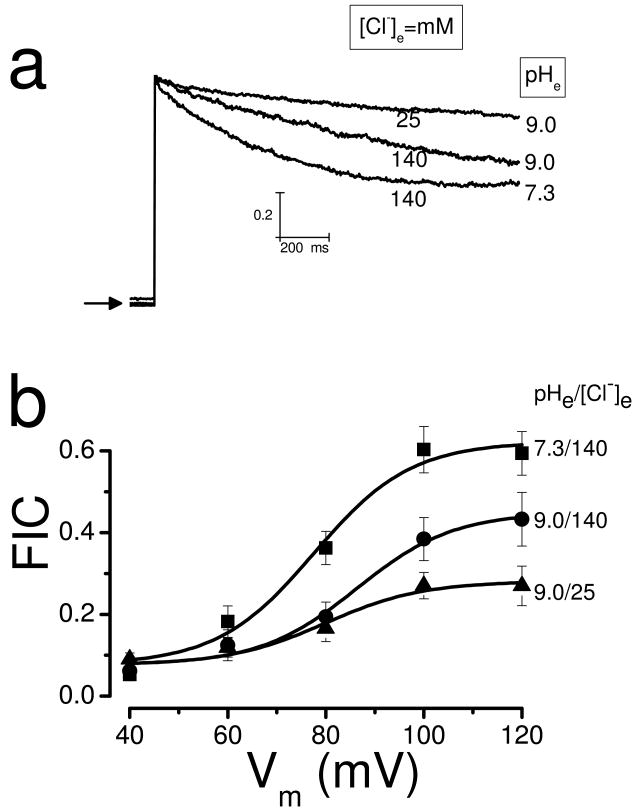
Alkaline pHe nearly abolished IClVol inactivation in HEK-293 cells even when the [Cl-] on both sides of the membrane was 140 mM (Fig. 4b). Thus, we re-examined the role of external Cl- ions on inactivation under alkaline conditions to minimize the contribution of the pHe. Fig. 6a shows raw IClVol recorded from the same cell exposed to a hypotonic solution containing initially 140 mM Cl- on both sides of the membrane and pH= 7.3. Under this condition, IClVol decayed approximately 45%. When the pHe was increased to 9.0, there was a reduction on current decay. Additionally, IClVol decayed even less when the [Cl-]e was reduced from 140 to 25 while keeping the pHe at 9.0. Fig. 6b shows FIC vs Vm curves that summarize the effects of simultaneously increasing pHe and decreasing [Cl-]e on inactivation. Increasing pHe from 7.3 to 9.0 decreased FIC at all Vm. Decreasing [Cl-]e from 140 to 25 further decreased FIC at positive Vm. Continuous lines are fits with equation 2 using z=2.53 and V0.5 values between 77 and 86 mV. Maximum FIC obtained from the fit were 0.62, 0.45 and 0.28 when pHe/[Cl-]e were 7.3/140, 9.0/140 and 9.0/25, respectively.
Fig. 6. Effect of low [Cl-]e on IClVol decay in HEK-293 cells bathed in alkaline media.
a Raw IClVol traces recorded at + 120 mV from the same cell exposed to hypotonic solutions containing 140 mM Cl- and pH = 7.3, 140 mM Cl- and pH = 9.0 and 25 mM Cl- and pH = 9.0. b Curves of FIC vs Vm as a function of pHe/[Cl-]e = 7.3/140mM (black circle), 9.0/140 mM (black boxes) and 9.0/25 (black triangles) are shown (solutions Ai, Ae1, Ee1 and Ie3). In all experiments [Cl-]i = 140 mM, pHi = 7.3 and n=11
Kinetic Model
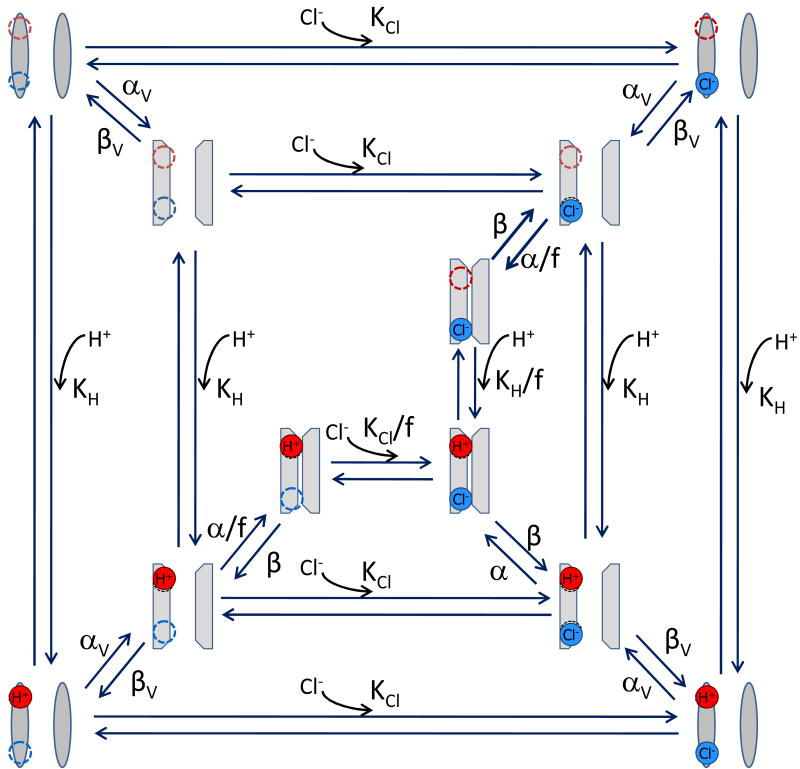
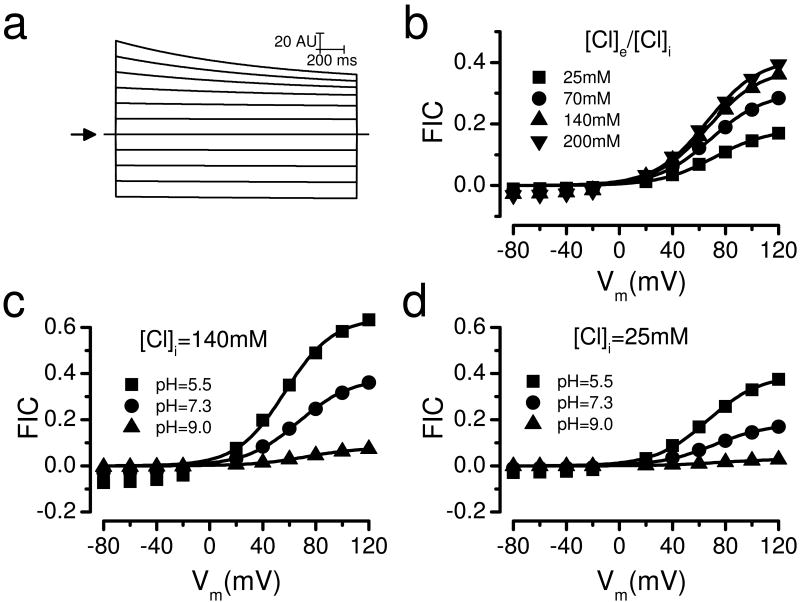
The data shown in Fig. 3 suggest that intracellular Cl- ions interact with the channel to facilitate Vm-dependent inactivation. In addition, Fig. 4 and 5 show that H+ have effects on IClVol decay too and those effects are concentration- and Vm-dependent, just as the effects of [Cl-]i. The fact that the H+ effects were largely diminished by lowering [Cl-] (Fig. 4c,d) suggests that both effects are coupled. Based in these observations we tried to represent the effects of internal Cl- and external H+ on IClVol decay (Fig. 7) using a kinetic model. This model assumed the existence of external and internal binding sites (upper left corner, dash circles) for the H+ (red circle) and Cl- (blue circle) ions. The interactions between the protein and the ions are described by the equilibrium constants KH and KCl, respectively. Since our data show that an increase in [H+]e and [Cl-]i produce enhancement as well as acceleration of IClVol decay, our model assumes that binding of H+ and Cl- ions (Fig. 7, outer layer) to the channel facilitate IClVol decay. If the ion binding sites are located within the electrical field, then negative Vm would increase occupancy of the sites by attracting H+ and pushing Cl- into the pore whereas positive Vm would reduce occupancy by repelling H+ and keeping Cl- in the citosol. Thus, a negative electric field would induce a large FIC and a positive electric field would induce a small FIC, however, the opposite was observed in our experiments. For that reason, we propose that both binding sites are outside the electrical field, therefore KCl and KH can be Vm-independent. The idea of Vm-independent external binding sites has already been postulated by Nilius and co-workers based on their own experimental observations [16, 26]. Our data show that FIC was Vm-dependent, thus we introduced the voltage dependence of inactivation in the model by including two Vm-dependent rate constants: αv and βv These rate constants are associated with transitions that connect two unknown conformational states shown in the outer and central layers of the model (Fig. 7). Thus, in the model we assume that the role of chlorination and protonation is to induce a conformational change from where an additional Vm-dependent rearrangement leads the channel to states prompt to inactivate (central layer). Previously, it was proposed that occupancy of a site within the VRAC pore might prevent channel closing [26]. To incorporate this idea in our model, we represented a fully inactivated channel as an empty, collapsed pore with one H+ and one Cl- bound (third layer). The parameter values that describe the transitions between states (listed in Table 2) were estimated by trial and error and finally adjusted during the simulation procedure. Simulations of whole cell currents using our model are displayed in Fig. 8. The model qualitatively reproduced: IClVol time course at different Vm (Fig. 8a), FIC vs Vm at different [Cl-]i (Fig. 8b), the FIC vs Vm at various pHe with [Cl-]i = 140 mM (Fig. 8c) and FIC vs Vm at various pHe with [Cl-]i = 25 mM (Fig. 8d). Data show in Fig. 8b, 8c and 8d were fit with equation 2. The resulting z and V0.5 values are compared in Table 3 with those obtained from fitting our experimental data collected under diverse ionic conditions.
Fig. 7. A kinetic model to describe VRAC inactivation.
This model is based on the dependence of FIC with the [H+]e and [Cl-]i. Dash circles are external and internal binding sites for H+ (red circle) and Cl- (blue circle), respectively. An open channel conformation can be reached when both binding sites are occupied (lower right corner of outer layer) but if this is followed by a Vm-dependent conformational change characterized by rate constants αv and βv then the channel inactivates. Inactivation states (inner most layer) are represented by a collapsed pore with either one or both binding sites occupied. Here, KH and KCl are the equilibrium constant for binding of H+ and Cl-, respectively. f is a scale factor
Table 2. Parameters used for the kinetic model.
Table lists the parameters used for the simulations shown in Fig. 8. Each value was estimated by trial and error.
| Parameter | Value or Expression |
|---|---|
| KCl | 100mM |
| pK | 7 |
| α | 2 s-1 |
| β | 0.4 s-1 |
| βv/αv | 20*Exp(-1.0*VF/RT) |
| f | 20 |
Fig. 8. Simulation of IClVol time course and ion-dependence of IClVol decay.
a Time course of IClVol between -80 and +120 mV was simulated using the model shown in Fig. 7 and the rate constants listed in Table 2. b FIC vs Vm curves as a function of [Cl-]i (25, 70, 140 and 200mM) were also simulated. Continuous lines are fits with equation 2 using z=1.43. c and d: Simulations of FIC vs Vm as a function of pHe (5.5, 7.3, and 9.0) and [Cl-]i (140 mM, c or 25 mM, d). Continuous lines are fits with equation 2 using z=1.53 and 1.44 for 140 and 25 mM [Cl-]i, respectively
Table 3. Comparison of z and V0.5 values obtained from fitting experimental and simulated data.
Ionic conditions are indicated in the left column. Statistical differences were evaluated using one way ANOVA with p<0.5. z values were statistical different when [Cl-] decreased from 140 or 70 to 25 mM but not when decreased from 140 to 70 mM. Also z values were different when the pH was varied between 5.5, 7.3 and 9. V0.5 values were not different when [Cl-] was decreased from 140 or 70 to 25 mM but were different by decreasing [Cl-] from 140 to 70 mM. No statistical differences were found in V0.5 when pH was decreased to 5.5 or increased to 9. In contrast V0.5 values were different when compared pH 9 and 5.5. Values given are mean±SDM.
| Experiment | Simulation | |||
|---|---|---|---|---|
| Ionic condition | z | V0.5 (mV) | z | V0.5 (mV) |
| [Cl]i=140, [Cl]e=140, pH=7.3 | 1.34±0.09 | 80.8±8.1 | 1.26 | 66.9 |
| [Cl]i=70, [Cl]e=140, pH=7.3 | 1.21±0.14 | 100.0±10.8 | 1.24 | 68.9 |
| [Cl]i=25, [Cl]e=140, pH=7.3 | 0.76± 0.29 | 89.8±12.3 | 1.22 | 71.5 |
| pH=5.5, [Cl]i=[Cl]e=140 | 1.33±0.11 | 63.5±8. | 1.37 | 56.6 |
| pH=7.3, [Cl]i=[Cl]e=140 | 1.17±0.11 | 79.3±11.4 | 1.26 | 66.9 |
| pH=9, [Cl]i=[Cl]e=140 | 0.95±0.42 | 85.1±17.0 | 1.21 | 73.3 |
Discussion
VRAC channels have been functionally identified in all mammalian cells. A prominent property is their lack of or little voltage-dependence, as well as I-V relationships that display slight outward rectification in some cell types [15, 18]. At depolarized voltages VRAC currents show a time-dependent decay in non-blood cells which has been associated with an “inactivation” process [18]. Unlike the classical inactivation of voltage-gated Na+ or K+ channels, inactivation in VRAC may be triggered initially by ions and subsequently by voltage. In this work, we have explored the role of H+ and Cl- ions as causal agents for voltage-dependent inactivation in VRAC.
Our findings extend previous observations in BC3H1 myoblasts which showed that low pHe accelerates VRAC inactivation with only a marginal effect on current amplitude [26]. Later it was demonstrated that in CEPAE cells the unitary current amplitude is increased by low pHe which could account for the increase in whole-cell current but could not explain the increase on the rate of inactivation [19]. Our results are in agreement with the observation that an increased external [H+] accelerates current decay and produces a slight increase in current amplitude. In addition, we show here that an acidic pHe is able to increase the fraction of inactivated channels when symmetrical [Cl-] is high. However, our data also show that decreasing the [Cl-]i drastically diminishes inactivation regardless of the [Cl-]e, thus suggesting that internal Cl- ions have a dominant role in VRAC inactivation.
It is interesting to note that VRAC from HEK-293 cells are functionally different from VRAC native to HL-60 cells. VRAC from HL-60 cells as well as those from human neutrophils and T lymphocytes display little current decay [12, 20, 25]. In agreement with these reports we observed very little decay in HL-60 cells even when the pHe was decreased to 5.5 (intracellular Cl- was 140 mM). Moreover, the degree of IClVol decay was similar to that observed in HEK-293 cells recorded in symmetrical 25 mM Cl-. Thus, it seems as if VRAC from HL-60 cells lack inactivation due to intracellular Cl-. This observation and the fact that the single channel conductance of VRAC from blood cells is smaller than that of other mammalian cells [15] might indicate that these two channels are encoded by different, yet unknown,molecular entities. Since our results indicate that HEK-293 and HL-60 cells express the ClC-3 mRNA and that ablation of ClC-3 did not eliminated the hypotonicity activated Cl- currents [2, 24], then it is quite likely that the ClC-3 protein is not VRAC. On the other hand, it has been recently suggested that TMEM16A, a Ca2+-activated Cl- channel, could be a crucial component of VRAC in epithelial cells [1]. Interestingly, we detected mRNA for TMEM16A in HEK-293 (see reference 1 for further details) but not in HL-60 cells. Although, this implies that TMEM16A is not part of VRAC in HL-60 cells, our evidence is not sufficient to conclude that TMEM16A cannot work as a VRAC in other cells including HEK-293 cells. Therefore, different gene(s) could be responsible for VRAC channels in HL-60 or other blood cells.
The H+ and Cl- effects on VRAC inactivation are reminiscent of the effects these ions have on ClC chloride channels. It has been proposed that ClC channels gain voltage sensitivity via interaction with H+ ions and such interaction can be modulated by Cl- ions [13, 17]. Thus, to explain inactivation we propose that VRAC have binding sites for both H+ and Cl- ions. Since our data suggest that the H+ and Cl- effects are coupled we assumed that both ions are needed to trigger the inactivation process. Previous observations showing that high [Cl-]e or highly permeable anions prevented inactivation [26] suggested that pore occupancy also plays a role. To explain VRAC inactivation we incorporated these ideas into a kinetic model. In our model a full open conformation is reached when binding sites for H+ and Cl- are occupied (Fig. 7, lower right corner of outer layer). From this conformation, channels can reach the inactivated state through a Vm-dependent conformational change controlled by voltage-dependent rate constants αv and βv. Inactivation would be enhanced when the external H+ and internal Cl- binding sites are occupied and the pore is empty. This hypothesis was tested by simulating pore occupancy with the help of our model. Supplemental Fig. 9 shows that the pore remains open when one permeant anion is bound to a site located at an electrical distance of 0.2 from the outside. However, when the pore is empty inactivation would occur due to a collapse of the pore. For example, assuming that [Cl-]e=[Cl-]i= 140 mM we calculated Pu (probability that the pore is unpopulated) values of 0.02 and 0.48 at -100 and +100 mV, respectively. These numbers are compatible with our experimental observations (compare data in Fig. 3 and 4 with Fig. 8). Hence our model predicts that lowering [Cl-]e from 140 to 20 mM will slightly enhance inactivation at positive Vm (Supplemental Fig. 9a) and helps explain the Vm and external Cl- dependence of inactivation (Supplemental Fig. 9b). Although limited, our model is the first to reproduce both the time course of IClVol as well as the H+ and Cl- effects on inactivation.
In summary, we show that the decay of IClVol in non-blood cells depends on the interaction of intracellular Cl- and external H+ ions as well as the pore occupancy. The ions interact with the channel outside the electrical field to induce a conformational change that prompts the channels to inactive in a Vm-dependent manner. This ion- dependent inactivation might be relevant for VRAC function since the H+ and Cl- effects occurred within a physiological range of concentrations.
Supplementary Material
Acknowledgments
This work was supported by grants 79897, 59889 and 45895 (Consejo Nacional de Ciencia y Tecnologia, Mexico) and PO1-HL18208 (National Institutes of Health, USA). TRS and JADSC received a scholarship from Consejo Nacional de Ciencia y Tecnologia, Mexico.
References
- 1.Almac J, Tian Y, Aldehni F, et al. TMEM16 proteins produce volume-regulated chloride currents that are reduced in mice lacking TMEM16A. J Biol Chem. 2009;284:28571–28578. doi: 10.1074/jbc.M109.010074. [DOI] [PMC free article] [PubMed] [Google Scholar]
- 2.Arreola J, Begenisich T, Nehrke K, et al. Secretion and cell volume regulation by salivary acinar cells from mice lacking expression of the Clcn3 Cl- channel gene. J Physiol. 2002;545:207–216. doi: 10.1113/jphysiol.2002.021980. [DOI] [PMC free article] [PubMed] [Google Scholar]
- 3.Arreola J, Hallows KR, Knauf PA. Volume-activated chloride channels in HL-60 cells: potent inhibition by an oxonol dye. Am J Physiol. 1995;269:C1063–C1072. doi: 10.1152/ajpcell.1995.269.4.C1063. [DOI] [PubMed] [Google Scholar]
- 4.Arreola J, Melvin JE, Begenisich T. Volume-activated chloride channels in rat parotid acinar cells. J Physiol. 1995;484:677–687. doi: 10.1113/jphysiol.1995.sp020695. [DOI] [PMC free article] [PubMed] [Google Scholar]
- 5.Arreola J, Park K, Melvin JE, et al. Three distinct chloride channels control anion movements in rat parotid acinar cells. J Physiol. 1996;490:351–362. doi: 10.1113/jphysiol.1996.sp021149. [DOI] [PMC free article] [PubMed] [Google Scholar]
- 6.Coca-Prados M, Sánchez-Torres J, Peterson-Yantorno K, et al. Association of ClC-3 channel with Cl- transport by human nonpigmented ciliary epithelial cells. J Membr Biol. 1996;150:197–208. doi: 10.1007/s002329900044. [DOI] [PubMed] [Google Scholar]
- 7.Duan D, Winter C, Cowley S, et al. Molecular identification of a volume-regulated chloride channel. Nature. 1997;390:417–421. doi: 10.1038/37151. [DOI] [PubMed] [Google Scholar]
- 8.Duan D, Zhong J, Hermoso M, et al. Functional inhibition of native volume-sensitive outwardly rectifying anion channels in muscle cells and Xenopus oocytes by anti-ClC-3 antibody. J Physiol. 2001;531:437–444. doi: 10.1111/j.1469-7793.2001.0437i.x. [DOI] [PMC free article] [PubMed] [Google Scholar]
- 9.Furst J, Gschwentner M, Ritter M, et al. Molecular and functional aspects of anionic channels activated during regulatory volume decrease in mammalian cells. Pflugers Arch. 2002;444:1–25. doi: 10.1007/s00424-002-0805-1. [DOI] [PubMed] [Google Scholar]
- 10.Hanrahan JW, Tabcharini JA. Inhibition of an outwardly rectifying anion channel by HEPES and related buffers. J Memb Biol. 1990;116:65–77. doi: 10.1007/BF01871673. [DOI] [PubMed] [Google Scholar]
- 11.Hille B. Ion Channels of Excitable Membranes. Sinauer Associates, Inc.; USA: 2001. [Google Scholar]
- 12.Lewis RS, Ross PE, Cahalan MD. Chloride channels activated by osmotic stress in T lymphocytes. J Gen Physiol. 1993;101:801–26. doi: 10.1085/jgp.101.6.801. [DOI] [PMC free article] [PubMed] [Google Scholar]
- 13.Meyer K, Korbmacher C. Cell swelling activates ATP-dependent voltage-gated chloride channels in M-1 mouse cortical collecting duct cells. J Gen Physiol. 1996;108:177–193. doi: 10.1085/jgp.108.3.177. [DOI] [PMC free article] [PubMed] [Google Scholar]
- 14.Miller C. ClC chloride channels viewed through a transporter lens. Nature. 2006;440:484–489. doi: 10.1038/nature04713. [DOI] [PubMed] [Google Scholar]
- 15.Nilius B, Eggermont J, Voets T, et al. Properties of volume-regulated anion channels in mammalian cells. Prog Biophys Mol Biol. 1997;68:69–119. doi: 10.1016/s0079-6107(97)00021-7. [DOI] [PubMed] [Google Scholar]
- 16.Nilius B, Prenen J, Droogmans G. Modulation of volume-regulated anion channels by extra- and intracellular pH. Pflugers Arch. 1998;436:742–748. doi: 10.1007/s004240050697. [DOI] [PubMed] [Google Scholar]
- 17.Niemeyer MI, Cid LP, Yusef YR, et al. Voltage-dependent and -independent titration of specific residues accounts for complex gating of a ClC chloride channel by extracellular protons. J Physiol. 2009;587:1387–1400. doi: 10.1113/jphysiol.2008.167353. [DOI] [PMC free article] [PubMed] [Google Scholar]
- 18.Okada Y. Cell volume-sensitive chloride channels: phenotypic properties and molecular identity. Contrib Nephrol. 2006;152:9–24. doi: 10.1159/000096285. [DOI] [PubMed] [Google Scholar]
- 19.Okada Y, Sato K, Numata T. Pathophysiology and puzzles of the volume-sensitive outwardly rectifying anion channel. J Physiol. 2009;587:2141–2149. doi: 10.1113/jphysiol.2008.165076. [DOI] [PMC free article] [PubMed] [Google Scholar]
- 20.Perez-Cornejo P, Arreola J, Law FY, et al. Volume-sensitive chloride channels do not mediate activation-induced chloride efflux in human neutrophils. J Immunol. 2004;172:6988–6993. doi: 10.4049/jimmunol.172.11.6988. [DOI] [PubMed] [Google Scholar]
- 21.Poletto Chaves LA, Varanda WA. Volume-activated chloride channels in mice Leydig cells. Pflugers Arch. 2008;457:493–504. doi: 10.1007/s00424-008-0525-2. [DOI] [PubMed] [Google Scholar]
- 22.Rossow CF, Duan D, Hatton WJ, et al. Functional role of amino terminus in ClC-3 chloride channel regulation by phosphorylation and cell volume. Acta Physiol (Oxf) 2006;187:5–19. doi: 10.1111/j.1748-1716.2006.01550.x. [DOI] [PubMed] [Google Scholar]
- 23.Sabirov RZ, Prenen J, Droogmans G, et al. Extra- and Intracellular Proton-Binding Sites of Volume-Regulated Anion Channels. J Memb Biol. 2000;177:13–22. doi: 10.1007/s002320001090. [DOI] [PubMed] [Google Scholar]
- 24.Stobrawa SM, Breiderhoff T, Takamori S, et al. Disruption of ClC-3, a chloride channel expressed on synaptic vesicles, leads to a loss of the hippocampus. Neuron. 2001;29:185–196. doi: 10.1016/s0896-6273(01)00189-1. [DOI] [PubMed] [Google Scholar]
- 25.Stoddard JS, Steinbach JH, Simchowitz L. Whole cell Cl- currents in human neutrophils induced by cell swelling. Am J Physiol. 1993;265:C156–C165. doi: 10.1152/ajpcell.1993.265.1.C156. [DOI] [PubMed] [Google Scholar]
- 26.Voets T, Droogmans G, Nilius B. Modulation of Voltage-dependent Properties of a Swelling-activated Cl Current. J Gen Physiol. 1997;110:313–325. doi: 10.1085/jgp.110.3.313. [DOI] [PMC free article] [PubMed] [Google Scholar]
Associated Data
This section collects any data citations, data availability statements, or supplementary materials included in this article.


