

Abstract
A simple approach to the mechanical modulation of layer-by-layer (LbL) films is through manipulation of the film assembly. Here, we report results based on altering the salt concentration during film assembly and its effect on film rigidity. Based on changes in film rigidity, cell adhesion characteristics and transfection activity were investigated in vitro. LbL films consisting of reducible hyperbranched poly(amide amine) (RHB) have been implemented along with DNA for investigating fibroblast adhesion on [RHB/DNA]n/2 films with varying rigidities. The rigidity was varied by changing the ionic concentration of the deposition solution between 0.01 M NaCl and 1.0 M NaCl. Molecular force probe (MFP) measurements were performed to measure the apparent Young’s modulus, EAPP, of the films in situ. Cell adhesion and stress-fiber characteristics were investigated using total internal reflectance microscopy (TIRF-M). The average cell peripheral area, fiber density and average fiber length during 5 days of cell growth on films with either low (below 2.0 MPa) or high (above 2.0 MPa) film elastic modulus were investigated. Transfection studies were performed using gfpDNA and SEAP-DNA to investigate if changes in cell adhesion affect transfection activity. Furthermore, cell proliferation and cytotoxicity studies were used to investigate cellular viability over a week. The results have shown that surface modification of bioreducible LbL films of controlled thickness and roughness promotes cellular adhesion, stress-fiber growth and increased transfection activity without the need for an additional adhesive protein pre-coating of the surface or chemical cross-linking of the film.
Keywords: molecular force probe, MFP, cell adhesion, transfection, TIRF-M, stress fiber orientation, layer-by-layer, LbL, mechanical properties, thin films, elastic modulus, film rigidity
INTRODUCTION
Thin films used as biomaterials are of particular interest in the field of tissue engineering and regenerative medicine due to their ability to modulate cellular growth and tissue repair [1,2]. It is known that alterations to the mechanical properties of films can promote cellular responses affecting cell-surface interactions along with cell growth and viability [3–7]. Many investigations have shown that mechanical alterations to hydrogel films can occur with changes in hydrophobicity and hydophilicity [8–10], surface charge [11], roughness [12], pH [13,14] and cross-linking [15]. On the other hand, only a few investigations have studied the effects of mechanical properties of nano-thick layer-by-layer (LbL) films on cell-surface interactions [14,16]. Previous studies have found that above a certain threshold, cells can not sense a change in rigidity of stiff substrates. However, this threshold value has been much debated due to the use of different cell lines and surfaces. In these investigations we are interested in changing the mechanical properties of bioreducible LbL films and investigating how these changes alter cell adhesion, stress-fiber growth and transfection activity for these particular films. Bioreducible films are advantageous over other systems due to their ability to disassemble upon cell attachment.
Cell adhesion properties and cell viability are dependant on surface characteristics and focal adhesion points which specifically bind the cell to the surface. Studies have shown that cell spreading characteristics on surfaces are dependent on the density of focal adhesion points at the cell-surface interface. This density is affected by variations in the film stiffness independent of the chemical composition of films [5,7,17]. Cells recognize the surface stiffness, influencing the tension of focal adhesion bonds which anchor the cell to the surface. With increased tension at the focal adhesion sites (with increased film rigidity), the bonds eventually break, and a balance of stress occurs through the recruitment of new bonds driven by cytoskeletal movements. This process leads to cell growth, stress-fiber rearrangement, movement and reshaping of the cell [18–21]. Therefore, when a cell adheres to a more rigid surface, the cell tends to have an extended or spread shape and the stress-fiber orientation is altered due to the change in focal adhesion bonds as the cell spreads and migrates [22]. One way of investigating alterations of focal adhesions at the cell-surface is through studying the stress-fibers. Investigating the stress-fibers allows for a clearer analysis of the cell spreading characteristics at the cell-surface interface.
Current studies on hydrogels by Engler et al. showed that when C2C12 cells are grown on polyacrylamide matrices, the number and length of cell motile structures responsible for cell adhesion and movement are directly related to film stiffness [23]. Pelham et al. performed in vitro studies showing that fibroblast cell growth on surfaces can be directed by changing the nominal mechanical compliance of hydrogel substrates [7]. In this paper, we present data with regards to altering cell adhesion and transfection activity by simply changing the rigidity of a surface. It is known that changes in film characteristics and structure can be simply made by altering the salt concentration [24–26]. Salt screens the negative charges on the phosphate backbone of DNA, minimizing the repulsion between neighboring strands and inducing a change in polyelectrolyte conformation from an extended to a more coiled shape. Additionally, it is known that the persistence length of DNA doubles when salt concentration is decreased from 2 M NaCl to 0.25 M NaCl [27]. As a result, a thicker and more rigid polyelectrolyte film is formed with a looser polyelectrolyte network due to the decrease in salt concentration.
For these experiments, films are assembled with poly(amido amine) RHB and DNA while changes in film rigidity are made through alterations in the salt concentration (0.01–1.0 M NaCl) during film deposition. Bioreducible RHB was used since it is known to have significant transfection acitivity in vitro and in vivo [28], low cytotoxcity [29–31] and can successfully condense DNA [32] within bioreducible LbL films. Cellular adhesion, viability, spreading and stress-fiber growth were measured on films with varying rigidities in order to obtain a clearer understanding of how the mechanical properties of bioreducible LbL films affect these cellular properties. Through these investigations, it has been found that with simple alterations to the mechanical properties of bioreducible LbL films, a significant control of cellular adhesion, viability, stress-fiber orientation and also transfection activity can be obtained.
MATERIALS AND METHODS
Materials
gWiz™ high-expression green fluorescent protein plasmid (6,732 bp) (gfpDNA) was purchased from Aldevron and used without purification. The contour length of DNA with 6,732 bp is estimated to be 2.3 μm. Water was deionized to 18 MΩ×cm resistivity using the Nanopure System from Barnstead. Grade V5 muscovite mica was purchased from Ted Pella and hand cleaved just before use. Polished n-type silicon wafers (resistivity 50–75 Ω×cm) were purchased from Wafer World. The silicon wafer was treated by the RCA method [33,34] before film deposition. The samples were cleaned at 60 °C under ultrasonication in 1:2:8 HCl/H2O2/deionized water (by volume) for 30 min and then in 1:2:7 NH4OH/H2O2/deionized water (by volume) for another 30 min. Dithiothreitol (DTT, Sigma), 1-(2-aminoethyl)piperazine (AEPZ, Aldrich), 1-methylpiperazine (Aldrich), N,N′-methylenebisacrylamide (MBA, Aldrich), and N,N′-cystaminebisacrylamide (CBA, Polysciences) were purchased in the highest purity and used without further purification. All other chemicals were purchased from Sigma-Aldrich.
Polymer Synthesis
The synthesis of hyperbranched and linear bioreducible poly(amido amine)s by Michael addition copolymerization was reported in an earlier paper. The different reactivity of the amines in AEPZ allows synthesis of either linear or hyperbranched polymers by simply changing the ratio of AEPZ-to-bisacrylamide monomers [35]. A 1:2 molar ratio of AEPZ to CBA+MBA yields hyperbranched polymers, while a 1:1 ratio leads to linear polymers. The chemical composition of the hyperbranched polymers is further varied by the CBA to MBA ratio, e.g. the reducible disulfide chain density. The hyperbranched poly(amido amine) used in this study, denoted RHB, has a CBA content of 32 % by using a CBA:MBA feed ratio of 1:2. The chemical composition was characterized by 1H NMR and 13C NMR using a Varian spectrometer (400 MHz). Its weight-average molecular weight (Mw) is 66,000 with a polydispersity index (Mw/Mn) of 1.7 Mw and Mw/Mn were determined by size exclusion chromatography (SEC) in 0.03 M sodium acetate (pH 4.5) using Shimadzu LC-10ADVP liquid chromatography equipped with CTO-10ASVP Shimadzu column oven and Polymer Labs PL gel 5 mm mixed C column. SEC data were analyzed using Astra 5.3.1.4 software from Wyatt Technology. Refractive index increments (dn/dC) were determined by an interferometric refractometer and used in SEC analysis. The low cytotoxicity of the bioreducible polymers is the primary motivation for this study. Cytotoxicity of the synthesized polycations and control PEI were estimated by measuring cell viability at 50 μg/mL of the polymer. All the bioreducible poly(amido amine)s had lower cytotoxicity than control branched polyethylenimine (PEI, 25 kDa) and their cytotoxicity decreased with increasing content of the reducible disulfide bonds (data not shown).
Film Assembly
Four types of LbL films were studied, (RHB/DNA)6, (RHB/DNA)12, (RHB/DNA)16 and (RHB/DNA)20. 2 g/L RHB in 0.02 M sodium acetate buffer (pH 5.5) and 0.25 g/L DNA in 0.1 M sodium acetate buffer (pH 5.0) were used in the LbL deposition. The substrate was immersed into the RHB solution for 15 min and rinsed three times by 2-min immersion in deionized water. The second and third layers were deposited using the same procedure as the first layer.
Molecular Force Probe (MFP)
For force measurements, a Molecular-Force Probe (MFP) 1D AFM (Asylum Co, Santa Barbara, USA) was used. This apparatus is designed for force spectroscopy measurements and includes a nano-positioning sensor (LVDT sensor) which allows for independent measurements of the piezo extension. Tip-less contact cantilevers (Micromash, Estonia) with a high spring constant (average 0.60 N/m) were used for meaurements. At the apex of the cantilevers, glass beads were fixed using epoxy glue (UHU Plus endfest 300) [36,37]. Glass beads (30–40 μm) were purchased from Polyscience Inc. The spring constant of the cantilevers was determined by their thermal resonance frequency spectra [38,39]. All experiments were performed in situ.
In order to determine the mechanical properties of the films, MFP force-distance curves were measured using IgorPro Software. The system was allowed to equilibrate at room temperature for 20 min before imaging. Force curves were fitted to the Hertzian model δ = AFb where δ is the indentation of the films and the F is the load force. The cantilever distance, z-zo, versus cantilever deflection, d-do, data from MFP were fitted to a Hertz model of a sphere on a planar film [40]. The apparent Young’s modulus, EAPP, was calculated by taking the indentation force value as a function of indentation.
Atomic Force Microscopy (AFM)
AFM was used to study the surface morphological change during film assembly (Multimode IIIa AFM (Digital Instruments) with an E-scanner, maximum scan area = 14.2×14.2 μm2). Tapping mode in air was conducted using silicon tips (TESP, VEECO). Only height images are shown and these have been plane-fit in the fast scan direction with no additional filtering operation. The surface roughness of the films was determined using the root-mean-square surface roughness where zi is the height value and n is the number of pixels in the image. All Rq values reported were obtained on images of the same scan size (5×5 μm2).
Ellipsometry
A phase-modulated ellipsometer (Beaglehole Instruments, New Zealand) fixed at the incidence angle (≈ 70°) was used to quantify film thickness change during the LbL assembly on a silicon wafer. The ellipticity at the Brewster angle, θB, ρ = Im(rp/rs)|θB, was measured, where rp and rs are the complex reflection amplitudes for p and s polarizations, respectively. The ellipticity was converted to film thickness using the Drude equation.
Cell Attachment and Proliferation
Silicon wafers containing [RHB/DNA]n films were cut into 1×1 cm2 pieces and placed at the bottom of 12-well plates. NIH-3T3 cells were grown to 80 % confluence, trypsinized, washed with PBS, and re-suspended in DMEM (Invitrogen, Carlsbad, CA). Next, 40,000 cells were placed in the well plate with the silicon substrate and incubated in 5 % CO2 at 37 °C for 1 h. The silicon substrate with the cells attached was removed and placed into new wells containing fresh DMEM supplemented with 10% FBS. Cell culture medium was replaced every day by carefully washing the silicon substrate with PBS and transferring the sample into new well plates with 2 mL of fresh medium. Cell attachment and proliferation was imaged daily with an inverted optical microscope.
Cell viability studies
Cell proliferation reagent, WST-1 assay, was carried out in parallel with the LDH assay. The WST-1 procedure was carried out using 2 mL of fresh serum-free DMEM without phenol red. 200 μL of the WST-1 assay was added to each of the well plates and incubated for an additional 4 hr at 37 °C under 5 % CO2 in a humidified incubator. Controls were used with no cell attached to the films. The absorbance was measured in an ELISA microplate reader (Bio-Rad) at 450/650 nm and the percent cytotoxcity was calculated by taking the background subtracted from the sample. Lactate dehydrogenase (LDH) was used to quantify cell attachment and proliferation using a commercial CytoTox 96® Nonradioactive Cytotoxicity Assay kit (Promega). At different time points the growing cells were washed with PBS and the cells then lysed by three freeze-thaw cycles. 50 μL of the cell lysate was diluted with 50 μL of DMEM/FBS without phenol red. The LDH substrate (50 μL) was added to each sample and incubated for 30 min in dark. Fifty microliters of the stop solution was added to each sample and the adsorbance was measured at 490 nm. A calibration curve (cell number vs. LDH content) was constructed using a known number of cells. The results are expressed as mean number of cells per cm2 of the mesh ± S.D. obtained from 4 samples.
Total internal reflection fluorescence microscopy (TIRF)
Cell fiber orientation on the films was determined using TIRF (Olympia). Alexa Fluor (568 hydrazide, Invitrogen) was used according to the protocol. Images were taken the same day as the Alexa Fluor was added. TIRF studies were quantified by first masking the images and then using the mean intercept length (MIL) to quantify fiber orientation and alignment. For TIRF investigations, a typical film should not be more than 150 nm in thickness or else the cell stress-fibers and the cell in general, will not be seen due to the laser interaction with the cell and film, inhibiting an appropriate output reading of thicker films. Therefore, only samples which were less than 150 nm in thickness were used since films above this thickness had no observed stress-fibers.
RESULTS AND DICUSSION
Effect of salt concentration on film rigidity
The thickness and roughness of (RHB/DNA)N/2 films at different salt concentrations are given in Fig. 1. With increased salt concentration, the roughness and thickness values increased for all samples. Films assembled in low salt concentrations (0.01–0.1 M NaCl) were found to have linearly increasing thickness and roughness values, films assembled in high salt concentration have exponentially increasing film thickness (Fig. 1). The exponential growth characteristic is due to increased ionic strength forming stretched conformations in the polyelectrolyte chains. These findings are similar to those of Goth et al. (PDDA/PSS films) and Caruso et al. (DNA films containing two homopolymeric diblocks) which found that film assembly with salt concentrations above 0.3 M NaCl or 0.5 M NaCl have vermiculate film morphologies and appear to have different growth characteristics [41,42]. Fig. 2 shows the surface features measured by AFM for two salt concentrations (0.01 and 0.5 M NaCl) and different numbers of bi-layers. With increased salt concentration and number of bi-layers the surface features increase in size.
Figure 1.

Thickness data obtained from ellipsometry and AFM roughness (Ra) data of films with increasing number of (RHB/DNA) layers and increasing ionic concentration of the deposition solution.
Figure 2.

AFM height images of (RHB/DNA)n/2 films, 10μm × 10μm. In the left column the films were deposited with 0.01 M NaCl and the images in the right column were deposited with 0.5 M NaCl. a,b) (RHB/DNA)6, c,d) (RHB/DNA)12, e,f) (RHB/DNA)16, and g,h) (RHB/DNA)20. All images were scanned with Z = 200 nm.
LbL film stiffness values, measured in an in situ environment, are given in Table 1. With increased NaCl concentration of the deposition solution or an increase of the number of bi-layers, the apparent Young’s modulus, EAPP, was found to decrease. Films assembled in high salt concentration have low EAPP values, which decrease exponentially with increasing number of layers. This is attributed to the exponential growth characteristics of the films. These EAPP values are based on the apparent Young’s modulus since a tip-effect is assumed for all samples due to the large tip-radius compared to the film thickness. However, since the tip-effect is found with all samples, it can further be assumed that the differences in film stiffness are correlated to an actual change in EAPP. For further analyses of results, the films have been separated into two groups; < 2.0 MPa is considered to be a film with a low apparent modulus (low-EAPP) and > 2.0 MPa a high apparent modulus (high-EAPP). Between these two groups, we have observed the greatest changes in cellular adhesion, cell spreading, stress-fiber growth and transfection activity. Furthermore, when looking back at Fig. 1, it is observed that the films above 80 nm in thickness are the films which have low-EAPP values.
Table 1.
Apparent Young’s modulus values, EAPP, based on altering the number of adsorbed layers and increasing ionic concentration of the deposition solution.
| 6 bi-layers | 12 bi-layers | 16 bi-layers | 20 bi-layers | |
|---|---|---|---|---|
| 0.01 M NaCl | 9.9 ± 0.9 MPa | 8.4 ± 0.7 MPa | 4.5 ± 0.6 MPa | 3.2 ± 0.6 MPa |
| 0.1 M NaCl | 7.9 ± 0.7 MPa | 7.0 ± 0.6 MPa | 3.1 ± 0.5 MPa | 1.8 ± 0.3 MPa |
| 0.5 M NaCl | 5.7 ± 0.8 MPa | 4.3 ± 0.8 MPa | 1.1 ± 0.3 MPa | 0.5 ± 0.05 MPa |
| 1.0 M NaCl | 4.5 ± 0.6 MPa | 1.9 ± 0.4 MPa | 0.3 ± 0.1 MPa | 0.08 ± 0.01 MPa |
Cell adhesion and spreading properties in vitro
3T3 fibroblast proliferation is shown over 7 days for both high- and low-EAPP films (Fig. 3). During cell seeding and the first 24 h of cell growth, both high-EAPP and low-EAPP films show cell attachment. However, the cells attached to high-EAPP films appear larger and more flat compared to the cells attached to low-EAPP films which appear darker and non-circular. From LDH assay studies it is found that cells are consistently more viable on high-EAPP films compared to low-EAPP films. In theory, LDH is dependent on cell count, however we are using this data in correlation with optical microscopy data providing both a qualitative as well as quantitative analysis. Over a week, high-EAPP films have exponentially increasing number of cells, showing that the cells are growing well on these films. Two distinct cell shapes are found on both high- and low-EAPP films (Fig. 3); either a circular formation or a spread formation where spread cells are assumed to be healthy cells. For high-EAPP films, the cells begin spreading at day 2 and by day 4, 90 % of the cells are in a stretched conformation and only a minimal amount of circular cells remain on the surface at 7 days. For low-EAPP films only ~15 % of the cells are spread after 7 days.
Figure 3.

Cell proliferation studies using LDH reagent to quantify cell proliferation and WST-1 reagent for cell viability studies. High- and low-EAPP (RHB/DNA)n/2 films were investigated over 7 days. Cell growth on high-EAPP ((RHB/DNA)16 assembled in 0.01M NaCl) over 5 days a) 1 day, b) 3 days, c) 4 days, d) 5 days e) and low-EAPP ((RHB/DNA)16 assembled in 1.0M NaCl) on the same days.
Low-EAPP films have cell attachment on the first 1–2 days, however fewer cells are attached at day 3 compared to day 2, possibly due to non-viable cells being washed off the surface. Additionally, cells growing on low-EAPP films do not appear to be spreading, but rather aggregating after initial attachment. At day 7 low percentages (~10 %) of cells begin to spread and increased cell viability can be observed. One possible explanation why the cells begin spreading after 7 days is due to an alteration of the films due to disassembly. Additionally, it is observed that the changes in cell adhesion and viability are mostly due to the actual film rigidity and not the applied salt concentration, which does not appear to play a significant role in cell viability (Supporting Information, S1).
Fig. 4-top, provides cell peripheral area measurements only for the spread cells on high- and low-EAPP films. Upon initial cell attachment, both high- and low-EAPP films have cell areas < 200 μm and on average, low-EAPP films have decreased areas compared to high-EAPP films. After day 1, the cell peripheral area increases steadily for 5 days for both high- and low-EAPP films. The cell area after day 5 could not be measured due to either cellular confluence on the surface or due to cell aggregation. At day 5, cells growing on high-EAPP reach the maximal size for 3T3 cells (which is known to be ~1000 μm2). It is shown that cells grown on high-EAPP films have higher peripheral areas compared to cells grown on low-EAPP films for all 5 days of growth. In correspondence to results with hydrogel films we found that the number of cells on the surface highly correlate with the EAPP values of bioreducible LbL films.
Figure 4.
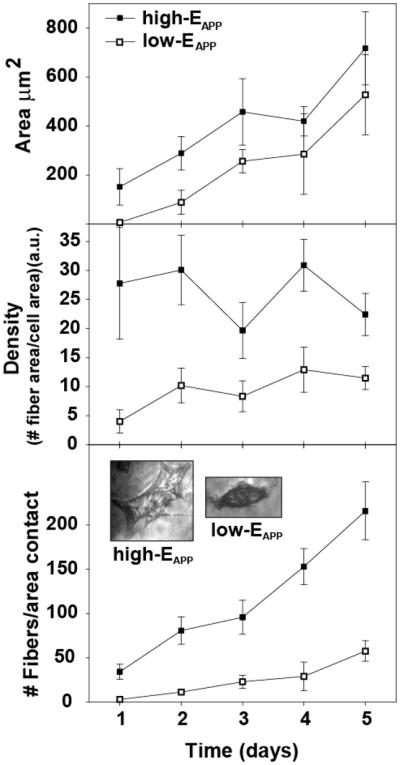
Quantified TIRF analysis showing the average cell are (μm2/cm2) (top), average stress fiber density (middle) and number of stress-fibers (bottom) of the spreading cells for both high- and low-EAPP films calculated over 5 days.
Stress-fiber growth characteristics
During cell growth, the cellular stress-fibers were investigated using TIRF-M for both high- and low-EAPP films. Again, these investigations only focus on spreading cells since cells which were circular in shape had a dense gray color and minimal stress-fibers could be observed (Supporting Information, S2). It can be suggested that this dark gray area is the formation of apoptotic bodies. Only the cells which were spreading had distinct and visible stress-fibers. Fig. 4-middle, shows that as the peripheral area of the cells increases, the density of the stress-fibers within the cells remains relatively constant. The density of stress-fibers is on average 20 % more on high-EAPP films compared to low-EAPP films. On low-EAPP films, the density of stress-fibers is lower with only a slight increase over time. The same trend is observed for both high- and low-EAPP films including a decrease in fiber density at day 3. The small fluctuation in fiber density with increasing cell area is a possible result of new (shorter) fibers forming. Fig. 4-bottom, clearly shows that the number of stress-fibers increases consistently for cells grown on both high- and low-EAPP films, however, cells grown on high-EAPP films have about 4-times more fibers compared to cells grown on low-EAPP films.
The percentage of smaller fibers was higher on the rigid films compared to soft films. Over the first five days, the percentage of fibers below 2 μm was between 30 % and 50 % on rigid films, whereas in the case of soft films, this number was between 10 % and 30 % (Supporting Information, S3). This data suggests that cell spreading rates are dependent on the number and density of stress-fibers forming. It is further suggested that the increased production of shorter fibers may also play a role in cell attachment to high- and low-EAPP films. However, the actual fiber length is difficult to determine due to the shape of the attached cell to the surface. If the stress-fiber is not directly at the cell-surface/substrate interface, only parts of the stress-fiber can be observed due to the increased distance from the TIRF detector. Additionally, the stress fibers of cells growing on high-EAPP films have a less common orientation compared to stress fibers on low-EAPP films (Supporting Information, S4). This is due to the increased number of fibers and an increased spreading of the cells in multiple directions on the more rigid films.
Transfection activity in vitro
In Fig. 5, gfpDNA was used during film assembly and fluorescence images were captured for high- and low-EAPP films. It was found that after 24 h of cell seeding, none of the cells appeared green for any of the samples. After 3 days, high-EAPP films had many green cells accounting for about 50–60 % of the cells attached to the surface. At day 5 the cells were 100 % confluent with 90–100 % of the cells bright green in color, showing very strong transfection activity. For lowEAPP films, small amounts of transfection could be observed after 4 days of cell growth (Fig. 5), and low transfection activity is found after 1 week (Supporting Information, S5). Spread cells on low-EAPP films do not appear to have as high transfection activity as spread cells on high-EAPP films which is seen from the decreased intensity of gfp within the cells. It is also observed that cells grown on films assembled in higher salt concentration tend to have fewer transfected cells compared to cells growing on films with decreased salt concentration (Supporting Information, S6). The transfection activity with respect to the number of bi-layers would require a long-term investigation to determine if there is a significant difference in transfection levels over many weeks between 6 and 20 bi-layer bioreducible LbL films.
Figure 5.
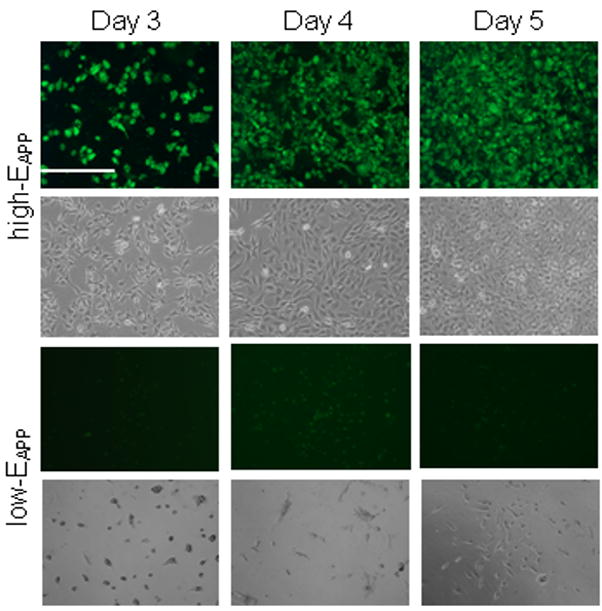
Cell transfection studies with (RHB/gfpDNA)n/2 on both high- and low-EAPP films over 5 days. Changes after day 5 were negligible and are therefore not included.
SEAP-DNA was used to quantify the transfection activity. Fig. 6 shows that the transfection levels are in fact much lower for low-EAPP films compared to high-EAPP films. The transfection activity of low-EAPP films begins to increase at day 5. Additionally, it is found that cells growing on high-EAPP films have increased transfection activity compared to the more circular cells growing on low-EAPP films. With regards to the less effective low-EAPP films, long-term single-cell transfection experiments could help to answer the question if the spread cells ever achieve higher transfection activity on soft thin LbL films.
Figure 6.
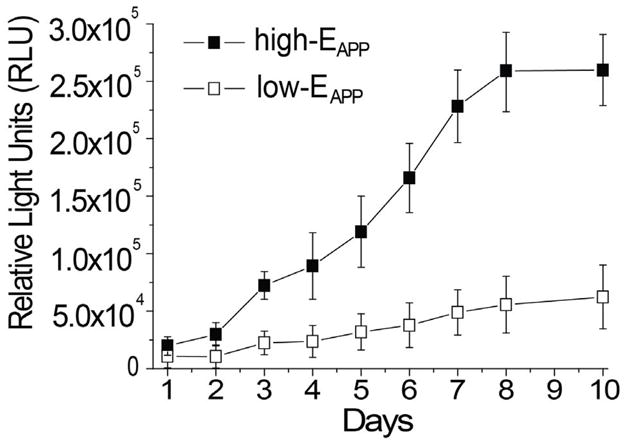
Transfection activity over 7 days using SEAP DNA. (RHB/DNA)n/2 films were deposited in either 0.01 M NaCl, 0.10 M NaCl, 0.50 M NaCl, or 1.0 M NaCl and were categorized as either high- or low-EAPP films.
CONCLUSIONS
These studies have shown that altering the salt concentration during film assembly of bioreducible LbL films can change the film modulus by 2 orders of magnitude, affecting both film thickness and roughness. Additionally, two different growth characteristics have been observed for films assembled in low or high salt concentration. AFM images show that film assembly within these two salt ranges has an effect on surface characteristics as well. Significant differences in cell attachment, growth and transfection activity are seen with film rigidities either < 2 MPa (low-EAPP) or > 2 MPa (high-EAPP). During cellular growth and proliferation it is found that cells grown on high-EAPP films have increased peripheral areas and stress-fiber density compared to cells grown on low-EAPP films. These growth characteristics also have an effect on transfection activity which is found to be significantly higher for cells grown on high-EAPP films compared to low-EAPP films.
Supplementary Material
Acknowledgments
This work was partially supported by the National Institutes of Health (CA 109711).
Footnotes
Publisher's Disclaimer: This is a PDF file of an unedited manuscript that has been accepted for publication. As a service to our customers we are providing this early version of the manuscript. The manuscript will undergo copyediting, typesetting, and review of the resulting proof before it is published in its final citable form. Please note that during the production process errors may be discovered which could affect the content, and all legal disclaimers that apply to the journal pertain.
References
- 1.Healy KE. Molecular engineering of materials for bioreactivity. Curr Opin Solid State Mater Sci. 1999;4:381–87. [Google Scholar]
- 2.Dillow AK, Tirrell M. Targeted cellular adhesion at biomaterial interfaces. Curr Opin Solid State Maters Sci. 1998;3:252–59. [Google Scholar]
- 3.Discher DE, Janmey P, Wang YL. Tissue cells feel and respond to the stiffness of their substrate. Science. 2005;310:1139–43. doi: 10.1126/science.1116995. [DOI] [PubMed] [Google Scholar]
- 4.Engler AJ, Griffin MA, Sen S, Bonnetnann CG, Sweeney HL, Discher DE. Myotubes differentiate optimally on substrates with tissue-like stiffness: pathological implications for soft or stiff microenvironments. J Cell Biol. 2004;166:877–87. doi: 10.1083/jcb.200405004. [DOI] [PMC free article] [PubMed] [Google Scholar]
- 5.Bershadsky AD, Balaban NQ, Geiger B. Adhesion-dependent cell mechanosensitivity. Annu Rev Cell Dev Biol. 2003;9:677–95. doi: 10.1146/annurev.cellbio.19.111301.153011. [DOI] [PubMed] [Google Scholar]
- 6.Cukierman E, Pankov R, Stevens DR, Yamada KM. Taking cell-matrix adhesions to the third dimension. Science. 2001;294:1708–12. doi: 10.1126/science.1064829. [DOI] [PubMed] [Google Scholar]
- 7.Pelham RJ, Wang YL. Cell locomotion and focal adhesions are regulated by substrate flexibility. Proc Natl Acad Sci U S A. 1997;94:13661–65. doi: 10.1073/pnas.94.25.13661. [DOI] [PMC free article] [PubMed] [Google Scholar]
- 8.Gray DS, Tien J, Chen CS. Repositioning of cells by mechanotaxis on surfaces with micropatterned young’s modulus. J Biomed Mater Res, Part A. 2003;66A:605–14. doi: 10.1002/jbm.a.10585. [DOI] [PubMed] [Google Scholar]
- 9.Angelova N, Hunkeler D. Rationalizing the design of polymeric biomaterials. Trends Biotechnol. 1999;17:409–21. doi: 10.1016/s0167-7799(99)01356-6. [DOI] [PubMed] [Google Scholar]
- 10.Grinnell F, Feld MK. Fibronectin adsorption on hydrophilic and hydrophobic surfaces detected by antibody-binding and analyzed during cell-adhesion in serum-containing medium. J Biol Chem. 1982;257:4888–93. [PubMed] [Google Scholar]
- 11.Sagvolden G, Giaever I, Pettersen EO, Feder J. Cell adhesion force microscopy. Proc Natl Acad Sci U S A. 1999;96:471–76. doi: 10.1073/pnas.96.2.471. [DOI] [PMC free article] [PubMed] [Google Scholar]
- 12.Qiu Q, Sayer M, Kawaja M, Shen X, Davies JE. Attachment, morphology, and protein expression of rat marrow stromal cells cultured on charged substrate surfaces. J Biomed Mater Res, Part A. 1998;42:117–27. doi: 10.1002/(sici)1097-4636(199810)42:1<117::aid-jbm15>3.0.co;2-i. [DOI] [PubMed] [Google Scholar]
- 13.Schneider A, Bolcato-Bellemin AL, Francius G, Jedrzejwska J, Schaaf P, Voegel JC, et al. Glycated polyelectrolyte multilayer films: Differential adhesion of primary versus tumor cells. Biomacromolecules. 2006;7:2882–89. doi: 10.1021/bm0605208. [DOI] [PMC free article] [PubMed] [Google Scholar]
- 14.Thompson MT, Berg MC, Tobias IS, Rubner MF, Van Vliet KJ. Tuning compliance of nanoscale polyelectrolyte multilayers to modulate cell adhesion. Biomaterials. 2005;26:6836–45. doi: 10.1016/j.biomaterials.2005.05.003. [DOI] [PubMed] [Google Scholar]
- 15.Richert L, Schneider A, Vautier D, Vodouhe C, Jessel N, Payan E, et al. Imaging cell interactions with native and crosslinked polyelectrolyte multilayers. Cell Biochem Biophys. 2006;44:273–85. doi: 10.1385/CBB:44:2:273. [DOI] [PubMed] [Google Scholar]
- 16.Blacklock J, Seivers TK, Handa H, You Y-Z, Oupickỳ D, Mao GZ, et al. Cross-linked bioreducible layer-by-layer films for increased cell adhesion and transgene expression. J Phys Chem B. 2010;114:5283–91. doi: 10.1021/jp100486h. [DOI] [PMC free article] [PubMed] [Google Scholar]
- 17.Lo CM, Wang HB, Dembo M, Wang YL. Cell movement is guided by the rigidity of the substrate. Biophys J. 2000;79:144–52. doi: 10.1016/S0006-3495(00)76279-5. [DOI] [PMC free article] [PubMed] [Google Scholar]
- 18.Beningo KA, Lo CM, Wang YL. Flexible polyacrylamide substrates for the analysis of mechanical interactions at cell-substrate adhesions. Methods Cell Biol. 2002;69:325–39. doi: 10.1016/s0091-679x(02)69021-1. [DOI] [PubMed] [Google Scholar]
- 19.Helenius J, Heisenberg CP, Gaub HE, Muller DJ. Single-cell force spectroscopy. J Cell Sci. 2008;121:1785–91. doi: 10.1242/jcs.030999. [DOI] [PubMed] [Google Scholar]
- 20.te Riet J, Zimmerman AW, Cambi A, Joosten B, Speller S, Torensma R, et al. Distinct kinetic and mechanical properties govern ALCAM-mediated interactions as shown by single-molecule force spectroscopy. J Cell Sci. 2007;20:3965–76. doi: 10.1242/jcs.004010. [DOI] [PubMed] [Google Scholar]
- 21.Evans EA, Calderwood DA. Forces and bond dynamics in cell adhesion. Science. 2007;316:1148–53. doi: 10.1126/science.1137592. [DOI] [PubMed] [Google Scholar]
- 22.Schwarz US, Balaban NQ, Riveline D, Bershadsky A, Geiger B, Safran SA. Flexible polyacrylamide substrata for the analysis of mechanical interactions at cell-substratum adhesions. Biophys J. 2002;83:1380–94. [Google Scholar]
- 23.Engler AJ, Sen S, Sweeney HL, Discher DE. Matrix elasticity directs stem cell lineage specification. Cell. 2006;126:677–89. doi: 10.1016/j.cell.2006.06.044. [DOI] [PubMed] [Google Scholar]
- 24.Fery A, Scholer B, Cassagneau T, Caruso F. Nanoporous thin films formed by salt-induced structural changes in multilayers of poly(acrylic acid) and poly(allylamine) Langmuir. 2001;17:3779–83. [Google Scholar]
- 25.Dubas ST, Schlenoff JB. Swelling and smoothing of polyelectrolyte multilayers by salt. Langmuir. 2001;17:7725–27. [Google Scholar]
- 26.Dubas ST, Schlenoff JB. Factors controlling the growth of polyelectrolyte multilayers. Macromolecules. 1999;32:8153–60. [Google Scholar]
- 27.Murphy MC, Rasnik I, Cheng W, Lohman TM, Ha TJ. Probing single stranded DNA conformational flexibility using flourescence spectroscopy. Biophys J. 2004;86:2530–37. doi: 10.1016/S0006-3495(04)74308-8. [DOI] [PMC free article] [PubMed] [Google Scholar]
- 28.Blacklock J, You Y-Z, Zhou Q-H, Mao GZ, Oupický D. Gene delivery in vitro and in vivo from bioreducible multilayered polyelectrolyte films of plasmid DNA. Biomaterials. 2009;30:939–50. doi: 10.1016/j.biomaterials.2008.10.012. [DOI] [PMC free article] [PubMed] [Google Scholar]
- 29.Wan L, You Y, Zou Y, Oupickỳ D, Mao GZ. DNA release dynamics from bioreducible poly(amido amine) polyplexes. J Phys Chem B. 2009;113:13735–41. doi: 10.1021/jp901835u. [DOI] [PMC free article] [PubMed] [Google Scholar]
- 30.Fischer D, Li YX, Ahlemeyer B, Krieglstein J, Kissel T. In vitro cytotoxicity testing of polycations: influence of polymer structure on cell viability and hemolysis. Biomaterials. 2003;24:1121–31. doi: 10.1016/s0142-9612(02)00445-3. [DOI] [PubMed] [Google Scholar]
- 31.Godbey WT, Wu KK, Mikos AG. Poly(ethylenimine)-mediated gene delivery affects endothelial cell function and viability. Biomaterials. 2001;22:471–80. doi: 10.1016/s0142-9612(00)00203-9. [DOI] [PubMed] [Google Scholar]
- 32.Blacklock J, Mao GZ, Oupickỳ D, Möhwald H. DNA release dynamics from bioreducible layer-by-layer films. Langmuir. 2010 doi: 10.1021/la904673r. [DOI] [PMC free article] [PubMed] [Google Scholar]
- 33.Kern W. The evolution of silicon wafer cleaning technology. J Electrochem Soc. 1990;137:1887–92. [Google Scholar]
- 34.Wu B, Mao G, Ng KYS. Stepwise adsorption of a long trichlorosilane and a short aminosilane. Colloids Surf A. 2000;162:203–13. [Google Scholar]
- 35.Wu DC, Liu Y, Chen L, He CB, Chung TS, Goh SH. 2A2 + BB’B” approach to hyperbranched poly(amino ester)s. Macromolecules. 2005;38:5519–25. [Google Scholar]
- 36.Ducker WA, Senden TJ, Pashley RM. Direct measurement of colloidal forces using an atomic force miscroscope. Nature. 1991;353:239–41. [Google Scholar]
- 37.Lulevich VV, Radtchenko IL, Sukhorukov GB, Vinogradova OI. Deformation properties of nonadhesive polyelectrolyte microcapsules studied with the atomic force microscope. J Phys Chem B. 2003;107:2735–40. [Google Scholar]
- 38.Butt HJ, Jaschke M. Calculation of thermal noise in atomic-force microscopy. Nanotechnology. 1995;6:1–7. [Google Scholar]
- 39.Hutter JL, Bechhoefer J. Calibration of atomic-force microscope tips. Rev Sci Instrum. 1993;64:1868–73. [Google Scholar]
- 40.Laney DE, Garcia RA, Parsons SM, Hansma HG. Changes in the elastic properties of cholinergic synaptic vesicles as measured by atomic force microscopy. Biophys J. 1997;72:806–13. doi: 10.1016/s0006-3495(97)78714-9. [DOI] [PMC free article] [PubMed] [Google Scholar]
- 41.McAloney RA, Sinyor M, Dudnik V, Goh MC. Atomic force microscopy studies of salt effects on the morphology of polyelectrolyte multilayer films. Langmuir. 2001;17:6655–63. [Google Scholar]
- 42.Lee L, Cavalieri F, Johnston APR, Caruso F. Influence of salt concentration on the assembly of DNA multilayer films. Langmuir. 2010;6:3415–22. doi: 10.1021/la9032145. [DOI] [PubMed] [Google Scholar]
Associated Data
This section collects any data citations, data availability statements, or supplementary materials included in this article.