Summary
Permutation tests are widely used in genomic research as a straightforward way to obtain reliable statistical inference without making strong distributional assumptions. However, in this paper we show that in genetic association studies it is not typically possible to construct exact permutation tests of gene-gene or gene-environment interaction hypotheses. We describe an alternative to the permutation approach in testing for interaction, a parametric bootstrap approach. Using simulations, we compare the finite-sample properties of a few often-used permutation tests and the parametric bootstrap. We consider interactions of an exposure with single and multiple polymorphisms. Finally, we address when permutation tests of interaction will be approximately valid in large samples for specific test statistics.
Keywords: Interaction testing, Parametric bootstrap, Permutation methods
Introduction
Permutation tests (Ernst (2004), Higgins (2004)) are very popular in genomic research (Leak, et al. (2009), Hu, et al. (2008), Faulkner, et al. (2009)). They are simple to compute where analytic approaches may be intractable, and can be exact where analytic results may be only approximate. Rather than comparing the observed value of a test statistic to its distribution under repeated sampling, a permutation test compares the observed value to a distribution generated by a group of permutations that would not affect the distribution if the null hypothesis were true (Cox & Hinkley 1997, Chap. 6.2). The main limitation of permutation tests is that they are only applicable when the null hypothesis being tested specifies a suitable group of permutations under which the distribution of the data would be unaffected.
The use of permutation methods for testing in the regression model with one main effect (or, more simply, in tests of association of two variables) dates back at least to Fisher's exact test (Fisher 1935). From data vectors G and Y we create a new data set either by permuting the entries of G to give data (G*, Y) or permuting the entries of Y to give data (G, Y*). The test statistic is evaluated on the new data to give a sample from the permutation distribution, and this procedure is repeated to estimate the permutation distribution as accurately as is desired. A p-value of the test statistic is computed based on the permutation distribution. The procedure is the same whether the predictor variable is continuous or categorical (Ernst 2004).
When there are two predictors G and Z, permutation testing can become more complicated (Anderson & Robinson 2001). Testing for both main effects being zero is possible, by permuting the outcome Y and leaving G and Z unchanged, and using datasets (G, Z, Y*) to compute the permutation distribution of a test statistic. However, an exact test for one specific main effect being zero, i.e., testing partial regression coefficients, typically does not exist, as it would require the true value of the other main effect to be known. Anderson & Robinson (2001) compare four approximate permutation tests for partial regression coefficients in models with two main effects, highlighting the Freedman & Lane (1983) method. They note that, typically, the exact test for both main effects is not even approximately valid for testing one main effect. One special case of an available exact test for a main effect of G is when Z is categorical, with several replicates of each of the fixed values. In this case, permutations of Y or G can be done within the groups defined by Z. In genetic applications, a binary covariate Z such as treatment or a categorical genotype at a single nucleotide polymorphism can be used in this way.
A summary of permutation testing in regression for a non-statistical audience can be found in Anderson (2001). The article summarizes permutation testing in models with one and two main effects, and notes that in a model with two main effects and an interaction term there is no exact permutation method for testing the interaction term. For tests of interactions, even with categorical G and Z no exact permutation method is available (Anderson 2001). This is because permutation of Y within levels of G and levels of Z generates new data with the interaction effect unchanged – not removed, as we require for testing. In fact, for all models with one or two main effects and an interaction, Anderson (2001) notes that in general there is no exact permutation method for testing the interaction term.
Though well-established in the statistical literature on experimental design, this result is not widely known in genetic epidemiology or pharmacogenetics. Permutation-based tests for interaction have in fact been used frequently without any rationale given for their exact or approximate validity (Andrulionyte, et al. (2007), Mei, et al. (2007), Rana, et al. (2007), Chase, et al. (2005)). In this paper we show that these permutation tests need not even be approximately valid. We describe an alternative, the parametric bootstrap, which can give valid tests with moderate sample sizes, and which requires similar computational effort to a permutation test. Parametric bootstrap techniques have been correctly used in a genetic setting, e.g. in (Chen, et al. 2007). We will discuss the choice of test statistic and show that a standardized statistic, such as a z-score or p-value instead of a difference in means, can improve the accuracy of parametric bootstrap, and improve adherence of the Type I error rate to the nominal level.
The rest of the paper is organized as follows. In the next section we introduce models with an interaction term, and permutation concepts. We contrast the problem of testing for interaction with the problem of testing for overfitting in a model including interactions, where methods such as logic regression and multifactor-dimensionality reduction (MDR) do validly use permutation tests. We subsequently describe a parametric bootstrap approach to testing for interaction, and evaluate the performance of the parametric bootstrap compared to two types of permutations used commonly in interaction testing. Finally, we consider scenarios where permutation tests of interaction will be approximately valid in large samples for specific test statistics. These scenarios include some of the practical applications of permutation tests for interaction in genetic association studies.
Methods
Models and permutation tests
Interaction is a complex phenomenon, as described in an extensive review by Cox (Cox 1984). We first consider a test for interaction between the effects of a single genetic polymorphism G and a environmental exposure E on an outcome Y. The null hypothesis is that the interaction term is zero. An alternative statement of the null is that while G and E may have effects, these are specifically additive on the scale given by the model.
If Y is binary, as in a case-control study, the typical null hypothesis is that
| (1) |
If Y is continuous, a typical null hypothesis is that
| (2) |
An alternative hypothesis of interest in the binary case may be that
| (3) |
and, in the continuous case, that
| (4) |
Thus, the null hypothesis of no interaction is that γ= 0 in models (3) and (4).
For either type of Y and a single genetic polymorphism, two natural test statistics are; γ̂, the estimate of the interaction parameter γ, and the z statistic obtained by dividing γ̂ by its estimated standard error. Although γ̂ may appear to test the null hypothesis more directly, it is actually well-established that the bootstrap performs better for statistics such as the z-statistic, whose null distribution is approximately pivotal (Davison & Hinkley 1997). For this reason we investigate both the parameter estimate and the z-statistic.
When considering multiple genetic polymorphisms, there may be many polymorphism-specific estimates (γ̂i) and corresponding zi. For an omnibus test of no interaction between E and any polymorphism, we use test statistics maximum |γ̂i|, and the maximum |zi| or equivalently minimum pi value. While similar properties hold as for a single genetic polymorphism, we defer extended discussion of testing with multiple genetic polymorphisms until our simulation study.
A simple permutation test would fix G and E and permute all outcomes Y to give Y*, as used in Andrulionyte et al. (2007), Rana et al. (2007). Fixing G and E and permuting Y generates data in which Y* is independent of G and E. However, in equations (1) and (2), Y is not independent of G and E, unless βG = βE = 0, so the permuted data satisfy a much more restrictive null hypothesis than no-interaction. The permutation test will therefore be exact only for this more restrictive null hypothesis, that βG = βE = γ = 0. Our simulations (in the Results section) show this permutation test being anti-conservative when equation (1) holds, and conservative when equation (2) holds but βG or βE is non-zero.
Null hypothesis of one main effect
No difficulty arises in constructing a permutation test for the null hypothesis of one categorical main effect. For example, if we know that drug E (presumed binary) has an effect on binary outcome Y we may be interested in comparing the null hypothesis
| (5) |
to the full alternative (3), testing βG = γ = 0.
Permuting Y within individual strata defined by E maintains the difference between Y |E = 1 and Y |E = 0. The estimates for α and βE under the null hypothesis model in equation (5) will be the same in the permuted data as in the observed data. This permutation test examines whether G affects Y, without making any prior restriction on how E and G might interact. For example, if G and E are both genetic polymorphisms, a test such as this may be useful in building models of genetic effects in biological pathways where epistasis is likely to be important.
If there is only a single variable G to be considered, a permutation approach may not be necessary for reliable testing, as the usual χ2 approximation to the likelihood ratio test is likely to be adequate at any sample size where there is useful power. We note that in logistic regression in some cases the likelihood approximation may not work well, a feature often referred to as the Hauck-Donner phenomenon (Hauck & Donner 1977).
The particular value of the permutation test in this context is that it is applicable with multiple polymorphisms. For example, computing the likelihood ratio p-value for testing βGi = γi = 0 across several polymorphisms Gi and taking their minimum gives a test statistic for the null hypothesis that no G has an effect on Y adjusted for E. This minimum p-value will not itself have a uniform distribution, but it can be compared to its permutation distribution to give a valid test.
A permutation testing approach along these lines is used in MDR (Ritchie, et al. 2001), a method for reducing the dimensionality of multilocus information. Another example is logic regression (Ruczinski, et al. 2003), which construct predictors from Boolean combinations of binary covariates, and avoids overfitting using permutation applied to models that may contain many interaction terms. Permutation tests are also a very useful tool in situations of multiple testing problems when testing thousands of SNPs.
With a single environmental variable E a maximum z-statistic or minimum p-value can be computed across all SNPs. Comparing this test statistic to its distribution Y within individual strata defined by E controls the family-wise error rate, testing that no SNPs have effects on Y (Dudoit, et al. 2003). However, this permutation test is not valid for testing specifically no-interaction, i.e., γ = 0, when βG is non-zero, and may give Type I error rate that are too large or too small (Anderson 2001).
Null hypothesis of two main effects
For a valid permutation test of the hypothesis of no interaction, we would require a group of permutations that exactly preserves both βG and βE in equation (1) and (2), but also ensures γ = 0. In general it is impossible to construct such a group of permutations, as demonstrated by Edgington (1987, Chap. 6). If the permutations fix G and E they will not give γ = 0, and if they do not fix G and E they will not preserve the relationship between G and E and so will not preserve βG and βE.
In situations where G and E are known to be independent, however, it is possible to construct valid permutation tests for interaction in certain models. A linear model can be reparametrized by centering G and E at their means
so that the estimated interaction γ̂ is uncorrelated with β̂G and β̂E if the model errors are independent and identically-distributed. Permuting G and E independently will then give a valid permutation test for γ = 0.
An approach like this is used in the Family Based Association Tests (FBAT, (FBAT Toolkit Team 2004), based on Laird, et al. (2000)). The FBAT-I permutation test for gene-environment interaction on a multiplicative scale in case-parent trios. Laird et al assume that genetic variant G does not affect environmental exposure E, and condition on parental genotypes to remove any correlation between G and E due to population admixture. Their test statistic is
where s indexes parental genotypes and i indexes cases within a parental genotype stratum. They then permute (Gis − Ḡs) and (Eis − Ēs) independently, fixing the stratum s. This is an exact test of the null hypothesis that G and E are uncorrelated in cases, which is equivalent to the hypothesis of no interaction under the log-relative-risk model assumed in Laird et al. (2000):
This approach cannot be used to construct exact tests in a logistic regression model, as independence of G and E in the population then implies dependence among cases. However, if the event being studied is sufficiently rare, the logistic regression model will be well-approximated by a log relative risk model and the FBAT-I test will be approximately valid. The same approach of permuting E and G separately with strata defined by Y can be used in a case-only or case-control study of unrelated individuals when the disease is rare and G and E are independent. In studies of unrelated individuals, however, the test lacks the resistance to confounding by population admixture. In addition, the assumption that E and G are independent, which is unavoidable in case-parent trio studies, is restrictive in case-control studies (Mukherjee & Chatterjee 2008, Sec. 5).
Parametric bootstrap
Testing in a regression model framework requires computing the distribution of the test statistic under sampling from the null-hypothesis model. For instance, when testing the interaction term in a logistic regression model (3) with two main effects and an interaction term, the null hypothesis is
as in equation (1). In moderate to large sample sizes, a good approximation to the distribution of the test statistic under sampling from the true null-hypothesis model is the distribution of the test statistic under sampling from the fitted null-hypothesis model. That is, we fix G and E and generate Y* for each individual as a binary variable satisfying
| (6) |
where α̂ and β̂G, β̂E are estimated from the original data, under the null model (1). We then compute the test statistic for this simulated sample, and repeat this process many times. The empirical distribution these provide is an estimate of the test statistic's distribution under the null. Correspondingly, p-values are calculated as the proportion of simulated test statistics that are most extreme than the observed value.
If the distribution of the test statistic depends smoothly on the regression parameter values, which is true in all standard examples, this ‘parametric bootstrap’ approach gives an asymptotically valid test(Davison & Hinkley 1997, 4.2.3). Like the classical bootstrap, it samples from a distribution based on the observed data, but the simulations are from a fitted parametric model rather than the empirical distribution. To obtain a valid test, the fitted parametric model is chosen so that the null hypothesis is satisfied.
The algorithm for the parametric bootstrap can be summarized in the following steps:
Obtain parameter estimates from the original data by fitting a null-hypothesis model, such as equation (1).
Sample responses from the model obtained in Step 1.
Compute the test statistic, based on fitting the alternative-hypothesis model such as equation (3) to the samples obtained in Step 2.
Repeat Steps 2 and 3 many times, to obtain an approximate distribution of the test statistic.
Compute the test statistic for the original data, based on fitting the alternative-hypothesis model such as equation (3).
Compute the p-value, by comparing the test statistic in Step 5 to the distribution in Step 4.
Results
Simulations
Using simulation, we explore tests of no-interaction in regression models. These are for univariate outcomes, in samples of unrelated individuals.
We consider two types of genetic data (single and multiple polymorphisms), and of outcome (binary and continuous). We compare use of three resampling approaches, for a range of sample sizes.
Data generated for single polymorphisms
We assume G to be a binary exposure, such as a genetic polymorphism with dominant or recessive inheritance. It is assumed independent between subjects, and we denote P [G = 1] = pG. We also assume binary E, independent between subjects, where P [E = 1] = pE and logit pE = a + bG. Hence, b denotes the log odds ratio of association between G and E.
For binary outcomes, we generate data using the model
We set pG = 0.4, a = logit(0.2), b = log(2), resulting in pE|G=0 = 0.2, pE|G=1 = 0.333 and marginal pE = 0.253. We set α = 0.6, βE = 0.3 and βG = 3, resulting in marginal pY = 0.770. To simulate data under the null hypothesis of no interaction, we set γ= 0.
We generate the continuous outcomes as Y ~ N(μY, 1), where the model for the mean μY is
We set pG = 0.8, a = logit(0.2), b = log(2), resulting in pE|G=0 = 0.2, pE|G=1 = 0.333 and marginal pE = 0.307. We set α = 2, βE = 2 and βG = 3, resulting in marginal μY = 5.014. Again, γ = 0.
Data generated for multiple polymorphisms
Here, the genetic data consists of five polymorphisms G1, G2, …G5. To induce correlation among the various Gi, for each subject they were generated from the following hierarchical model;
Hence, conditional on the latent polymorphism G0, the individual Gi are independent and identically distributed, but they are marginally dependent.
We again assume binary E, independent between subjects, where P[E = 1] = pE and logit pE = a + bG0, with a = logit(0.2), b = log(2). We generated independent binary outcomes Y where
We generate continuous outcome with Y ~ N(μ, 1) where
For both the binary and the continuous outcome we set (βG1, βG2, βG3, βG4, βG5) = (3, 2, 1, 3, 1) and βE = 2. We set α = 0.6 for binary outcome and α = 2 for continuous outcome. To simulate under the null hypothesis of no interaction we set γGi = 0, i ∈ {1, …, 5}.
Resampling approaches
We compare three resampling approaches. These are;
A: Keep covariate pairs (G, E) in the single polymorphism situation or covariate 6-tuples (G1, G2, …, G5, E) in the multiple polymorphism situation and permute Y ;
B: Keep covariate pairs (G, E) in the single polymorphism situation or covariate 6-tuples (G1, G2, …, G5, E) in the multiple polymorphism situation and permute Y within levels of E;
C: Follow the algorithm on page 10.
Approach C is the parametric bootstrap; Approaches A and B are non-parametric permutation methods which might be often used in practice, perhaps erroneously.
In approach C, the null-model used in Steps 1 and 2 of the algorithm on page 10 differs for single and multiple polymorphisms, and also for binary and continuous outcomes. For a single polymorphism, we use the models given by fitting equation (1) for binary outcomes, and fitting the classical linear model with mean as in equation (2) for continuous outcomes. For multiple polymorphisms, we fit 5 separate models under the null. The models for the mean of binary outcome are
| (7) |
and for continuous outcomes we fit classical linear models with mean
| (8) |
For each simulated dataset, the sample responses for Step 2 of the parametric bootstrap are then simulated under these fitted models.
Test statistics and significance
Under approaches A, B and C, and for single and multiple polymorphisms, we compare two types of test statistic. Both are obtained by fitting models which include interaction terms.
For a single polymorphism, we first fit the model specified in equation (1) for binary outcomes, and equation (2) for continuous outcomes. We then consider test statistics γ̂ and its corresponding z-statistic, in both cases.
For multiple polymorphisms, we first fit 5 separate models. For binary outcomes model has mean
| (9) |
For continuous outcomes we fit classical linear models, with mean
| (10) |
The test statistics considered are the maximum of γ̂i, the maximum among the 5 estimates of the interaction parameters γi obtained above, and the minimum pi obtained testing each γi.
In permutation testing, the empirical p-value is calculated as
where so is the test statistic from the (unpermuted) original data, si is the statistic from permutation i, and N is the number of permutations performed.
Under the parametric bootstrap, the empirical p-value is
where so is the test statistic from the original data, si is the statistic under bootstrap i from the fitted data, and N is the number of bootstrapped datasets.
For valid tests, under the null hypothesis the empirical p-values should be uniformly distributed on the set i/(N + 1), which for large N is close to the uniform distribution on (0, 1). We will use quantile-quantile plots to compare the distribution of the computed p-values to the continuous uniform (0, 1) ideal. These are plotted on the − log10 scale to emphasize the area of interest, i.e. the small p-values. We highlight p-values of 0.05 and 0.01.
Our results are based on 10000 simulations for single polymorphisms, and on 1000 simulations for multiple polymorphisms. Within each simulation we took N = 1000 resamples. Reported results are for sample size n=20, 100 and 500. The patterns of results were similar for n = 50 and 200, and are omitted. Simulations were performed in R (R Development Core Team 2007).
Simulation results
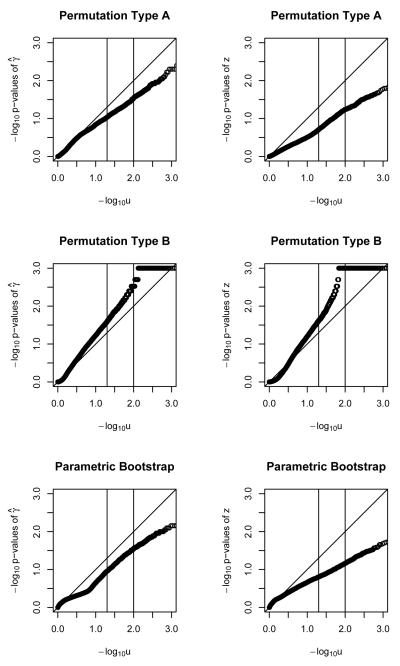
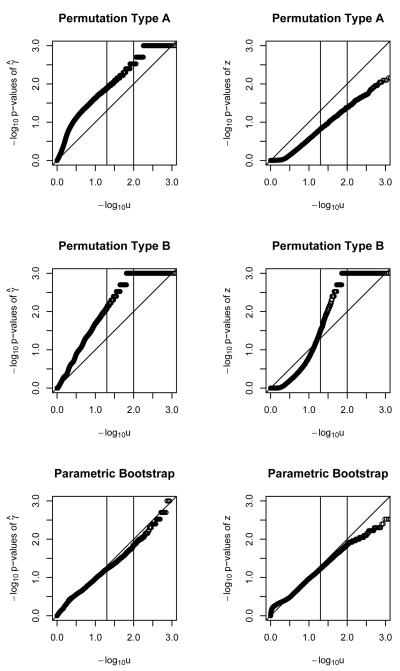
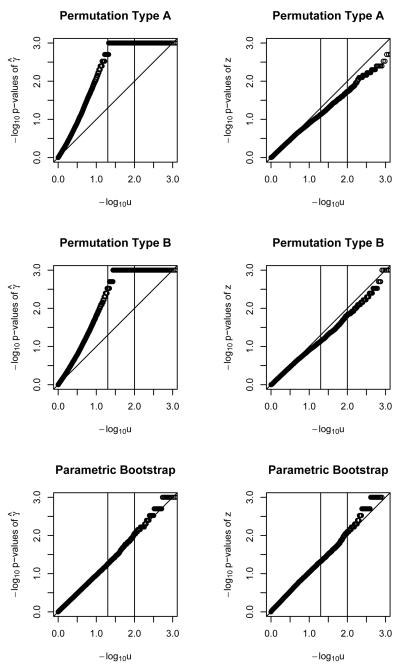
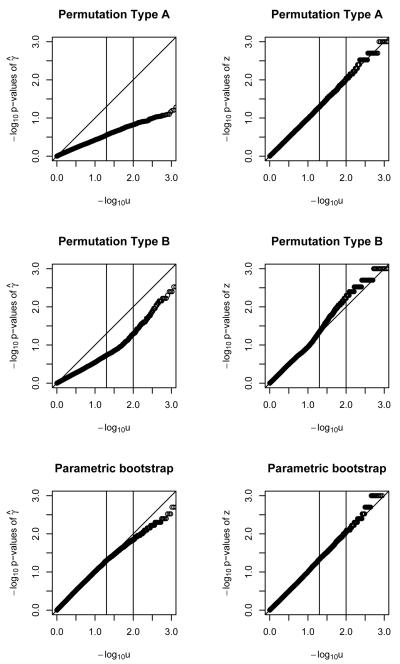
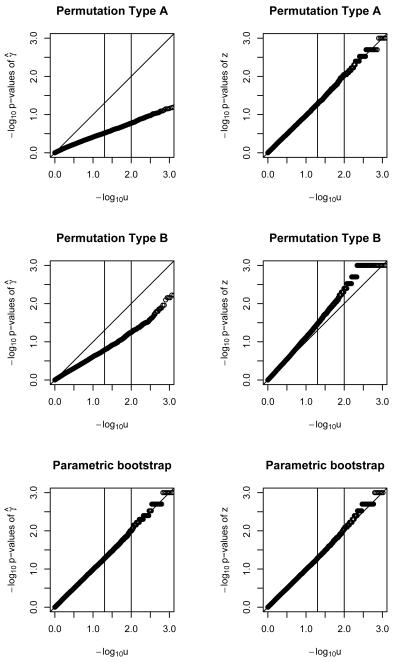
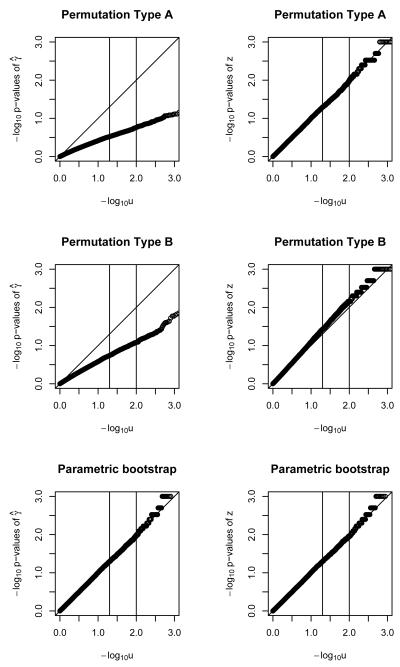
Figures 1, 2 and 3 show the results for a single polymorphism and binary outcomes. The parametric bootstrap approach is systematically conservative for n=20 (i.e. too-big p-values and too-small Type I error rate) but provides acceptable performance for sample sizes of n=50 and higher. The γ̂ statistic slightly outperforms the z statistic. The performance of the parametric bootstrap further improves with increasing sample size, for both statistics γ̂ and z. Permutation method A, using statistic γ̂ results in poor performance across the range of sample sizes. For sample size of n = 20 it is conservative. For higher sample sizes it is anti-conservative (i.e. too-small p-values and too-large Type I error rate) Using the z statistic is conservative up until n=200, when the size is approximately nominal. Permutation method B, using statistic γ̂ results in poorly-behaved anti-conservative tests across the whole range of sample sizes. Using the z statistic it provides invalid answers up to a sample size of n=200, where it starts being approximately correct.
Figure 1.
QQ plots for − log10 of p-values of γ̂ and z statistics for binary outcome, with a single polymorphism, under two permutations and a parametric bootstrap. Sample size of 20.
Figure 2.
QQ plots for − log10 of p-values of γ̂ and z statistics for binary outcome, with a single polymorphism, under two permutations and a parametric bootstrap. Sample size of 100.
Figure 3.
QQ plots for − log10 of p-values of γ̂ and z statistics for binary outcome, with a single polymorphism, under two permutations and a parametric bootstrap. Sample size of 500.
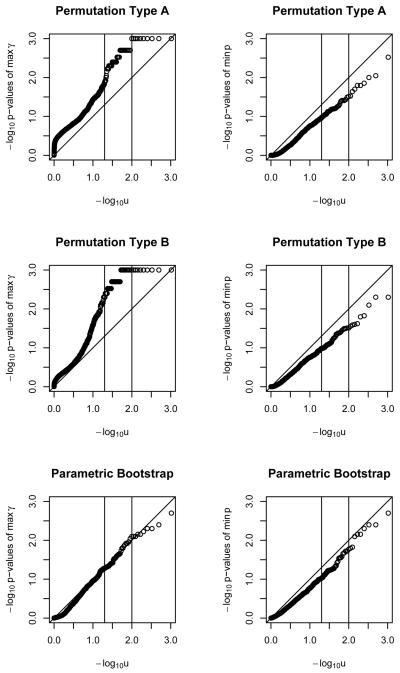
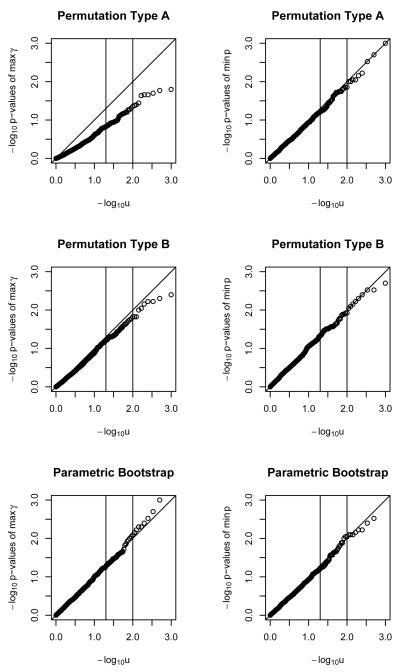
For multiple polymorphisms and binary outcomes, seen in Figure 4, the parametric bootstrap performance was acceptable for n=100 and larger under either test statistic. Methods A gave acceptable performance for n=500 and above using z but not γ̂, as did Method B.
Figure 4.
QQ plots for − log10 of p-values of maximum γ̂ and minimum p statistics for binary outcome, with multiple polymorphisms, under two permutations and a parametric bootstrap. Sample size of 500.
For single polymorphisms and continuous outcomes, shown in Figures 5, 6 and 7, the parametric bootstrap proves to be a valid approximate approach throughout, using either γ̂ or z. The accuracy of the p-values increases with sample size, though the performance is fairly good even for n = 20. For methods A and B, using test statistic γ̂ is again inappropriate over the whole range of sample sizes, being systematically conservative. Using z provides approximately valid answers, over the whole range of sample sizes.
Figure 5.
QQ plots for − log10 of p-values of γ̂ and z statistics for Normally distributed outcome, with a single polymorphism, under two permutations and a parametric bootstrap. Sample size of 20.
Figure 6.
QQ plots for − log10 of p-values of γ̂ and z statistics for Normally distributed outcome, with a single polymorphism, under two permutations and a parametric bootstrap. Sample size of 100.
Figure 7.
QQ plots for − log10 of p-values of γ̂ and z statistics for Normally distributed outcome, with a single polymorphism, under two permutations and a parametric bootstrap. Sample size of 500.
For multiple polymporphisms and continuous outcomes, the results were similar to the single polymorphism setting. The parametric bootstrap provides approximately valid test using both statistics, with the accuracy increasing with sample size. Using the maximum γ̂ test statistic, methods A and B both provide conservative tests for all sample sizes. Using methods A and B, the minimum p statistic provides approximately valid tests for all studied sample sizes. Figure 8 illustrates this for a sample size of 500.
Figure 8.
QQ plots for − log10 of p-values of maximu γ̂ and minimum p statistics for Normally distributed outcome, with multiple polymorphisms, under two permutations and a parametric bootstrap. Sample size of 500.
Rationale
The difficulty in constructing permutation tests of interaction arises because the distribution of the test statistic will typically depend on βG and βE and the association between G and E, and it is not usually possible to construct permutations that preserve these main effects. The parametric bootstrap evaluates the distribution of the test statistic at the estimated β̂G and β̂E and the observed G and E, and so will be valid when these estimates are close to the true value and the observations are representative of the population. In our simulations, it appears that this is practically the case, even with modest sample sizes.
If the test statistic had a distribution that was exactly or approximately the same for all (βG, βE) a permutation test that was valid for one value of (βG, βE) would be exactly or approximately valid for all (βG, βE). This is the case for the FBAT-I test. Permuting G and E separately will preserve the association between G and E, when they are independent, and the distribution of the test statistic does not depend on (βG, βE).
In a linear or logistic regression model, the parameter estimate γ̂ has an asymptotically Normal distribution. Dividing γ̂ by its estimated standard error gives a test statistic that, asymptotically, has a standard Normal distribution under the null, regardless of the value of other parameters in the model. This result extends to multiple parameters such as the set of k estimated interaction coefficients between E and many polymorphisms G1, G2, …, Gk, which asymptotically have a multivariate Normal distribution. Dividing each parameter estimate by its standard error gives a multivariate Normal distribution where each standardized parameter estimate is N(0, 1) under the null, and with correlation between estimates depending on the correlations among E, G1, …, Gk.
If, with multiple polymorphisms, the test statistic is the minimum p-value, its distribution will depend only on the distribution of the standardized parameter estimates. In large samples this distribution will be the same for all (βG, βE), and even in small samples it will be approximately free of (γG, βE). Now, a permutation test that fixes E and G and permutes Y will have the correct associations among E, G1, …, Gk but not the correct (βG, βE), so as the test statistic's distribution does not depend on (βG, βE) in large samples, the tests will be asymptotically valid.
For tests of main effects, permutation approaches are exactly in any size sample, and for arbitrary test statistics. As we have seen, permutation tests for interaction are only approximately valid, and departures from accuracy will depend on both sample size and choice of test statistic.
We believe that the permutation tests are conservative for linear regression because setting the main effects to zero puts the variation explained by the main effects back into the residual variance. Therefore, the variance is too large and this makes the p-value too large, resulting in a conservative test. We believe the permutation tests tend to be liberal for logistic regression because of the non-collapsibility of the logistic model.
Discussion
The statistical literature shows that exact permutation tests for interactions are not available in most situations. We have described two permutation tests that have been used in practice for interaction testing, and showed that they are not exact. The error in the tests can be substantial. A practical alternative for interaction testing is the parametric bootstrap. In our simulations the parametric bootstrap, while not exact, always outperformed the invalid permutation tests. Since the parametric bootstrap performs better and does not require greater computational effort, it could be recommended for scenarios similar to our simulations.
We contrasted two types of test statistics, based on approximately pivotal (i.e. based on z) and not pivotal (i.e. based on γ̂). For the parametric bootstrap these test statistics gave similar performance in our simulations, but the Type I error rate using permutation methods was substantially less accurate when using non-pivotal quantities. Permutation methods did perform acceptably when the sample size was large, and when approximately-pivotal test statistics were used.
It is important to remember that neither the parametric bootstrap nor the permutation tests are exact tests for interaction in small samples. It is also important to remember that, in contrast to the hypothesis of no association, the hypothesis of no interaction is intrinsically dependent on the form of the model. Any approach to testing for interaction must therefore be model-based to some extent.
References
- Anderson MJ. Permutation tests for univariate and multivariate analysis of variance and regression. Can. J. Fish. Aquat. Sci. 2001;58:626–639. [Google Scholar]
- Anderson MJ, Robinson J. Permutation tests for linear models. Australian & New Zealand Journal of Statistics. 2001;43:75–88. [Google Scholar]
- Andrulionyte L, et al. Single Nucleotide Polymorphisms of the Peroxisome Proliferator Activated Receptor-α Gene (PPARA) Influence the Conversion From Impaired Glucose Tolerance to Type 2 Diabetes. Diabetes. 2007;56:1181–1186. doi: 10.2337/db06-1110. [DOI] [PubMed] [Google Scholar]
- Chase K, et al. Interaction between the X chromosome and an autosome regulates size sexual dimorphism in Portuguese Water Dogs. Genome Res. 2005;15:1820–1824. doi: 10.1101/gr.3712705. [DOI] [PMC free article] [PubMed] [Google Scholar]
- Chen J, et al. A Partially Linear Tree-based Regression Model for Assessing Complex Joint Gene–gene and Gene–environment Effects. Genetic Epidemiology. 2007;31:238–251. doi: 10.1002/gepi.20205. [DOI] [PubMed] [Google Scholar]
- Cox DR. Interaction (with discussion) International Statistical Review. 1984;52:1–31. [Google Scholar]
- Cox DR, Hinkley DV. Theoretical Statistics. 1997 CRC Press. [Google Scholar]
- Davison AC, Hinkley DV. Bootstrap Methods and Their Applications. Cambridge University Press; 1997. [Google Scholar]
- Dudoit S, et al. Multiple hypothesis testing in microarray experiments. Statistical Science. 2003;18:71–103. [Google Scholar]
- Edgington ES. Randomization Tests. Marcel Dekker; New York: 1987. [Google Scholar]
- Ernst MD. Permutation methods: A basis for exact inference. Statistical Science. 2004;19:676–685. [Google Scholar]
- Faulkner GJ, et al. The regulated retrotransposon transcriptome of mammalian cells. Nature Genetics. 2009;41:563–571. doi: 10.1038/ng.368. [DOI] [PubMed] [Google Scholar]
- FBAT Toolkit Team Family Based Association Testing software. 2004 [Google Scholar]
- Fisher RA. The Design of Experiments. Edinburgh; Oliver and Boyd: 1935. [Google Scholar]
- Freedman D, Lane D. A nonstochastic interpretation of reported significance levels. J. Bus. Econom. Statist. 1983;1:292–298. [Google Scholar]
- Hauck WW, Donner A. Wald's Test as Applied to Hypotheses in Logit Analysis. Journal of the American Statistical Association. 1977;72:851–853. [Google Scholar]
- Higgins JJ. An Introduction to Modern Nonparametric Statistics. Thomson, Brooks/Cole; Pacific Grove, CA: 2004. [Google Scholar]
- Hu Y, et al. Identification of Association of Common AGGF1 Variants with Susceptibility for Klippel-Trenaunay Syndrome Using the Structure Association Program. Annals of Human Genetics. 2008;72:636–643. doi: 10.1111/j.1469-1809.2008.00458.x. [DOI] [PMC free article] [PubMed] [Google Scholar]
- Laird NM, et al. Implementing a Unified Approach to Family-Based Tests of Association. Genetic Epidemiology. 2000;19(Suppl 1):36–42. doi: 10.1002/1098-2272(2000)19:1+<::AID-GEPI6>3.0.CO;2-M. [DOI] [PubMed] [Google Scholar]
- Leak TS, et al. Variants in Intron 13 of the ELMO1 Gene are Associated with Diabetic Nephropathy in African Americans. Annals of Human Genetics. 2009;73:152–159. doi: 10.1111/j.1469-1809.2008.00498.x. [DOI] [PMC free article] [PubMed] [Google Scholar]
- Mei L, et al. Evaluating gene × gene and gene × smoking interaction in rheumatoid arthritis using candidate genes in GAW15. BMC Proceedings. 2007;17 doi: 10.1186/1753-6561-1-s1-s17. [DOI] [PMC free article] [PubMed] [Google Scholar]
- Mukherjee B, Chatterjee N. Exploiting Gene-Environment Independence for Analysis of Case–Control Studies: An Empirical Bayes-Type Shrinkage Estimator to Trade-Off between Bias and Efficiency. Biometrics. 2008;64:685–694. doi: 10.1111/j.1541-0420.2007.00953.x. [DOI] [PubMed] [Google Scholar]
- R Development Core Team . R: A language and environment for statistical computing. R Foundation for Statistical Computing; Vienna, Austria: 2007. ISBN 3-900051-07-3. [Google Scholar]
- Rana BK, et al. Population-Based Sample Reveals Gene-Gender Interactions in Blood Pressure in White Americans. Hypertension. 2007;49:96–106. doi: 10.1161/01.HYP.0000252029.35106.67. [DOI] [PubMed] [Google Scholar]
- Ritchie MD, et al. Multifactor-Dimensionality Reduction Reveals High-Order Interactions among Estrogen-Metabolism Genes in Sporadic Breast Cancer. Am J Hum Genet. 2001;69:138–147. doi: 10.1086/321276. [DOI] [PMC free article] [PubMed] [Google Scholar]
- Ruczinski I, et al. Logic Regression. Journal of Computational and Graphical Statistics. 2003;12:475–511. [Google Scholar]


