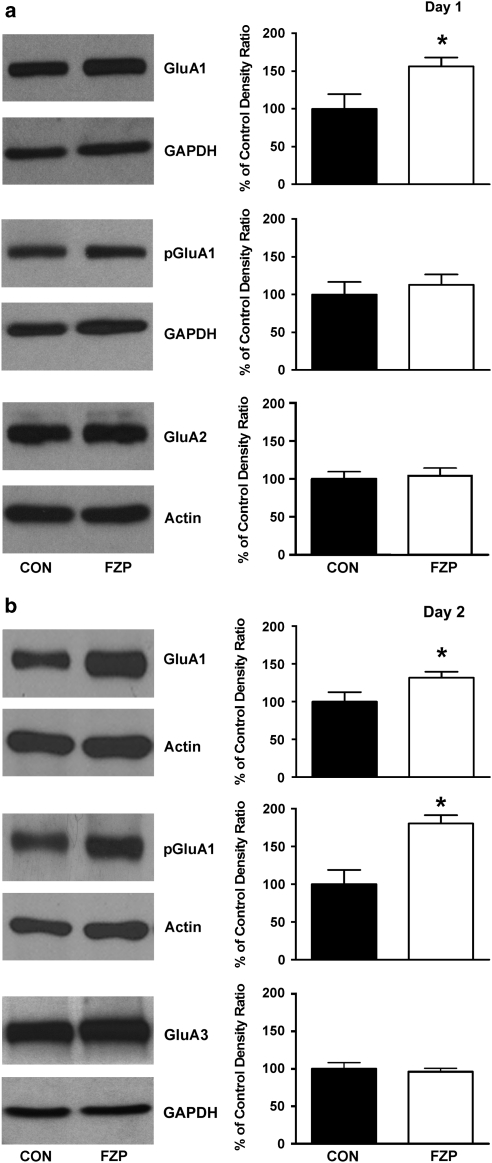
Figure 5.
GluA subunit levels in CA1 PSD-enriched subcellular fractions as a function of time after drug withdrawal. PSD-enriched subfractions were collected by ultracentrifugation of TritonX-100-resistant membranes pooled from three hippocampal CA1 minislices as described in Materials and methods. Representative immunoblots of total GluA1 and pSer831GluA1 with their respective loading controls are shown in PSD-enriched subfractions from (a) 1-day and (b) 2-day FZP-withdrawn rats in the leftmost panels. Histograms of integrated signal density as a percent of paired control density (n=4–11 lanes/group) are shown to the right. Only total-GluA1 expression levels were significantly enhanced in 1-day FZP-withdrawn rats, whereas both total and pSer831GluA1 levels were increased in 2-day FZP-withdrawn rats. There were no changes in GluA2 levels in 1-day (or 2-day; Das et al, 2008; Song et al, 2007) FZP-withdrawn rats. There were also no changes in GluA3 expression levels in the PSD-enriched fraction from 2-day FZP-withdrawn rats. Asterisks denote p<0.05.

